Transcription
Academy of Accounting and Financial Studies JournalVolume 23, Issue 2, 2019IMPACT OF BEHAVIORAL FINANCE ON STOCKINVESTMENT DECISIONSAPPLIED STUDY ON A SAMPLE OF INVESTORS ATAMMAN STOCK EXCHANGEAhmad Yousef Areiqat, Al-Ahliyya Amman UniversityAyman Abu-Rumman, Al-Ahliyya Amman UniversityYousef Satea Al-Alani, Al-Ahliyya Amman UniversityAlaa Alhorani, Al-Ahliyya Amman UniversityABSTRACTThis study aims to explore the impact of a number of prominent behavioral financevariables covered by the financial literature (overconfidence, loss aversion, risk perception andherding) that may affect the stock investment decision-making at Amman Stock Exchange (ASE),as well as determining which of these variables has the relative importance. The importance ofthis study stems from the fact that local studies focusing on the issue of behavioral finance arerare and therefore, the researchers expect that such study will enrich awareness in this domain.The study consisted of 165 individual investors who were active in the trading halls atAmman Stock Exchange during the research period. The data were collected through aquestionnaire prepared for the purpose of research and were analyzed by applying multiplestatistical tests (Multiple regression and Hierarchal regression analysis) and by using statisticalsoftware (SPSS) after approving the reliability and validity of the questionnaire.The results showed that there was an impact of the behavioral finance at Amman StockExchange represented by three behavioral factors affecting the investment decisions of theindividual investors which were: overconfidence, loss aversion, and herding, the results alsoshowed that the variable overconfidence had the most relative significance. The researchprovided some recommendations for investors trading at ASE to adopt scientific bases in makingstock investment decisions, and suggested to conduct further research to study the impact ofbehavioral finance on the different types of risks and yields at ASE.Keywords: Behavioral Finance, Stock Investment Decisions, Loss Aversion.INTRODUCTIONOver the past several decades, studies of financial theories and research were developedin order to establish a better understanding of the financial markets through using models whichdescribe investors as “rational”. Such description indicates that there are usually risk and returntradeoff in all types of financial decisions especially the stock investment decisions.Quite a few financial theories assumed that investors face little difficulty in makingdecisions in stocks’ investment because they are well-informed, careful and consistent. Amongthe most important financial theories were two theories: Modern Portfolio Theory and CapitalAsset Pricing Model (CAPM) which revealed that investors were not confused by the way theyget information which was not controlled by their behavioral finance factors. However, the11528-2635-23-2-375
Academy of Accounting and Financial Studies JournalVolume 23, Issue 2, 2019results of applied studies in the developed global capital markets found that many phenomenaregarding the stock investment decisions cannot be explained. Meanwhile, behavioral financehad been growing specifically because of the fact that investors rarely behave according to theassumptions suggested in these financial theories.The domain of behavioral finance seeks to better understand and explain how stockinvestment decision-making was influenced by financial behavioral factors, as betterunderstanding of these factors helps the investors to select a better stock investment decisionmaking policy.This research main aim is to verify the important factors that may affect stock investmentdecision-making at Amman Stock Exchange (ASE), where the applied research results haddiffered in identifying any of those factors as the most influential on stock investment decisionmaking. Several studies pointed out to the following factors: overconfidence (over-estimateinvestors’ knowledge, under-estimate risks, and overstress their ability to control events), riskperception (individual’s assessment of the inherent risk in a given situational problem, herding(following the trend), and loss aversion (avoiding losses is more important than acquiring gains).Investors in capital asset exchanges, typically take many different and importantdecisions, the most common are taking investment decisions in order to maximize their wealth;whereas other investors are involved in considering market timing techniques to maximize theirwealth. On the contrary, some investors are more risk averters as they follow stocks that havelow risk levels; other investors deal with high risk stocks but apply some diversificationtechniques to control the haphazard risks. Therefore, this research seeks to investigate whetherthese related variables in investor decision-making process will be affected by behavioralfinancial factors at ASE.Statement of the ProblemIn the light of conventional financial theory, investors are supposed to be rational,wealth-maximizers and follow modern financial theories’ rules. The most important theories instock investment decision-making are Modern Portfolio Theory and Capital Asset PricingTheory, and the results of several empirical studies in various financial markets proved thatinvestment decisions were not always based on the fundamentals of modern financial theories; asa result, behavioral finance studies became important in stocks’ decision-making. Behavioralfinance was developed to explain investor behavior when traditional financial theory provides nosufficient explanations.Studies in this modern domain did not resolve the problem of determining which of thefollowing factors are most important in stock investment decision- making (overconfidence, lossaversion, risk perception and herding). The target of the research problem is to answer thefollowing main and sub-divided questions:The first main question is:“Is there an impact of behavioral factors on stock investment decision-making in ASE?”This question is sub-divided into the following sub-questions:1.2.3.4.Does overconfidence have impact on stock investment decision-making at ASE?Does loss aversion have an impact on stock investment decision- making at ASE?Does herding have an impact on stock investment decision-making at ASE?Does risk perception have an impact on stock investment decision- making at ASE?21528-2635-23-2-375
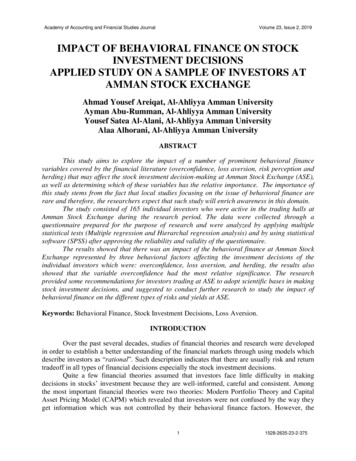
Academy of Accounting and Financial Studies JournalVolume 23, Issue 2, 2019Goals and Objectives of the StudyThe research focuses on achieving the following objectives:1.2.3.Identifying which of the behavioral finance factors are the most important factors that affect stockinvestment decision-making at ASE.Detecting which of the behavioral finance factors have an impact on stock investment decision-makingcan be attributed to demographic variables at ASE.Setting the backgrounds for further research and studies on behavioral finance.Hypotheses of the ResearchThe first major hypothesis in this research is:(H0)1: There is no impact of behavioral financial factors on stock investment decision-making at ASE.The major hypothesis is sub-divided into the following sub-hypotheses:(H0)1-1: There is no impact of overconfidence on stock investment decision- making at ASE.(H0)1-2: There is no loss aversion on stock investment decision-making at ASE.(H0)1-3: There is no impact of herding on stock investment decision-making at ASE.(H0)1-4: There is no impact of risk perception on stock investment decision- making at ASE.The second major hypothesis:(H0)2: There is no impact of behavioral finance factors on stock investment decision-making that can be attributedto demographic variables at ASE.RESEARCH MODELFIGURE 1RESEARCH MODELResearch Operational Terminology/DefinitionsBehavioral finance: According to Gachter et al. (2010) behavioral finance is the betterunderstanding of investment decisions that affect market prices which are influenced by humanand social cognitive and emotional biases. This concept will be measured through this study byoverconfidence, loss aversion, risk perception and herding (Figure 1).Stock investment decision-making: the decision to use allocated resources to increasefuture production output or income. In other words, it is purchasing an asset or item with the31528-2635-23-2-375
Academy of Accounting and Financial Studies JournalVolume 23, Issue 2, 2019hope that it will generate income or grow in the future. In finance, stock investment decision isthe decision of a monetary asset purchased with the idea that the asset will provide income in thefuture or rise and be sold at a higher price. Stock investment decision-making will be measuredby using these indicators: return rate expectation, the satisfaction of selling and buying decisions,risk diversification, holding stock time period and choosing stock bulks and types (Rachna,2014).Significance of the Study1.The researchers hope that this study will be one of the pioneering studies in the domain of behavioralfinance at the local and regional levels.2.Investors can benefit from understanding the effects of behavioral financial factors on stock investmentdecision-making.3.All financial theories assumed their implementation in an efficient financial market, but empirical studiesconcluded that the best global financial markets were either Semi-Strong Form Efficient or Weak-FormEfficient, Amman Stocks Exchange was considered in its best condition a Weak-Form Efficient market(Rawashdeh & Squalli, 2005). This research will provide an introduction that can be considered morerealistic for studying the effective factors in stocks investment decision-making at Amman StockExchange.THEORETICAL FRAMEWORK LITERATURE REVIEWBehavioral FinanceBehavioral finance was defined as the study of the influence of psychology on thebehavior of financial practitioners and the subsequent effect on markets which help to explainwhy and how markets might be inefficient (Sewell, 2001). The work of Kahneman & Tversky(1974) revealed that people do not employ statistical methods in their decision-making, but theyrely on a limited number of heuristic principles in their decision-making.Kahneman & Tversky are considered the fathers of behavioral finance. Since the 1960sthey have published about 200 papers and articles, most of them were related to the concepts ofbehavioral finance (Anissimov, 2004; Barberis & Thaler, 2002).Islam (2012) was more specific in defining behavioral finance by underlining the buyingand selling decisions regarding stock market investors. According to Gachter et al. (2010)behavioral finance is the better understanding of the investment decisions that affects marketprices which relate to human and social cognitive and emotional biases. Ritter (2003) alsodefined behavioral finance as behavioral factors affecting individuals' decision-making.According to Appiah & McMahon (2002), behavioral finance is the study of how financialpractitioners act and interact on financial information and the subsequent effects on markets.Pompain (2006) argued that behavioral finance tackles the behavioral factors that affect financialdecisions.Alrabadi et al., 2017conducted a study that investigates the existence of behavioral biasesin Amman Stock Exchange and their effect on investment performance from investor’s point ofview. In specific, the effects of overconfidence bias, familiarity bias, loss aversion bias,disposition bias, availability bias, representativeness bias, confirmation bias and herding bias areinvestigated.41528-2635-23-2-375
Academy of Accounting and Financial Studies JournalVolume 23, Issue 2, 2019The researcher Al-Abdallah conducted a study titles “How behavioral biases affectinvestment decision”? (Evidence from Amman Stock Exchange, 2017).This study investigates the effect of behavioral biases on investment decision in AmmanStock Exchange. In specific, the effects of overconfidence bias, familiarity bias, loss aversionbias, disposition bias, availability bias, representativeness bias, confirmation bias and herdingbias are investigated.The importance of studying such topic comes from the consequences that thesebehavioral biases could have on the investors’ gains and losses and on the stock market as awhole.This study investigates the effect of behavioral biases on investment decision for 236investors in Amman Stock Exchange. In fact we focus on eight well-known behavioral biasesthat are found to affect investment decisions in other developed and emerging stock markets.These biases are overconfidence bias, familiarity bias, loss aversion bias, disposition bias,availability bias, representativeness bias, herding bias and confirmation bias. To the best ofauthor’s knowledge, this is the first study in Jordan that tackles such important topic.OverconfidenceInvestors tend to have too much confidence in the accuracy of their own judgments. So,researchers focused on detecting the accuracy of investors’ judgments and its relation with theirconfidences.The concept of overconfidence was tackled by many cognitive behavioral experimentsand surveys in which subjects overestimate their own predictive abilities and the precision of theinformation they’ve been given.Nevins (2004) defined overconfidence as people who overestimate their own abilities. Hefound that investors and analysts were particularly overconfident in the domains where they havesome knowledge. They approved that one effect of overconfidence is overtrading, which leads topoor investment decisions (Nevins, 2004). At the same time, overconfidence is the tendency ofpeople to overestimate their knowledge, abilities and the precision of their information (Bhandari& Deaves, 2006).Chuang & Lee (2006) found that overconfidence makes investors overweigh their ownprivate information at the expense of ignoring publicly available information, and they justifiedtheir research by studying other academic’ research and studies to prove that overconfidentinvestors mistakenly attribute market gains to their own ability to pick winning stocks.The view of Phung (2004) was that, overconfident individuals overestimate or exaggerate theirability to successfully perform a particular task.Many researchers studied overconfidence and analyzed the detrimental effects ofoverconfidence by investors; these studies revealed that investors were overconfident in theirinvesting abilities and such will result in making investment mistakes.Therefore, according to previous researchers the overconfidence factor is one of the mostdetrimental biases that an investor can show, and this is because investors behavioral arenaturally underestimating downside risk, trading too frequently, and holding under diversifiedportfolio.Those studies measured overconfidence by dividing its concept into several dimensions:Chaffai (2014) measured the overconfidence by using two dimensions (stock retained periods,amount of information to be collected).51528-2635-23-2-375
Academy of Accounting and Financial Studies JournalVolume 23, Issue 2, 2019Chuang & Lee (2007) measured overconfidence by (accumulated experience, colleaguesbenchmarking, brokerage firms’ consultancy, certainty of answers for random questions).Loss AversionAccording to Barberis & Huang, (2001) loss aversion refers to the difference level ofmental consequence that people may have from a similar size loss or gain.A number of studies on loss aversion argued that the possibility of a loss is on averagetwice as a powerful motivator as the possibility of making a gain of equal magnitude.Loss aversion is a bias that simply cannot be tolerated in financial decision- making. Itinstigates the exact opposite of what investors want: increased risk, with lower returns. Investorsshould take risk to increase gains, not to mitigate losses (Pompain, 2006).Hassan et al. (2014) questioned the respondents about the type of investment stocks thatthey decided to invest in (fixed saving (no losses) or forex stocks). In addition, they depended onthe same attitude that was applied by Kahneman & Tversky to measure loss aversion and thepercentage of loss amount.Chun & Ming (2009) measured loss aversion by using the following indicators:1.2.3.4.5.Focus on large loss in stock than missing a substantial gain (profits).Nervous feelings when large price drops have in invested stocks.Refuse increasing investment when the market performance is poor.When it comes to investment, no loss of capital (invested money) is more important than returns (profits).Avoid selling shares that have decreased in value and sell shares that have increased in value.Risk PerceptionSince the 1960s, the topic of risk perception was employed to explain investors’behaviors. In effect, within the framework of investor behavior, risk perception is the risk aninvestor believes exists in the stocks trading, whether or not a risk actually exists. The concept ofrisk perception has a strong foundation in the area of investor behavior that is rather analogous tothe discipline of behavioral finance.Perception is the process by which an individual is in search of preeminent clarificationof sensory information so that investor can make a final judgment based on their level ofexpertise and past experience.Risk perception is the subjective decision-making process that individuals employconcerning the assessment of risk and the degree of uncertainty.The notion of risk perception is best utilized with an approach that is interdisciplinary andmultidimensional in nature for a given decision, situation, activity or event as pointed out inRicciardi (2004). When an individual makes judgments relating to a financial instrument, theprocess incorporates the collection of financial risk measurements and behavioral risk indicators(Ricciardi, 2004).Researchers defined risk perception as a belief held by an individual, group, or societyabout the chance of occurrence of a risk or about the extent, magnitude, and timing of itseffect(s), and as a behavioral study researcher defines it is the way people “see” or “feel” towarda potential danger or hazard.Risk perception is a communication source which can prepare investors to obtain riskaccording to their understanding (Rana et al., 2011). So we dare say that the concept of riskperception attempts to explain the evaluation of a risky situation (event) on the basis of61528-2635-23-2-375
Academy of Accounting and Financial Studies JournalVolume 23, Issue 2, 2019instinctive and complex decision-making, personal knowledge, and acquired information fromthe outside environment.Researchers used the following indicators to measure risk perception:1.2.3.4.5.Fears to invest in stocks that don’t have a certain gain.Vigilant about stocks which show sudden changes in price or trading activity.Worries of investing in stocks that had a past negative performance in trading.Feelings about participating in a buy/sell at the stock market.Investment knowledge, experiences and education.HerdingHerding occurs when individuals’ private information is overwhelmed by the influence ofpublic information about the decisions of a herd or group. Evidence of group influence in manyfinancial decisions is consistent with bounded rationality. In an uncertain world, if we realize thatour own judgment is fallible then it may be rational to assume that others are better informed andfollow them (Hirshleifer & Teoh, 2003) Defined herding as a mutual imitation leading to aconvergence of action, and Sias defined herding as investors’ tendency to follow each other intoand out of the same stocks so we can say that the herd behavior is the tendency individuals haveto mimic the actions of a large group (Sias, 2004).Kengatharan (2013) measured herding factor by using the following indicators:1.Buying and selling decisions of other investors (Other investors’ decisions of buying and selling stockshave impact on your investment decisions).2.Choice of stock to trade of other investors (Other investors’ decisions of choosing stock types have impacton your investment decisions).3.Volume of stock to trade of other investors (Other investors’ decisions of the stock volume have impact onyour investment decisions).4.Speed of herding (You usually react quickly to the changes of other investors’ decisions and follow theirreactions to the stock market).A study titled: “Cross-Sectional Absolute Deviation Approach for Testing the HerdBehavior Theory: The Case of the ASE Index”, was conducted by Dr. Imad Zeyad Ramadan,Associate Prof., Department of Finance, Applied Science University, Amman, Jordan (2015.)This study aimed to test whether the herd behavior appears in the Amman Stock Exchange(ASE). Using data on a daily basis for a sample of companies in the Free Float Share WeightedIndex during the study period from the beginning of the, 2000 to the end of August 2014 andusing the Cross-Sectional Absolute Deviation (CSAD) Approach.The results found that the non-linear relationship between the cross sectional absolutedeviation of the stock returns and the return of the market portfolio is an inverse relationship(γ3 -0.179), so that the dispersion decreases with the increase in market rate of return, whichmeans that investors during the study period were emulating the performance of the marketwithout paying attention to the stock's characteristics regarding risk and return, which suggeststhat investors are taking the herd behavior.Sample of the StudyThe researchers used the random sampling and the study population included allindividual investors at Amman Stock Exchange (ASE). 165 questionnaires were distributedamong participants in trading halls of ASE, The researchers aimed to make his study71528-2635-23-2-375
Academy of Accounting and Financial Studies JournalVolume 23, Issue 2, 2019distinguished by generalizing its results. So thy selected the random sampling approach but whenthe researchers started to distribute the questionnaires, the found that there was a lack ofcooperation from the investors, while observing the trading process at the halls in the HousingBank Complex. Thus, they selected a more convenient sampling technique although somestudies do not recommend this technique which depends on applying a probability samplingtechnique.The distributed (165) questionnaires were retrieved, (15) questionnaires had beeneliminated to show the research lack of ability to analyze, so the rate of retrieved questionnaireswas (83.3%). The researcher thought that one reason for such lower rate was that investors wereusing new technologies in stock trading on the internet and applying smart analysis for eachstock that they already trade in.RESEARCH METHODOLOGYThe researchers adopted quantitative approach to collect data and answer the researchquestions using statistical analysis, such as means, standard deviation, and inferential statisticalmodels to test hypotheses.Instrumentation and MeasuresSelecting the tool of the data collection depends on many factors like the availability offacilities, the researcher expertise, the degree of needed accuracy, the time frame for the study,and the availability of costs and resources to conduct the data collection process. The researchersdeveloped a questionnaire that was distributed among the investors at ASE to measure thebehavioral finance factors that affect stock investment decision- making process.The survey consisted of (33) items, representing the research variables, all items of thequestionnaire were measured by a 5-point Likert scale with anchors ranging from 1 stronglydisagree to 5 strongly agree.Then the choices were identified along the five Likert scale (lower and upper limits) as follows:1.Arithmetic mean was considered normal (default) if the answer was (3) and represented a "neutral."2.The range was calculated according to the following equation: highest weight minus the lowest weight (51 4)3.The division mean for answers to five degrees represented a degree of agreement (strongly disagree,disagree, neutral, agree and strongly agree).4.The length of the cell was calculated according to the following equation: Range number of levels lengthof the cell 4 3 1.33.5.Added value of the length of the cell (1.33) to the beginning of the scale (the lowest value in the scale,namely, (1)) to determine the upper limit for the first cell (Valerie Hall, 2007), and thus became the lengthof the cells as shown in Table 1.Table 1THE LENGTH OF THE CELLS FIVE LIKERT SCALECategoriesRelative ImportanceFrom (1.00) to less than (2.33)LowFrom (2.33) to less than (3.66)ModerateFrom (3.66) to (5.00)High81528-2635-23-2-375
Academy of Accounting and Financial Studies JournalVolume 23, Issue 2, 2019RESULTS AND DISCUSSIONReliability TestsReliability comes at the forefront when variables developed from summated scales areused as predictor components in objective models. Since summated scales are an assembly ofinterrelated items designed to measure underlying constructs. Cronbach's alpha is an index ofreliability associated with the variation accounted for by the true score of the “underlyingconstruct”.Alpha coefficient ranges in value from 0 to 1 and may be used to describe the reliabilityof factors extracted from dichotomous (that is, questions with two possible answers) and/ormulti-point formatted questionnaires or scales (i.e., rating scale: 1 poor, 5 excellent). Thehigher the score, the more reliable the generated scale will be. Cronbach's Alpha was usedrevealed that Cronbach's alpha coefficient was (0.871) for all items, and values of (α) range0.821 to 0.915, which indicates that the questionnaire was reliable. The values of (α) of the studyvariables of were as illustrated in Table 2.Table 2RELIABILITY TESTS OF THE MODEL VARIABLESVariableNo. of ItemsReliability Coefficient (α )Loss k Perception60.915Behavioral Investment Factor200.856Stock Investment Decision130.847General rate330.871ValidityTwo methods were used to confirm the content validity: First, multiple sources of data(literatures and arbitrators) were used to develop and refine the model and measures. Theresearcher arbitrated the questionnaire by asking researchers, professors and PhD degree holderswith different specialties such as finance, business administrator and statistical analysis then tooktheir notes and views to develop the questionnaire. The second method of Pearson’s PrincipalComponent factor analysis was applied for all items included in the questionnaire. According toVallejo factor analysis helps to establish construct validity of what you are measuring. Moreover,factor loading value below 0.4 should be removed. Table 3 shows that all variables and variableitems were valid, since their factor loading values were more than 0.4.Table 3FACTORS LOADING FOR DEPENDENT AND INDEPENDENT VARIABLES AS AMEASURE FOR INSTRUMENT VALIDITYVariablesFactorExtractionLoss .6540.428Risk Perception0.7460.566Stock Investment Decision0.8460.75691528-2635-23-2-375
Academy of Accounting and Financial Studies JournalVolume 23, Issue 2, 2019Multi-Colleniority TestsTo test the existence of multi-colleniority phenomena between model variables, Pearsoncorrelation coefficients calculated between independent (predictor) variables, the results oftesting multi-colleniority between independents variables were explained by correlation matricesand VIF test as follows.Table 4MULTI-COLLENIORITY TEST FOR PREDICTOR VARIABLESVariableLoss AversionOverconfidence HerdingRisk PerceptionLoss 0.1471.000Risk Perception0.355**0.1060.312**1.000Note: (**) Significant at 0.01; (*) Significant at 0.05.Table 4 shows that the maximum value of correlation coefficient was between (lossaversion) and (Risk Perception), otherwise the values were less than or equals (0.355), whichmeans there were no perfect relationship between variables. In the statistical literature the value(0.80) and more considered as an indicator of multi-colleniority existence (Gujarati 2004).To ensure the above result, the Variance Inflation Factor (VIF) was calculated, the resultsare illustrated in the following Table 5.VariableLoss AversionOverconfidenceHerdingRisk PerceptionTable 5VIF FOR INDEPENDENT 30.8870.808Table 5, shows that all VIF values were greater than (1) and less than (5). This indicatesthat there was no multi-colleniority between independent variables.Normality TestMany studies especially those concentrating on the emerging stock markets and leastdeveloped economies reported that these markets were at a very high level of data nonnormality.Normality test investigates if the sample observations are normally distributed. The testcompared the values of observations distributed with normal distribution mean and standarddeviation, and showed that the sample was free of outliers. The null hypothesis was that “sampledistribution was normal”. If the test was significant, the distribution was non-normal. The maintests for the assessment of normality were Kolmogrov-Semernov (K-S) test and Shapiro-Wilktest. Table 6 shows the results of normality test.Table 6DISTRIBUTED SAMPLE NORMALITY 635-23-2-375
Academy of Accounting and Financial Studies JournalLoss AversionOverconfidenceHerdingRisk PerceptionStock Investment DecisionVolume 23, Issue 2, .2000.1410.064Table 6 reveals that all values of the test were not significant (Sig 0.05). This means thatthere were no outliers, and that the sample followed normal distribution.Statistical TreatmentThe study analyzed the collected data via Statistical Package for the Social Sciences(SPSS V.17) to achieve the objectives of this study: Fre
future or rise and be sold at a higher price. Stock investment decision-making will be measured by using these indicators: return rate expectation, the satisfaction of selling and buying decisions, risk diversification, holding stock time period and choosing stock bulks and types (Rachna, 2014). Significance of the Study 1.