Transcription
December 2, 2020REAL ESTATEOpportunitiesin Life ScienceReal EstateInvesting Technological advances and an aging U.S.demographic are boosting demand for medicalresearch and life science real estate space. We estimate the investable life science universe to be 73 billion, and will likely rise to 165 billion by 2030,or 6% as large as the 2.6 trillion office investableuniverse today. Life science employment has exhibited significantgrowth–particularly in existing “Research Clusters”–and the industry has been resilient during downturns(Exhibit 4). Investment in the life science sector may offerattractive relative value, but we believe there are alsoimportant risks to consider.
MetLife Investment Management2IntroductionEven before the onset of COVID-19, the life science real estate sector was gaining traction amongstinstitutional investors. The rise in demand for research and development of COVID-19 treatmentshas further increased investor interest in the sector and, in this report, we will outline what lifescience investments are, the factors that may drive future demand for life science space, and howwe think about relative value of investments in the sector today.Life science employment encompasses a wide range of fields. While some of the more commonlyknown branches of life sciences include genetics (study of human DNA and genome) orepidemiology, there are in fact dozens of additional fields of study that fall under the umbrella oflife sciences, and therefore use life science real estate.1 Since 2000, employment in this sector hasincreased by 41%, well above the 14% increase for the U.S. as a whole.2 This has contributed to bothfast and steady leasing demand growth.In terms of physical characteristics, life science properties are often mistakenly assumed to be acategory of office properties, similar to medical offices. Although life science properties look likeoffices and are often referred to as “life science offices”, they are physically often quite different.As measured by square feet, life science properties are often around half office space and half labspace, but also include unique characteristics such as 10–20% higher ceilings (relative to traditionaloffice), 50–100% excess floor load capacity, over 2x the cooling and heating capacity, and 75–100% increased electrical capacity, among others.3 These additional infrastructure requirementscontribute to higher average /SF rents for life science properties, and also limit conversions fromexisting office buildings into life science properties.Life science laboratory space is generally categorized as either a “wet lab” or a “dry lab”4, and wetlabs are slightly more common than dry labs.Wet laboratory space includes the use of chemicals, drugs, or other biological matter whichis tested and analyzed. Building needs for wet lab space may include safety components (ex:fume hoods, water stations) as well as separate building ventilation and utility connections. Drylaboratory spaces typically include space for materials, electronics, and instruments which needprecision temperature and humidity control.A number of secular trends have been driving demand for life science space, and we believe theseare likely to continue.
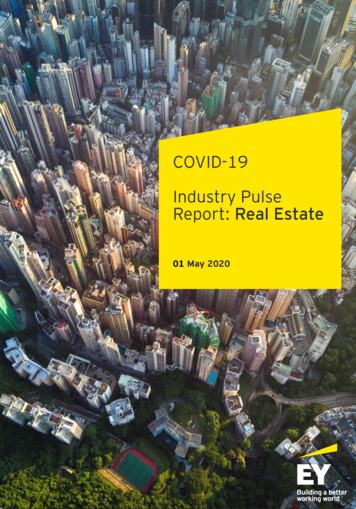
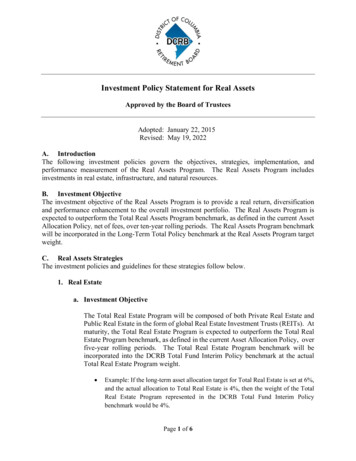
3MetLife Investment ManagementLong-Term Demand TailwindsAn aging population in the U.S.–coupled with longer life expectancies–is creating a larger marketfor therapies that enhance the quality of life for seniors (Exhibit 1).5 With an average age of 66years old, the Baby Boomer generation is expected to buoy demand for the types of drugs beingresearched and developed in life science assets.Exhibit 1 An Aging U.S. Population140ForecastPopulation, # in 3420372040204320462049055-59yrs60-64yrs65yrs Additionally, over the last few years, technological advancements such as machine learninghave led to novel discoveries and improvements in gene and cell therapies. These softwareadvancements have driven down research expenses for life science companies, therefore allowingfor increased innovation in the space.In recent years, the perceived commercial viability of the life science sector has materialized assignificant capital has flowed to biomedical companies and startups. Venture capital investment, forexample, stood at approximately 23 billion at the end of 2019, which compares to around 8 billion10 years prior.6 The life sciences sector also receives research grants from the National Institute ofHealth (NIH), which budgeted in excess of 30 billion to medical research in 20197 (Exhibit 2).Exhibit 2 Historical Life Science Funding ( billions)8353025201510502000 2001 2002 2003 2004 2005 2006 2007 2008 2009 2010 2011 2012 2013 2014 2015 2016 2017 2018 2019NIH FundingVC FundingBut these amounts are dwarfed by the capital provided by the R&D divisions of larger, privatecompanies. Largely comprised of pharmaceutical firms, total R&D spending reached 155 billion in2019, representing an average annual increase of 5% since 2012.9
4MetLife Investment ManagementThe increased investment amongst life science companies has naturally translated into aburgeoning need for Research & Development (R&D) and manufacturing space. Additionally, there’san increasing demand for numerous small-volume medicines that represent a departure from bulkR&D in a single location,10 which we believe is partially supporting demand for life science space.Now that we understand the sector’s primary drivers, we’ll focus on where demand is increasing.Research Clusters/FundamentalsThe preference for networking amongst industry professionals–as well as access to the talent andresources associated with higher education institutions–has focused life science demand intoresearch “clusters”. For example, from 2010 to 2018, 63% of total life science venture capital fundingwent to companies located in the Boston and San Francisco markets.11 By comparison, these twomarkets have accounted for approximately 30% of total venture capital funding in recent years.12Exhibit 3 Life Science Clusters13MarketInventory(Million SF)Vacancy Rate(%)Asking Rent( /SF Annual)Market Cap( Billion)Boston21.81% 87 27.8San Francisco21.97% 50 21.7San Diego19.69% 55 9.5Seattle11.35% 40 4.6Suburban Maryland10.74% 29 4.1Philadelphia9.711% 34 3.4Raleigh-Durham10.216% 22 2.6In our view, there are seven major life science research clusters across the U.S. San Francisco,Boston, and San Diego lead the pack in terms of total life science inventory; however, San Franciscoand Boston have much higher market values, which we believe could be attributed to the relativelylimited land availability in those markets.From a vacancy perspective, life science availability rates stand in the low 7% range on average,with certain research clusters such as Boston having near-zero vacancy rates.14 This has translatedinto 6% or greater annual rent growth in most of the research clusters in recent years,15 althoughgoing forward we expect rental growth to eventually slow to around the rate of inflation.Although these seven markets make up the majority of the U.S. life science market, there areemerging clusters in other areas. New York City, for example, has the third largest pipeline of lifesciences office development, has exhibited strong life science employment growth and has thesecond highest amount of research grants out of all U.S. metros.16Life science demand has historically been less cyclical, and maymodestly benefit from the COVID-19 recession.Although we are still too early in the COVID-19 recession to know for sure, during the prior threerecessions the life science sector had stronger demand than the broader economy.Looking forward, the World Economic Forum suggests COVID-19 will likely not be the last pandemic,and that better preparation is needed to fight future disease outbreaks.17 As a result, we believe thatlife science research funding could increase both to fight the current COVID-19 pandemic, and tobuild a better infrastructure for future diseases. At around 15 billion through the second quarter of2020, life sciences VC funding is well on pace to eclipse its prior-year record of 23 billion.
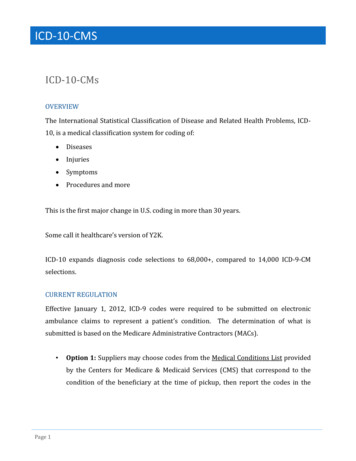
5MetLife Investment ManagementIn our view, life science employment is wellpositioned from both a near-term and longterm perspective. While most companies withinthe industry have experienced supply chainrelated headwinds, history suggests the sector’semployment base is resilient during recessionaryperiods (Exhibit 4). So far in the 2020 recession,the need to use specialized lab equipment hasgenerally contributed to spaces both remainingleased, and being physically used, unlike otherreal estate sectors that have struggled due tosocial distancing and shelter-in-place orders.While we expect the life sciences to benefit fromstrong demand drivers and the current marketenvironment, there are important investmentcharacteristics and considerations worth noting.Exhibit 4 Life Sciences EmploymentDuring Past omTotal Non-FarmGFCLife SciencesInvestment considerationsOver the next decade, we estimate the institutional life science real estate universe toapproximately triple in size, from about 73 billion today to 165 billion by 2030. If true, thiscould provide institutional investors with ample opportunity to increase allocations to the sector,especially in the development space.In our view, one of the key considerations for investing in life science real estate is the valueof the location, versus the value of the improvements. On a per square foot basis, life sciencebuildings in major research clusters often trade for a higher price than traditional office due togenerally higher market rents (Exhibit 5), as well as the typical “triple net” (NNN) lease structure,which typically translates into better profit margins as the landlord is reimbursed for insurance,maintenance, and taxes.Similarly, market rent growth within life science research clusters is a relative value factor worthunderstanding. Life science cap rates are typically similar or slightly tighter than similar-qualityoffice cap rates, reflecting both greater contractual rent increases, and expectations for bettermarket rent growth.Exhibit 5 Life Science vs. Traditional Office (MIM Estimates, as of December 2020)MetricLife ScienceTraditional Office 65 - 100 NNN 50 - 75 GrossCap Rate4.25% - 5.00%4.50% - 5.50%Price PSF 1,000 - 1,500 750 - 1,000Market RentWe believe greater rent growth expectations are justified as occupiers of life science space relyheavily on the surrounding network a typical research cluster has to offer, such as peer researchgroups or higher education institutions. Tenants are therefore increasingly willing to pay high rentsfor these resources. This location premium represents both a risk and an opportunity and should becarefully considered.The best parallel we are aware of may be the growth of the San Francisco and San Jose officesector over the last 30 years, as the technology industry grew and concentrated in Silicon Valley.Office investments in this area have achieved some of the strongest returns of any market in thecountry, but also illustrate the need to understand the underlying business model (such as what
MetLife Investment Management6occurred when VC firms propped up many local area “dot com” companies without tangiblebusiness models in the late 1990s). So far, we have seen very few signs of excessive VC fundingor unrealistic business model expectations in life science businesses, but recommend investorsremain sensitive to this dynamic going forward.Another investment consideration includes the initial buildout of R&D lab space in life sciencebuildings. As mentioned previously, unique characteristics related to life science buildings typicallymakes the buildout more expensive relative to traditional office space. However, these representone-time additional costs given the universal infrastructure for most life science tenants, whichcould lead to lower capital expenditures over the hold period relative to traditional office. This isprimarily due to the lower additional investment required to re-lease office space when a tenantrolls over. Historically, these types of capital expenditures have amounted to 15% of NOI for lifescience properties, which compares to nearly 30% for the overall office sector.20While we expect the broader sector to be largely resilient to COVID-19, life science companiesthat rely on VC funding tend to carry higher levels of credit risk. The probability of a drug failingto reach FDA approval is 85%, and this can give some company business models a binarypotential outcome.21 One potential method to reduce credit risk is attaining a Letter of Credit thatguarantees payment, regardless of a failure to meet lease obligations by the occupier, througha specified time period. The limited effort and capital required to backfill vacant space that wasmentioned previously could also serve as an additional mitigating factor to higher credit risks.A final key risk in our view is the regulatory risks associated with the broader health care industry.More specifically, rising prescription drug prices are an increasingly prevalent bi-partisan issue,and to the extent government regulations on drug prices impact the profitability of the industry,segments of the life science industry could face headwinds. Based on current proposals inWashington, we do not believe this is a near-term concern.ConclusionWe believe the life sciences sector is a viable alternative property type for investment withfavorable demand tailwinds. Despite the potential risks, we believe allocating capital to thesector alongside an experienced life science operator–either through acquisitions or ground-updevelopment–offers investors potential for favorable risk-adjusted , November 2019. https://artifacts.ai/what-is-life-science/Life Sciences: COVID-19 Report, Cushman Wakefield, June 2020.Lincoln Property Co, September tioning-a-building-for-life-science-tenants/, August 2020.United Nations – World Population Prospects, 2020.Q2 20 PitchBook NVCA Venture Monitor, July 2020.National Institute of Health Data Book.National Institute of Health Data Book, Pricewaterhouse Cooper, August cience-is-pandemic-proof-real-estate/, July 2020.2020 Global Life Sciences Outlook, Deloitte, January 2020.Life Science: Great Promise & Rapid Growth, Cushman Wakefield, February 2019.Q2 20 PitchBook NVCA Venture Monitor, July 2020.Life Sciences: COVID-19 Report, Cushman Wakefield, June 2020.Ibid.Ibid.PWC Innovation 1000 Report, 2019.Outbreak Readiness and Business Impact, World Economic Forum, January 2019.Bureau of Labor Statistics, Moody’s Economy.com, October 2020.MIM Analysis of NCREIF, Bureau of Labor Statistics, Cushman Wakefield, and GrandView Research data. September 2020.REIT Lab Space Insight Report, Green Street, May 2019.Ibid.
7MetLife Investment ManagementMetLife Investment Management Real Estate Research and StrategyWILLIAM PATTISONHead of Real Estate ResearchWilliam Pattison is the head of the real estate research & strategy team within therisk, research & analytics group of MIM. He is responsible for research and strategydevelopment in support of MIM’s real estate equity and debt platforms, working closelywith MIM’s regional offices and portfolio managers to craft the strategic house view, drivethought leadership initiatives, and project domestic and international capital markets. Willhas over 15 years of experience in institutional real estate research, valuation, and portfoliomanagement. He is a graduate of Iowa State University, where he earned his Bachelor ofScience degree in economics.REGINALD ROSSAssociate DirectorReginald Ross is an Associate Director in the Risk, Research, and Analytics Divisionof MetLife Investment Management (MIM). He is responsible for market forecasts,client engagement, investment committee participation. Reginald has over 16 years ofexperience in CRE financial and econometric modeling. He joined MetLife in 2019. Priorto joining MetLife, Reginald was a Director at JLL focusing on redevelopment financeand advisory. He began his career in investment banking at Wolfensohn & Co and UBS.Reginald earned a Bachelor’s degree in Economics from Morehouse College and an MBAfrom the Wharton School of Business at the University of Pennsylvania.MICHAEL STEINBERGAssociate DirectorMichael Steinberg is a member of the real estate research & strategy team within the risk,research & analytics group of MetLife Investment Management (MIM). He is responsiblefor development and maintenance of the team’s quantitative research models, marketforecasting, and communicating the team’s investment strategies and economic outlook.Prior to MetLife, Michael worked in both research and portfolio management capacitiesat UDR, a national multifamily REIT, and Reis, a leading real estate market research firm.Michael received a Bachelor’s degree in economics from the College of the Holy Crossand an M.B.A. from Columbia Business School.AUSTIN IGLEHARTSenior AnalystAustin Iglehart is an analyst on the real estate research & strategy team within the risk,research & analytics group of MetLife Investment Management (MIM). He is responsiblefor research & strategy development in support of MIM’s real estate equity and debtplatforms. In this role, Austin develops and maintains analytical tools for the researchteam, conducts market analyses in preparing team members for investment committee,contributes to the authoring of strategy whitepapers, assists team members in clientservice, and supports senior members of the research team in the development of longterm investment strategies. Austin earned his Bachelor of Science degree in finance atWake Forest University before joining the real estate research & strategy team in 2018.Ashleigh Simpson & Mark Leonhard contributed to this whitepaper.
About MetLife Investment ManagementMetLife Investment Management (MIM),1 MetLife, Inc.’s (MetLife’s) institutional investmentmanagement business, serves institutional investors by combining a client-centric approach withdeep and long-established asset class expertise. Focused on managing Public Fixed Income, PrivateCapital and Real Estate assets, we aim to deliver strong, risk-adjusted returns by building tailoredportfolio solutions. We listen first, strategize second, and collaborate constantly as we strive to meetclients’ long-term investment objectives. Leveraging the broader resources and 150-year history ofthe MetLife enterprise helps provide us with deep expertise in navigating ever changing markets. Weare institutional, but far from typical.For more information, visit: investments.metlife.comDisclosuresThis material is intended solely for Institutional Investors, Qualified Investors and Professional Investors. This analysis is not intended fordistribution with Retail Investors. This document has been prepared by MetLife Investment Management (“MIM”) solely for informationalpurposes and does not constitute a recommendation regarding any investments or the provision of any investment advice, or constituteor form part of any advertisement of, offer for sale or subscription of, solicitation or invitation of any offer or recommendation to purchaseor subscribe for any securities or investment advisory services. The views expressed herein are solely those of MIM and do not necessarilyreflect, nor are they necessarily consistent with, the views held by, or the forecasts utilized by, the entities within the MetLife enterprisethat provide insurance products, annuities and employee benefit programs. The information and opinions presented or contained inthis document are provided as the date it was written. It should be understood that subsequent developments may materially affect theinformation contained in this document, which none of MIM, its affiliates, advisors or representatives are under an obligation to update,revise or affirm. It is not MIM’s intention to provide, and you may not rely on this document as providing, a recommendation with respectto any particular investment strategy or investment. Affiliates of MIM may perform services for, solicit business from, hold long or shortpositions in, or otherwise be interested in the investments (including derivatives) of any company mentioned herein. This document maycontain forward-looking statements, as well as predictions, projections and forecasts of the economy or economic trends of the markets,which are not necessarily indicative of the future. Any or all forward-looking statements, as well as those included in any other materialdiscussed at the presentation, may turn out to be wrong.In the U.S. this document is communicated by MetLife Investment Management, LLC (MIM, LLC), a U.S. Securities Exchange Commissionregistered investment adviser. MIM, LLC is a subsidiary of MetLife, Inc. and part of MetLife Investment Management. Registration with theSEC does not imply a certain level of skill or that the SEC has endorsed the investment advisor.For investors in the EEA - This document is being distributed by MetLife Investment Management Limited (“MIML”), authorised andregulated by the UK Financial Conduct Authority (FCA reference number 623761), registered address Level 34 1 Canada Square LondonE14 5AA United Kingdom.For investors in Japan - This document is being distributed by MetLife Asset Management Corp. (Japan) (“MAM”), a registered FinancialInstruments Business Operator (“FIBO”).For Investors in Hong Kong - This document is being issued by MetLife Investments Asia Limited (“MIAL”), a part of MIM, and it has notbeen reviewed by the Securities and Futures Commission of Hong Kong (“SFC”).Past performance is not indicative of future results. No representation is being made that any investment will or is likely to achieve profitsor losses or that significant losses will be avoided. Investments in real estate involve significant risks, which include certain consequencesas a result of, among other factors, a decline in the real estate market as a whole, deterioration in the prospects for a particular industry orcompany, or changes in general economic conditions. Significant disruptions to the real estate markets could adversely affect the abilityto sell certain real estate investments. Any person contemplating an investment in real estate equity must be able to bear the risks and thestrategies discussed herein may not be suitable for all investors. The material is not intended to provide, and should not be relied on for,accounting, legal or tax advice, or investment recommendations. You should consult your tax or legal adviser about the issues discussedherein. The investments discussed may fluctuate in price or value. Investors may get back less than they invested.1 MetLife Investment Management (“MIM”) is MetLife, Inc.’s institutional management business and the marketing name for the followingaffiliates that provide investment management services to MetLife’s general account, separate accounts and/or unaffiliated/thirdparty investors: Metropolitan Life Insurance Company, MetLife Investment Management, LLC, MetLife Investment ManagementLimited, MetLife Investments Limited, MetLife Investments Asia Limited, MetLife Latin America Asesorias e Inversiones Limitada,MetLife Asset Management Corp. (Japan), and MIM I LLC.L1220009500[exp1222][All States], L1220009404[exp1222][All States], L1220009394[exp1222][All States], L1220009350[exp1222][All States]One MetLife Way Whippany, New Jersey 07981 2020 MetLife Services and Solutions, LLC
Real Estate Investing REAL ESTATE December 2, 2020 Technological advances and an aging U.S. demographic are boosting demand for medical research and life science real estate space. We estimate the investable life science universe to be