Transcription
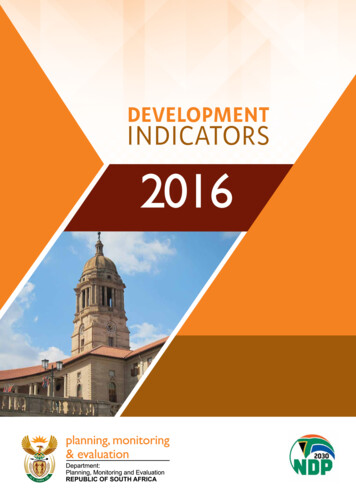
DEVELOPMENTINDICATORS2016
Mr Jeff Radebe, MPMinister in The Presidency for Planning, Monitoring and EvaluationMINISTER’S FOREWORDThe Development Indicators 2016 publication presents an update on the state of South Africa’s development in economicgrowth and transformation, employment, poverty and inequality, household and community assets, health, education, socialcohesion, safety and security, international relations, environmental sustainability and good governance.This is the eighth editionof the Development Indicators, which was first published in 2007 as a Medium Term Strategic document. The publication wassubsequently re-engineered to monitor the implementation of the National Development Plan (NDP) vision 2030.An overview of the period since the dawn of democracy is provided by 85 indicators, of which many span the period from1994 to 2016. The 2016 publication shows that South Africa has seen notable success on the expansion of the tax register andrevenue collection. Life expectancy has increased while child and infant mortality have decreased. The government continues toincrease access to lifelong Antiretroviral Treatment. The number of households that continues to live without proper sanitationfacilities has been declining consistently and more households have access to clean water and electricity. South Africa has seena notable increase in the number of children registered for early childhood development and improvement in matric passrate. The land restitution has improved at a slow pace as shown by the number of claims that has been finalised. The politicalcommitment to good governance is reflected by the positive improvements in the audit outcomes especially at the national andprovincial spheres of government.Social assistance programmes have been expanding at an unprecedented rate from covering 2.7 million people in 1994 to over16.9 million in 2015.The programme continues to contribute to the decrease in the poverty levels and vulnerability to hunger bypoor households. However, the country still remains faced with the triple challenges of poverty, inequality and unemployment asreflected by the increase in the unemployment rate, shrinking of the economy and declining perceptions among South Africansabout an expression of confidence in a happy future for all races.The Development Indicators 2016 provide numerical indications of changes in highly complex and interrelated systems. Theyshould be interpreted jointly in an integrated manner, beyond the number and within the broader, socio-economic and historicalcontext. The publication provides a comprehensive overview and analysis of South Africa’s progress towards the realisation ofthe NDP 2030 vision.The Development Indicators is a collation of data extracted from many sources, including official statistics, government databasesand research institutions. I would like to thank all institutions and agencies that provided data for their continued support.It is my wish that a broad range of institutions and individuals should engage with this publication and should be inspired towork together to achieve our long and medium-term goals as articulated in the NDP 2030 Vision. Together we move SouthAfrica forward!Mr Jeff Radebe, MPMinister in The Presidency for Planning, Monitoring and EvaluationDate: 24 July 2017
1Real GDP 2016R 3.07 trillion 419. 6 billionReal GDP per Capita 2016R 55 827 7 5042Mid-term population Estimates 2016Total55.91 millionMale27.38 millionFemale28.53 million0-14 years16 807 24115-29 years15 696 4893Households16 121 9894Household size3.55Land Surface area*1 220 813 km2MAP OF SOUTH AFRICAData source1) South African Reserve Bank (SARB).2) World Bank (World Development Indicators)3) Statistics South Africa’s (Stats SA) Mid-term population estimates 2016.4) Stats SA’s General Household Survey (GHS) 2015.5) Stats SA’s Census 2011.Data noteReal GDP and GDP per capita figures are annualised.*The shift of the national boundary over the Indian Ocean in the North East corner of KwaZulu-Natal to cater for theIsimangaliso Wetland Park led to the increase in South Africa’s land area.
TABLE OF CONTENTSMINISTER’S FOREWORDECONOMIC GROWTH AND TRANSFORMATION. 11. GROSS DOMESTIC PRODUCT (GDP) GROWTH.22. REAL PER CAPITA GDP GROWTH.33. NET FOREIGN DIRECT INVESTMENT (NET FDI).44. GROSS FIXED CAPITAL FORMATION (GFCF).55. MAIN BUDGET SURPLUS OR DEFICIT BEFORE BORROWING.66. GOVERNMENT DEBT.77. INTEREST RATES: REAL AND NOMINAL.88. INFLATION MEASURES.99. BOND POINTS SPREAD.1010. EXPENDITURE ON RESEARCH AND DEVELOPMENT (R&D).1111. INFORMATION AND COMMUNICATIONS TECHNOLOGY (ICT).1212. PATENTS.1313. BALANCE OF PAYMENTS.1414. SOUTH AFRICA’S COMPETITIVENESS OUTLOOK.1515. BLACK AND FEMALE MANAGERS.16EMPLOYMENT.1716. EMPLOYMENT.1817. UNEMPLOYMENT (broad and narrow).1918. NET WORK OPPORTUNITIES CREATED BY EXPANDED PUBLIC WORKS PROGRAMME (EPWP).2019. NET WORK OPPORTUNITIES CREATED BY COMMUNITY WORK PROGRAMME (CWP).21POVERTY AND INEQUALITY.2220. LIVING STANDARDS MEASURE (LSM).2321. INEQUALITY MEASURES.24
22. POVERTY HEADCOUNT INDEX.2523. POVERTY GAP ANALYSIS: POVERTY GAP INDEX (P1) AND SQUARED POVERTY GAP INDEX (P2).2624. SOCIAL-ASSISTANCE SUPPORT.2725. PEOPLE WITH DISABILITIES.28HOUSEHOLD AND COMMUNITY ASSETS.2926. MEETING HOUSING NEEDS.3027. POTABLE WATER.3128. SANITATION.3229. ELECTRICITY.3330. LAND RESTITUTION.3431. LAND REDISTRIBUTION.35HEALTH.3632. LIFE EXPECTANCY (LE).3733. INFANT AND UNDER-FIVE MORTALITY RATES.3834. SEVERE ACUTE MALNUTRITION UNDER FIVE YEARS.3935. IMMUNISATION COVERAGE.4036. MATERNAL MORTALITY RATIO (MMR).4137. HIV PREVALENCE.4238. ANTIRETROVIRAL TREATMENT (ART).4339. TUBERCULOSIS (TB).4440. MALARIA.45EDUCATION.4641. EARLY CHILDHOOD DEVELOPMENT (ECD).4742. CLASS RATIO IN PUBLIC ORDINARY SCHOOLS.4843. ENROLMENT RATES: GENDER PARITY INDEX (GPI).4944. NATIONAL SENIOR CERTIFICATE (NSC) EXAMINATIONS PASS RATE.50
45. NUMBER OF CANDIDATES FOR THE NATIONAL SENIOR CERTIFICATE (MATRIC)EXAMINATIONS WITH MATHEMATICS AND PHYSICAL SCIENCE PASSES.5146. ADULT LITERACY RATE.5247. GRADUATING SCIENCE, ENGINEERING AND TECHNOLOGY (SET) STUDENTS.5348. EDUCATIONAL PERFORMANCE BELOW HIGH SCHOOL.5449. MATHEMATICS AND SCIENCE ACHIEVEMENT.5550. SKILLS AND TRAINING.56SOCIAL COHESION.5751. STRENGTH OF CIVIL SOCIETY.5852. VOTER PARTICIPATION.5953. VOTERS PER PROVINCE.6054. PERCENTAGE OF WOMEN WHO ARE MEMBERS OF LEGISLATIVE BODIES.6155. CONFIDENCE IN A HAPPY FUTURE FOR ALL RACES.6256. PUBLIC OPINION ON RACE RELATIONS.6357. COUNTRY GOING IN THE RIGHT DIRECTION.6458. IDENTITY BASED ON SELF-DESCRIPTION.6559. PRIDE IN BEING SOUTH AFRICAN.66SAFETY AND SECURITY.6760. VICTIMS OF CRIME.6861. SERIOUS CRIMES.6962. PROPERTY CRIME.7063. CONTACT CRIME.7164. AGGRAVATED ROBBERIES.7265. DRUG-RELATED CRIME.7366. SEXUAL OFFENCES.7467. CONVICTION RATE.7568. TOTAL NUMBER OF INMATES.76
69. REHABILITATION OF OFFENDERS.7770. PAROLE AND PROBATION.7871. ROAD ACCIDENTS.79INTERNATIONAL RELATIONS.8072. SUSTAINABLE DEVELOPMENT.8173. SUSTAINABLE TOURISM.8274. MISSION OPERATIONS.8375. AGREEMENTS.84GOOD GOVERNANCE.8576. REVENUE COLLECTION.8677. AUDITS.8778. CORRUPTION PERCEPTIONS.8879. BUDGET TRANSPARENCY.8980. PUBLIC OPINION ON DELIVERYOF BASIC SERVICES.9081. EASE OF DOING BUSINESS.91ENVIRONMENTAL SUSTAINABILITY.9282. GREENHOUSE GAS (GHG) EMISSIONS.9383. AMBIENT AIR QUALITY.9484. TERRESTRIAL BIODIVERSITY PROTECTED INDEX.9585. MARINE PROTECTED AREAS (MPA).96LIST OF ABBREVIATIONS AND ACRONYMS.97ACKNOWLEDGEMENT.100Outcomes monitoring and evaluation team.101POA data support team.102
ECONOMIC GROWTH ANDTRANSFORMATION
ECONOMIC GROWTH ANDTRANSFORMATION1.GROSS DOMESTIC PRODUCT (GDP) GROWTHGoalGDP growth of 5 percent per yearAnalysisFollowing the financial crisis in 2008, growth declined from 3.0% in 2010 to 0.3% in 2016. The low growth raterecorded is mainly attributed to the following factors: weak global economic performance, a lack of economicdiversification, falling domestic investment, persistent drought and low business confidence caused by policyuncertainty. Due to these factors, some sectors of the economy have performed negatively in terms of GDPcontributions, such as, agricultural, manufacturing, mining, electricity and trade industries. The services sector hasbeen the key driver of the economic growth.REAL GDP GROWTH%GDP .30.3GDP (YEAR ON YEAR)DefinitionGDP is the market value of all final goods and services produced within a country in a given period of time.Real GDP is the nominal GDP adjusted for inflation.Data sourceSARB quarterly bulletins.Data noteAnnual percentage growth rates based on constant 2010 rand prices. Additional annual data is available on Excelversion on the Department of Planning, Monitoring and Evaluation (DPME) website: www.dpme.gov.zaDEVELOPMENT INDICATORS2
ECONOMIC GROWTH ANDTRANSFORMATION2.REAL PER CAPITA GDP GROWTHGoalTo grow per capita income by 3 percent or more annuallyAnalysisIn South Africa, GDP per person climbed 1.7% a year from 2003 to 2014, but declined annually from 2014 to 2016with a decline of -1.1% in 2016.REAL PER CAPITA GDP GROWTH%Per Capita GDP -1.1REAL PER CAPITA GDP GROWTHDefinitionGDP divided by population.Data sourceSARB quarterly bulletinsData noteAnnual GDP per capita at 2010 constant prices: percentage change. Additional data is available on Excel version onthe DPME website: www.dpme.gov.za3DEVELOPMENT INDICATORS
ECONOMIC GROWTH ANDTRANSFORMATION3.NET FOREIGN DIRECT INVESTMENT (NET FDI)GoalTo increase Foreign Direct Investment in South AfricaAnalysisSince the global financial crisis, South Africa has not been able to attract significant foreign direct investment.Investors have been pessimistic about South Africa’s economic outlook and concerned by policy and politicaluncertainty. Risk perceptions and structural barriers to investment persist despite measures to reduce uncertaintyand improve the investment climate. South Africa’s savings and investment levels needs to improve if the country isto experience desired rates of GDP growth.NET .90201315.942014-20.612015-51.222016-16.35NET FDIDefinitionNet Foreign Direct Investment is long-term direct investment by foreigners in the economy.Data sourceSARB quarterly bulletins, data provided by National Treasury.Data noteAnnual figures in Rand billion are used. Additional data is available on Excel version on the DPME website: www.dpme.gov.zaDEVELOPMENT INDICATORS4
ECONOMIC GROWTH ANDTRANSFORMATION4. GROSS FIXED CAPITAL FORMATION (GFCF)GoalThe rate of investment to GDP to rise to 30 percent by 2030AnalysisGross fixed capital formation (GFCF) has averaged approximately 19.2% of GDP for the period 2002-2016. Thedecline in investment post 2008, could be partly attributed to dismal global financial recovery. Fixed investment bygeneral government has remained marginal. Robust investment by SOCs on infrastructure especially in utilities andtransportation sectors helped cushion the weaker performance of the private and government sectors. In 2016,a decline in capital spending by the private sector could be attributed to low business confidence. Overall, totalinvestment as a percentage of GDP has increased marginally since 2011 but continues to show a decline.GFCF AS A PERCENTAGE OF 20.6201520.4201619.6GFCF AS A PERCENTAGE OF GDPDefinitionGross fixed capital formation is total fixed investment by private companies and individuals, SOCs and government,including depreciation.Data sourceSARB quarterly bulletins.Data noteAnnual data series (annualised rate as a percentage of GDP) is used to update the graph, while the table presentsannual data.Additional data is available on Excel version on the DPME website: www.dpme.gov.za5DEVELOPMENT INDICATORS
ECONOMIC GROWTH ANDTRANSFORMATION5.MAIN BUDGET SURPLUS OR DEFICIT BEFORE BORROWINGGoalFiscal policy adjustments to reduce the budget deficitAnalysisThe budget deficit has averaged about 2.5% for the period 2002-2015. During the period between 2006/07 2007/08, South Africa experienced a budget surplus. This was due to high economic growth rates and improvedtax-collection efficiency. However, slow economic recovery since the end of the financial crisis in 2009 has resultedin lower levels of revenue collection. The implementation of expenditure ceilings and other fiscal consolidationmeasures to stabilize the deficit has been introduced to avoid debt spiral.BUDGET SURPLUS OR DEFICIT BEFORE BORROWING AS PERCENTAGE OF GDP%Budget ET SURPLUS OR DEFICIT BEFORE BORROWING AS PERCENTAGE OF GDPDefinitionBudget surplus or deficit before borrowing (the difference between total government revenue and expenditure)as percentage of GDP.Data sourceNational Treasury, Budget Review 2016.DEVELOPMENT INDICATORS6
ECONOMIC GROWTH ANDTRANSFORMATION6.GOVERNMENT DEBTGoalConsolidation to stabilise and reduce government’s debt-to-GDP ratioAnalysisGovernment debt as a percentage of GDP has been declining from 1995/96 to 2008/09. The debt level as apercentage of GDP was reduced to approximately 21% in 2008. However, following the global economic andfinancial crisis of 2008, debt levels increased as significant fiscal deficits were recorded. Domestic low levels ofgrowth have placed public finances under massive pressure, with net government debt increasing significantly to44.3% of GDP in 2015/16 from 21.8% of GDP at the end of 2008.GOVERNMENT DEBT AS PERCENTAGE OF GDP%Government 22.321.826.429.032.235.638.141.044.2GOVERNMENT DEBT AS PERCENTAGE OF GDPDefinitionNet loan debt is gross loan debt minus National Revenue Fund (NRF) bank balances. It is calculated with dueaccount of the bank balances of the NRF (balances of government’s accounts with the SARB and the tax and loansaccounts with commercial banks). Forward estimates of foreign debt are based on National Treasury’s exchangerate projections, which are based on fiscal years starting from 1 April every year.Data sourceSARB data provided by National Treasury.Additional data is available on Excel version on the DPME website: www.dpme.gov.za7DEVELOPMENT INDICATORS
ECONOMIC GROWTH ANDTRANSFORMATION7.INTEREST RATES: REAL AND NOMINALGoalLow real interest rate that promotes the sustainability of growth and employment creationAnalysisBoth nominal and real interest rates have been at historic low levels due to the South Africa’s adoption of theInflation targeting tool, which has led to a low in
The Development Indicators 2016 publication presents an update on the state of South Africa’s development in economic growth and transformation, employment, poverty and inequality, household and community assets, health, education, social cohesion, safety and security, international rel