Transcription
The 2020 Top 150Silicon ValleyCompaniesIn partnership with2
Table of ContentsZoom, Slack MuscleOnto Top Silicon Valley List . 1The Top 150 Companies in Silicon Valley . 6
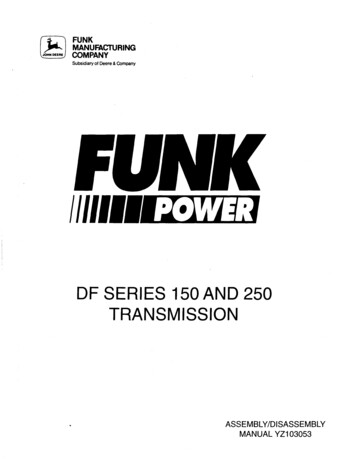
Zoom, Slack Muscle Onto Top SiliconValley ListBy Preston Brewer, June 2, 2020Many Silicon Valley companies are thriving amid the pandemic. The newly released Fenwick – Bloomberg Law SV 150 List,ranking the 150 largest public technology and life sciences companies in Silicon Valley by revenue, provides strong evidencethat the Valley remains a cradle of innovation. With 17 additions to the list this year, we look at four of these new entries.Zooming to the SV 150; No Slackers HereThe most obvious candidate for the darling of this lockdown downturn is cloud-based video conferencing providerZoom Video Communications (SV 150 #91). Designed for business users, seemingly one and all have embraced theplatform during the pandemic disruption as an essential communications tool for work and personal use. “Zoom” hasquickly become not only a household name but also a verb.Heady stuff for a company founded less than a decade ago and only public since April of last year. Those 36 IPO shares havetraded as high as 181.50 share, a whopping five-fold increase. Zoom’s market cap exceeded 50 billion for the first time whenit soared late in the trading day May 29, finishing at 179.48 after rising nearly 10% on the day. That’s a market cap that exceedssuch brand names as earth-moving equipment maker Deere & Co. and large biopharmaceutical manufacturer Biogen Inc.Zoom was the third best performing (up 20.8%) company among the 500 largest U.S. stocks by market cap between Feb.21 and April 6 of this year, lagging only the more established Citrix Systems (up 26.8%), which operates in the same space asZoom, and Rengeron Pharmaceuticals (up 25.1%), currently fast-tracking the development of two Covid-19 antibody cocktails.Cloudflare’s Stock Price Lights UpThe CEO of cloud-network platform Cloudflare Inc. (SV 150 #128), Matthew Prince, recently became a billionaire onpaper as his company’s stock climbed over 76% this year (as of June 1). Cloudflare is benefiting from the increasedneed for effective web security, video streaming, and traffic management as people working and playing at homeduring the pandemic have substantially raised demand for streaming, e-commerce, and online gaming. Thecompany’s 15 IPO price has doubled since its September 2019 debut, hitting a record high on June 1. The companycurrently has a market cap of about 8.8 billion, double its 4.4 billion valuation based on its IPO offer price.Slack Pulls Its Weight and Millions of New UsersWorkplace communications platform Slack (SV 150 #90) is also enjoying a bump both in usage and in stock price afterhitting a 52-week low of 15.10 on March 16, nearly 11 below the stock’s 2019 26 direct listing offer price. Prices havesince rebounded to about 37 on June 1, although that is still down from its 42 52-week high on June 20, 2019.Propelling that price recovery are likely some of the remarkable operating results reported by the company. Accordingto a March 26 Slack press release, Covid-19 was driving a substantial increase in many of its business metrics.Simultaneously connected users increased by 25%, or 2.5 million users, in just two weeks (March 10 to March 25),newly created Slack workspaces increased “by hundreds of percent“ (March 12 to March 25), and the number of Slack’spaid customers increased more from Feb. 1 to March 25 than in the full prior two preceding quarters. Slack advised that onworkdays, the global total number of users’ active minutes on the platform now exceeds 1 billion.Coherus Misses Covid-19’s Bump for Certain PharmaThe pandemic has attracted many investors to companies developing a Covid-19 vaccine candidate, most notably toshares of Moderna, Regeneron, and Gilead. Of those three, only Gilead (SV 150 #12) is located in Silicon Valley, and1
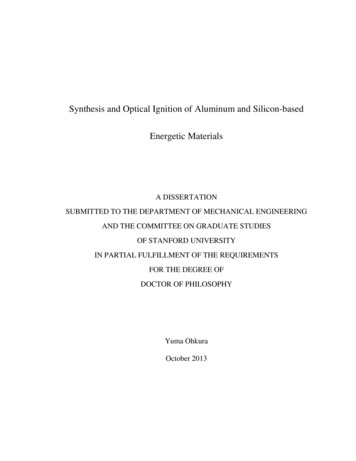
none of the biotech and pharmaceutical companies whose shares have surged because of the pandemic are new tothe SV 150. However, these spikes in share prices are tending to be short-lived, having been created by a new type ofhealth-care stock investor dubbed the “biotech tourist.”SPDR S&P Biotech Equity (XBI)From March 2 to June 1, 2020Last Price 110100908070Mar 22020Mar 15Apr 1Apr 15May 1May 15Jun 1Source: Bloomberg Law as of June 1, 2020.Biopharmaceutical company and SV 150 newcomer Coherus Biosciences Inc. (SV 150 #118) is not one of those companiesseeing a Covid-19 boost to its shares as its focus is on the global biosimilars market, including its commercially well-receivedbone marrow stimulant. The firm has experienced a decidedly mixed stock performance in the past year and a half.The downturn may create attractive M&A opportunities for Coherus to burnish its already strong drug pipeline with astrategic acquisition at a discounted price. (To learn more about recent M&A activity in Silicon Valley, read ANALYSIS:HP Absent from Silicon Valley M&A Scene.)Cloud Businesses to Keep Floating Above the TimesThe shift to working from home has been a more or less successful experiment forced on employees and businessesalike. As is often the case with economic shocks, the pandemic has accelerated already existing business trends, suchas the decline in retail and the dominance of technology.The Silicon Valley companies that appear best positioned to take advantage of the pandemic to fuel future growth arebig tech firms, such as Google and Apple, that provide communication lifelines and are developing nongovernmentalCovid-19 tracing apps; and firms with cloud-based business models, especially those that provide effective securitysolutions. Strong growth by companies in those strategic areas may shake up the SV 150 list in the years to come.2
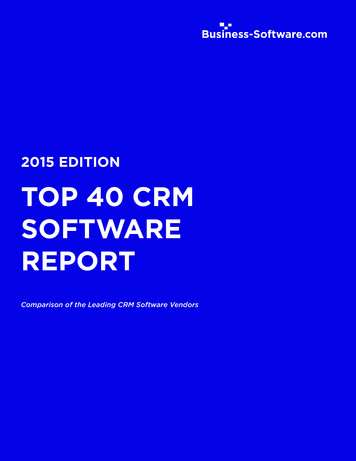
Top Ten Largest Companies on Fenwick – Bloomberg Law SV 150Rank unchangedRank increased from 2019Rank decreased from 20193
4
Four Companies New to the SV 150 List5
The Top 150 Companies in Silicon ValleyThe Fenwick – Bloomberg Law SV 150 List ranks the 150 largest public technology and life sciences companies in SiliconValley by revenue. We calculated company revenue and market cap for the most recent available four quarters ending onor near December 31, 2019.Figures in US millions2020 (RankCompany)2019 TotalRevenue New to the listRevenue2019 Market CapMarket Cap1Apple Inc. 267,6832.3% 1,287,65873.7%2Alphabet Inc. 161,85718.3% 933,26928.8%3Intel Corp. 71,9651.6% 261,34822.5%41Facebook Inc. 70,69726.6% 593,44854.8%51HP Inc. 58,664-0.0% 29,834-5.6%6Cisco Systems Inc. 51,5501.4% 202,6535.4%7Oracle Corp. 39,582-0.3% 171,4816.6%8Hewlett Packard Enterprise Co. 28,531-7.2% 20,55812.8%91Tesla Inc. 24,57814.5% 77,57435.3%102SYNNEX Corp. 23,75718.8% 6,58860.9%Broadcom Inc. 22,6666.4% 125,91321.9%11123Gilead Sciences Inc. 22,4491.5% 83,4364.2%132Netflix Inc. 20,15627.6% 144,22429.1%142PayPal Holdings Inc. 17,77215.0% 128,45731.0%152salesforce.com Inc. 17,09828.7% 146,33742.0%163Western Digital Corp. 15,582-19.6% 18,47873.8%173Applied Materials Inc. 15,017-10.6% 55,98980.4%Uber Technologies Inc. 14,147— 51,464N/A18192Adobe Inc. 11,17123.7% 160,12847.0%202NVIDIA Corp. 10,918-6.8% 144,96477.8%211eBay Inc. 10,8000.5% 29,3447.9%223Lam Research Corp. 9,549-12.2% 42,610102.8%231Sanmina Corp. 7,8864.4% 2,39247.2%Intuit Inc. 7,12710.8% 69,51736.8%24252Advanced Micro Devices Inc. 6,7314.0% 51,427188.8%261NetApp Inc. 5,603-9.6% 14,020-5.8%Note: Revenue data are based on Bloomberg quarterly data, adjusted by Fenwick to reflect a calendar-year revenue for each company for comparisonpurposes. In addition, Bloomberg has calculated adjusted revenue for LendingClub ( 1,150M), reflecting that the net revenue required for GAAP reporting byfinancial institutions differs from revenue reported by operating companies more generally. These updated or adjusted revenues were not used for purposesof determining the Fenwick – Bloomberg Law SV 150 List, though Bloomberg generally provides them when reporting 2019 revenues for those companies.6
Figures in US millions2020 (RankCompany)272019 TotalRevenue New to the listRevenue2019 Market CapMarket CapEquinix Inc. 5,5629.7% 49,67575.1%282Electronic Arts Inc. 5,3881.8% 31,65932.1%292KLA Corp. 5,27922.6% 28,169107.6%302Agilent Technologies Inc. 5,2365.0% 26,49626.1%312Square Inc. 4,71442.9% 27,41418.7%Intuitive Surgical Inc. 4,60423.6% 69,09928.4%32333Juniper Networks Inc. 4,445-4.3% 8,170-11.5%346Workday Inc. 3,62728.5% 38,1469.7%Lyft Inc. 3,616 13,646—35—365ServiceNow Inc. 3,46032.6% 54,10667.3%371Twitter Inc. 3,45913.7% 25,27016.8%384Synopsys Inc. 3,3756.4% 21,16869.3%392Varian Medical Systems Inc. 3,31311.1% 12,93126.7%Super Micro Computer Inc. 3,268— 1,20778.3%40416Trimble Inc. 3,2645.0% 10,45630.3%424Xilinx Inc. 3,23511.4% 24,74916.0%431Palo Alto Networks Inc. 3,12120.4% 22,85130.8%445Avaya Holdings Corp. 2,8641.0% 1,485-6.6%451Arista Networks Inc. 2,41112.1% 15,6180.6%462Align Technology Inc. 2,40722.4% 21,88231.3%474Splunk Inc. 2,35930.8% 23,63155.6%481Cadence Design Systems Inc. 2,3369.3% 19,72361.3%494Bio-Rad Laboratories Inc. 2,3121.0% 11,02760.6%506Cypress Semiconductor Corp. 2,205-11.2% 8,68389.6%518Maxim Integrated Products Inc. 2,183-12.6% 16,65319.9%Fortinet Inc. 2,15619.7% 18,37853.4%52536Lumentum Holdings Inc. 1,74531.4% 6,10097.4%543Stitch Fix Inc. 1,73826.7% 2,58649.9%551Dropbox Inc. 1,66119.4% 7,360-12.9%562Pure Storage Inc. 1,64320.9% 4,47830.8%573Fitbit Inc. 1,435-5.1% 1,69935.9%588Coherent Inc. 1,368-24.3% 4,00460.2%596Synaptics Inc. 1,357-16.5% 2,23874.1%6014Zynga Inc. 1,32245.7% 5,91276.3%7
Figures in US millions2020 (RankCompany)6110621632019 TotalRevenue New to the listRevenue2019 Market CapMarket CapInfinera Corp. 1,29937.7% 1,407105.1%Nutanix Inc. 1,2490.6% 6,102-15.4%Dolby Laboratories Inc. 1,2313.8% 6,87010.8%642Fair Isaac Corp. 1,19612.9% 10,971105.7%651GoPro Inc. 1,1954.0% 6693.5%662Viavi Solutions Inc. 1,16810.4% 3,47452.4%Pinterest Inc. 1,143 10,322—67—6821Twilio Inc. 1,13474.5% 13,77460.1%6912Roku Inc. 1,12952.0% 16,475400.4%705Veeva Systems Inc. 1,10428.1% 20,89964.3%7116SMART Global Holdings Inc. 1,090-23.1% 90834.5%727Ultra Clean Holdings Inc. 1,066-2.8% 931190.8%734Extreme Networks Inc. 1,026-0.6% 89631.0%742Yelp Inc. 1,0147.6% 2,447-14.4%758NETGEAR Inc. 999-5.7% 739-55.0%769DocuSign Inc. 97438.9% 13,35099.5%771Exelixis Inc. 96813.3% 5,509-5.2%7810RingCentral Inc. 90334.0% 14,522127.6%Omnicell Inc. 89713.9% 3,45944.3%79803FireEye Inc. 8897.0% 3,61314.0%813Proofpoint Inc. 88823.9% 6,45438.7%822Sunrun Inc. 85913.0% 1,67241.0%838Zendesk Inc. 81636.4% 8,69741.9%8411Cloudera Inc. 79465.5% 3,380102.3%853Bloom Energy Corp. 7855.8% 752-36.6%861LendingClub Corp. 7599.2% 1,104-1.9%874Guidewire Software Inc. 701-5.0% 9,00139.9%882Box Inc. 69614.4% 2,5475.0%893TiVo Corp. 668-4.0% 1,069-8.3%90Slack Technologies Inc. 630— 12,108—91Zoom Video Communications Inc. 623— 18,419—Ichor Holdings, Ltd. 621-24.6% 761109.0%FormFactor, Inc. 58911.3% 1,97189.9%Okta, Inc. 58646.8% 14,535113.6%92149394138
Figures in US millionsCompany2019 TotalRevenue New to the list2019 Market CapMarket Cap28.4% 3,922-14.2% 54723.0% 5,72933.2%eHealth, Inc. 506101.4% 2,181206.3%6Natus Medical Inc. 495-6.7% 1,128-1.4%1QuinStreet, Inc. 4838.2% 7931.2%100CrowdStrike Holdings Inc. 481—101Alpha and OmegaSemiconductor Limited 4573.1% 33534.3%2020 (Rank)954New Relic, Inc. 572964Penumbra, Inc.97299899Revenue 10,055—1028Quotient Technology Inc. 43612.7% 870-14.9%1031Calix, Inc. 424-3.8% 446-9.7%1041Power Integrations, Inc. 4211.1% 2,91264.3%10578x8, Inc. 41923.8% 1,8125.7%Quantum Corp. 418 272283.9%106—1074Glu Mobile Inc. 41112.2% 872-23.6%1087Chegg, Inc. 41128.0% 4,62643.8%1095Accuray Incorporated 409-0.6% 251-16.0%1104Harmonic Inc. 403-0.2% 69070.8%1112Nevro Corp. 3900.8% 3,600212.4%1129Coupa Software Inc. 39049.7% 9,628160.1%11319Elastic N.V. 38565.3% 5,2485.6%11417Arlo Technologies, Inc. 370-20.4% 322-59.4%1152Inphi Corp. 36624.2% 3,441142.9%11613Zscaler, Inc. 36048.2% 6,09225.2%1173NeoPhotonics Corp. 35710.6% 42042.3%Coherus Biosciences Inc. 356 1,277110.2%118—11911Anaplan, Inc. 34844.6% 7,032107.1%1204Forescout Technologies, Inc. 33713.1% 1,55437.0%1212Five9 Inc. 32827.3% 4,06760.1%1224Eventbrite Inc. 32712.1% 1,747-21.4%1234Qualys Inc. 32215.3% 3,28111.0%SVMK Inc. 30720.9% 2,41071.7%1241252Corcept Therapeutics Inc. 30622.0% 1,405-6.6%1264Natera Inc. 30217.3% 2,609223.6%1272Upwork Inc. 30219.3% 1,167-38.5%9
Figures in US millions2020 (RankCompany)1282019 TotalRevenue New to the listRevenue2019 Market Cap 5,010Market CapCloudflare Inc. 287——Xperi Corp. 280-31.0% 9110.5%Zuora Inc. 27617.4% 1,609-16.0%12924130113111Innoviva Inc. 2610.0% 1,443-16.4%1325FibroGen Inc. 25720.5% 3,9172.8%13312Telenav Inc. 25078.7% 23232.2%10X Genomics Inc. 246 7,516—134—1357Aviat Networks Inc. 233-6.9% 7713.2%1361Ambarella Inc. 2290.4% 2,01078.2%1373Rambus Inc. 224-3.1% 1,53583.5%138Invitae Corp. 217— 1,561105.5%139Guardant Health Inc. 214— 7,401128.9%140iRhythm Technologies Inc. 214— 1,7595.6%1418A10 Networks Inc. 213-8.4% 52717.8%1424MobileIron Inc. 2056.2% 53811.7%1433Aemetis Inc. 20217.8% 1963.9%Fastly Inc. 200144— 1,926—1454Cutera Inc. 18211.7% 516122.4%1467Vocera Communications Inc. 1810.5% 659-44.5%147Livongo Health Inc. 170— 2,290148Amyris Inc. 153— 34535.9%—1492Ooma Inc. 15217.3% 2894.3%1506Model N Inc. 145-4.0% 1,171178.0%10
To learn more, visit pro.bloomberglaw.com.24/7 Help Desk and Live Chat omberglaw.com 2020 The Bureau of National Affairs, Inc. 0620 MKT 24629Bloomberg Law is a trademark and service mark of Bloomberg Finance L.P.(a Delaware limited partnership), or its subsidiaries.1
100 90 80 70 Jun 1 Biopharmaceutical company and SV 150 newcomer Coherus Biosciences Inc. (SV 150 #118) is not one of those companies seeing a Covid-19 boost to its shares as its focus is on the global biosimilars market, including its commercially well-received bone marrow stimulant. The fir