Transcription
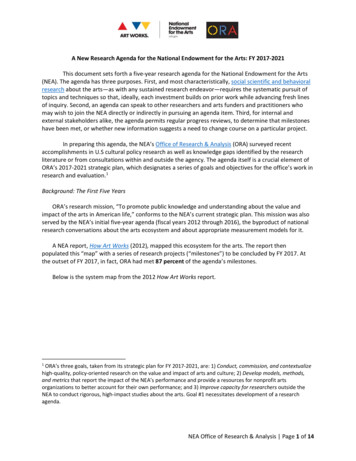
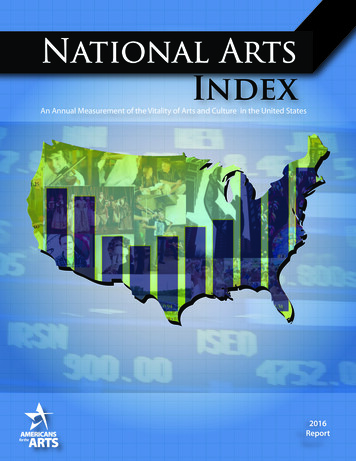
National ArtsIndexAn Annual Measurement of the Vitality of Arts and Culture in the United 0620072016Report
NATIONAL ARTS INDEX 2016:AN ANNUAL MEASURE OF THEVITALITY OF ARTS AND CULTURE IN THEUNITED STATES: 2002-2013ROLAND J. KUSHNER,MUHLENBERG COLLEGERANDY COHEN,AMERICANS FOR THE ARTSCOPYRIGHT 2016 BY AMERICANS FOR THE ARTS. ALL RIGHTS RESERVED
INTRODUCTIONThis is the sixth and final publication of the National Arts Index, Americans for the Arts’ annual report on thehealth and vitality of arts and culture in the United States. The 2016 National Arts Index is a highly-distilledmeasure of the health and vitality of arts in the U.S. It is composed of 81 equally-weighted, national-levelindicators of arts and culture activity during the 12-year span of 2002 to 2013. The 2013 National Arts Indexscore is 99.8 compared to a baseline of 2003 100. This is an increase over the 2011 and 2012 scores.Indicators are ubiquitous in our society, providing regular updates on areas of broad interest like the stockmarket or the overall economy—well-known measures that provide a common language and understanding. Forexample, if someone says that the “Dow” is going up or down or that Gross Domestic Product (GDP) is rising orfalling, we understand these to be broad measures of stock market performance or overall economic strength.Indicators typically compress large amounts of data into a single number. They are calculated the same way(e.g., daily for the Dow, or quarterly for GDP), making it easy to compare past and present—and anticipate thefuture.Benefits of IndicatorsCommunications: Indicators represent a language that is well understood and respected by community leaders.They transform complex information into communication tools that can be readily understood by policy makersand the public.Evaluation: Indicators enable decision makers to assess progress toward explicitly stated values and goals.Longitudinal data is a marker for results-based accountability, performance standards, and other statisticaltracking endeavors.Policy Development: Reliable trend data play an important role in informing policy makers about communityneeds and contributing to improved programs.A Foundation for Decision Making: A solid foundation of awareness about trends can give decision makers theconfidence to take next steps and set goals. Indicators can provide early warnings—scanning the environmentfor emerging opportunities and crises (e.g., budget deficits vs. surpluses).Community Dialogue: Some people simply like to be informed about the state of their community and how andwhy it’s changing. Indicators provide a common currency of language among funders, policy makers, andindustry professionals. They improve the quality of the public dialogue about the arts and culture by providingunderstandable quantitative components to what is often a visceral discussion.Planning and Forecasting: Access to consecutive years of data about one or more specific areas make it easier toforecast the future path of activity in that area.Building Partnerships: Developing indicators collaboratively can provide arts leaders with a betterunderstanding of the values that drive the community—and how to incorporate the arts into that value system.Indicators help non-arts leaders better understand the value of the arts as a core element of their communitywhich in turn can lead them to become more effective advocates for public support and better partners.National Arts Index 2016i
Why an “Arts Index?”From our vantage point back in 2005, we saw many individual studies of artists, markets, nonprofit vs. for-profitarts businesses, and audiences, but few of them focused on the whole arts system—and even those wereintermittent. The National Arts Index has been a 10-year initiative to fill this gap. It is broad, systemic, andannual. The first Index report was published in 2010 as the U.S. was emerging from the Great Recession, andthere was little understanding of its impact on the arts. This 2016 report documents how the nation’s arts sectorfared pre-, during, and post-Recession.The significance of arts and culture to American life makes the vitality of the arts a matter of pressing interest,and good information about the condition of the arts is a critical element of that interest. The arts are afundamental component of a healthy society, based on virtues that touch the individual, community, and thenation—benefits that persist even in difficult social and economic times: Aesthetics: The arts create beauty and preserve it as part of cultureCreativity: The arts encourage creativity, a critical skill in a dynamic worldExpression: Artistic work lets us communicate our interests and visionsIdentity: Arts goods, services, and experiences help define our cultureInnovation: The arts are sources of new ideas, futures, concepts, and connectionsPreservation: Arts and culture keep our collective memories intactProsperity: The arts create millions of jobs and enhance economic healthSkills: Arts aptitudes and techniques are needed in all sectors of society and workSocial Capital: We enjoy the arts together, across races, generations, and placesIt is the health of the arts industries—and their ability to sustain themselves over time and deliver thesevaluable benefits—that we refer to as the “vitality” of arts and culture. This is what the National Arts Indextracks over time.While the National Arts Index annual score is a single number (99.8 for 2013), the full report contains extensivedetail on the many forms of arts and culture activity measured by the 81 indicators. The Table of Contents givesa quick view of all indicators. The data for these come from the most reliable sources in the federal governmentand private-sector organizations. Past indicator values are monitored and updated, as these sources oftenrevise their past data. Revisions, availability of new data, and expiry of other series all make the Indexsomewhat dynamic. As evidence of this, 2013 data for five indicators could not be obtained in time for thisreport, recent years have seen as many as 1-in-5 indicators undergo multi-year data revisions by their producers,and seven indicators used in our early reports became unavailable in 2011 (these can be viewed in the Appendixof this report).We set all the data in the context of our ever-changing environmental setting of population, economy, prices,and employment. This helps distinguish changes in the arts from trends affecting all sectors. For example, ifattendance at a particular art form increases ½ percent per year—while total population grows 0.78 percent—then that art form is effectively losing market share, not gaining.iiNational Arts Index 2016
All of the indicators in this report are organized into The Arts and Culture Balanced Scorecard, a logic model ofthe ecology of the arts that links the indicators into a unified system and provides a holistic overview. Four keydimensions comprise the model:1.2.3.4.Financial Flows—philanthropy, artist income, business revenue, payments for artistic servicesCapacity—artists, organizations, employmentArts Participation—consumption of arts activities, attendance, experiencesCompetitiveness—the position of the arts compared to other sectors—market share, how the artscompete for philanthropy, discretionary spendingIn 2013, the sector included 2.21 million artists in the U.S. workforce, 766,000 self-employed artists, 95,000nonprofit arts organizations and 656,000 additional arts businesses, as well as hundreds of millions ofconsumers who spent 151 billion on the arts. This report goes beyond individual stories about stabilization andsustainability in the arts, declining demand and the shuttering of arts organizations, or the challenges andtriumphs of specific art forms. The Index presents these stories as part of a broad evidence-based platformabout the arts at a national level. What this context shows is that, along with the rest of the economy, the artshave recovered slowly and unevenly. While the nation’s economy began to rebound in 2009, the arts recoverydid not begin until 2012.This is only the national story. Every community has its own local story. The Americans for the Arts Local ArtsIndex provide a similar set of measures (though over a shorter time span) for all U.S. counties. You can find itfreely available at www.ArtsIndexUSA.org.Ten Years of the National Arts Index: A Look Back, A Look AheadWe have all long been in the hunt for more data, better data, data that demonstrates value and impact, anddata that helps us track and make sense of trends. In 1967, three years before he wrote Future Shock, futuristAlvin Toffler penned an entire paper on the issue, The Art of Measuring the Arts, which calls for better arts data:“A cultural data system is needed to provide information for rational policy-making in thecultural field and to assist those outside the field in understanding their impact on it.”It was in the early 2000s that the Americans for the Arts Board of Directors asked its staff to develop theNational Arts Index as part of its strategic plan for the organization—something akin to a “Dow-Jones IndustrialAverage for the arts” or a “Framingham Heart Study for the arts.” While there was an abundance of excellentarts research, the leadership sought a more encompassing tool reflective of the entire arts system, one thatwould be delivered in jargon-free language that arts and non-arts leaders alike could use to communicate aboutthe value, health, and impact of the arts. It was envisioned as an annual tool that would be fodder for publicpolicy and built largely on extant data produced by reliable sources such as the federal government. Thus, theidea was born. The work began in 2005. The Rockefeller Foundation and David & Lucile Packard Foundationprovided early seed money; we studied national indicators from other sectors to learn from them; consultedscores of scholars, policy makers, and practitioners (who we thank in the Appendix of this report); and set aboutcreating an index. Our first mistake was figuring it would take two years; it ultimately was closer to five years.The first report was released at the National Press Club in early 2010, and a new report has been publishedannually. As the largest aggregation of arts data, the National Arts Index was an early entrant in world of “BigNational Arts Index 2016iii
Data.” In hopes of inspiring additional research, all Index data was made freely available to the public(www.ArtsIndexUSA.org). Out of the National Arts Index emerged its local complement, the Local Arts Index,thanks to the generous support of The Kresge Foundation. The Local Arts Index is a county-level arts data systembuilt to promote more local usage of data in policy making, provide a framework for relating arts and culture tocommunity priorities and aspirations, and to provide that “common currency of language” that so manycommunity leaders and decision makers need to better understand the arts. The National Arts Index also servedas the blueprint for arts indexes in the UK and Netherlands among other efforts, as well as a data archive usedby scholars, policy professionals, and advocates alike.This report concludes the 10-year National Arts Index initiative. We thought this an opportune time to call outseveral trends that bear watching, tips for the next researchers who pick up the challenge of tracking the artsin the U.S., and points of interest that we have highlighted in past volumes.1. The arts track the economy, with a slight lag. This one will seem obvious to most; we always hear ofarts struggles during a recession. Now we can have the conversation anew with the data in hand. Astudy of the Index data going back to 1999, spanning two recessions, confirms that our empiricalobservations are on target. When the economy dips, so does the Index score. While some indicatorsmay be up during a recession, we see a majority of them in decline. The arts overall, however, are a littleslower to fully bounce back than the economy at large. That is, they lag the nation’s recovery. While wehesitated to make predictions or forecasts using National Arts Index data, we did estimate that it wouldtake the arts until 2012 to show a turnaround. (We were correct, and we’re retiring from futureprojections while we’re 1-for-1.)2. Audiences are changing how they choose to engage in the arts. How the public participates in andconsumes the arts is ever-expanding—increasing demand to consume the arts using technology,continued growth in college arts degrees conferred annually, and a public seeking more activeengagement in their arts choices. The data indicate that people are not walking away from the arts, butthey are walking away from some of the traditional delivery mechanisms—downloading music insteadof buying a CD from a retail store, or watching an opera simulcast at the cinema instead of live in theopera house. One of our great data discoveries was Scarborough Research, which conducts large-scalemarket research studies involving more than 200,000 interviews annually on a wide range of consumerbehaviors, including participation in arts activities. In 2013, 31 percent of the adult population attended a live performing arts event—a long andsteady drop from 40 percent in 2003. Art museum attendance also continues a slow decline, with 12.9 percent of the populationattending at least once in 2013, which is down from 15.5 percent in 2003. Almost certainly related is the decreasing share of households making contributions to thearts—a figure that dropped annually between 2007 and 2012, from 9.3 percent to 8.2 percent,before showing a fractional uptick to 8.3 percent in 2013.3. Technology is changing audience engagement and the arts delivery models. The effects of technologyhave been undeniably swift, but it depends where one sits on the “arts production-to-consumption foodchain” as to who the winners and losers are. Since 2003, half of the nation’s CD and record stores have disappeared. The public, however,has hardly stopped listening to music. Digital downloads of singles grew from 139 million unitsivNational Arts Index 2016
to 1.33 billion between 2004 and 2013. Annual data about downloads was not even collecteduntil 2004, yet in 2013 it accounted for 37 percent of total music industry sales, while streamingproviders like Pandora and Spotify represent an additional 27 percent of recording industryrevenues. Thus, nearly two-thirds of industry revenues are now digitally generated. Similarly, bookseller revenues fell even while the number of books in print grew, thanks to moreself-publishing, print on demand, eBooks, and downward pressure on prices. Yet, prominentretailers such as Amazon are now opening book and music store establishments—actual bricksand mortar. Has a new cyclical system of commerce been established that takes us from thestore to online and back to the store again? Savvy nonprofit arts organizations are using technology to broaden their audience base andenrich the audience experience, like the successful Metropolitan Opera simulcasts (2,000theaters in 66 countries and 3 million tickets sold annually). As ever, technology can be a two-edged factor; it has fundamentally altered the business modelfor artists. More musicians now deal directly with consumers on line, selling songs to fans,crowdfunding their recordings, and letting fans help build their touring schedules—trends thattend to bypass traditional record labels, ticketing, and promoting businesses.4. Arts nonprofits continued to experience financial challenges: The percentage of arts organizationsoperating at a deficit has ranged from 36 percent in 2007 (during a strong economy) to 45 percent in2009 (the deepest part of the recession). In 2013, a time of improved economic health, 42 percent ofarts nonprofits still failed to generate positive net income—a figure that raises concerns about the longterm sustainability of arts organizations. Larger‐budget organizations were more likely to run a deficit,though no specific arts discipline is particularly more likely to run a deficit. While some of theseorganizations have reserves available to manage these financial situations and other deficits may be theresult of federal accounting and tax filing requirements, it is clear that the budget fortunes of nonprofitarts organizations got worse during the Great Recession and have been very slow to recover.5. Annual data collection of indicators is an ongoing challenge. Consider this more of a caution to futureresearchers rather than an excuse for busting all those well-intended publication deadlines. We weretold by the research directors who manage indicators for other industries to expect significant datadelays, existing indicators to cease being published, and multi-year data revisions to arrive at any timeduring the year. All true, it turns out. Indeed, when we began, the music recording industry barely tracked digital download sales.Now it comprises half of industry revenues. We’ve buried seven wonderful indicators that the producers of that research stoppedgenerating. Many data sources revise their historical record of prior years’ data. While these adjustmentschanged the index scores annually, they never reversed the overall trend established in ourmulti-year narrative.6. The arts are not the only game in town. Competitiveness is an important lens for examiningvitality. It's easy to use glowing adjectives about the arts and their inspirational benefits. But otherelements of society might be equally or more inspiring or successful. To help understand the arts’context in these changing environments, we compared our indicators to the ever-changing settings ofpopulation, economy, prices, and employment. Doing this helps us distinguish changes in the arts fromtrends affecting all sectors, and made what initially appeared like good news, troubling news. ForNational Arts Index 2016v
7.8.9.10.example, in 2011, private sector giving to the arts increased in total dollars, but the arts actually lostoverall market share of charitable giving. Mere tenths of a percentage point is a difference of millions ofcontributed dollars. If for example, the arts had a 4.8 percent share in 2008 instead of 4.1 percent, theywould have received 14.4 billion instead of 12.3 billion—a 1.1 billion difference.Provision of arts education is out of sync with student demand: A multi-year trend of decreases in K12 arts education finally rebounded in 2013. Between 1998 and 2009, the percentage of college-boundseniors with four years of arts or music grew from 15 percent to over 20 percent. Since 2009, however,the share of SAT test takers bringing this credential to their college application process slid. Did the pervasive K-12 arts education cuts in the 2000s have the downstream effect that waslong a concern? One of the benefits of the Index is that it provides a data-driven opportunity tobegin conversations about these key issues. In 2013, this arts-educated population was about 18 percent of all SAT test-takers. Ironically,the College Board reports show that students who take four years of arts or music averageabout 100 points better on the verbal and math portions of the SAT, compared to those with ahalf-year or less. Even with downward trends in the number of high school arts and music classes taken bycollege-bound seniors, college-level demand in this area continues to increase. The number ofcollege arts degrees rose steadily from 75,000 to 139,000 between 1997 and 2013. Reasons forthis include an increase in design degrees along with the appeal to college students of doublemajors combining arts with humanities, social sciences, and physical science (or other STEMdisciplines). Similarly, the percentage of SAT test takers who indicate an intention to major inthe
The Local Arts Index is a county-level arts data system built to promote more local usage of data in policy making, provide a framework for relating arts and culture to community priorities and aspirations, and t
