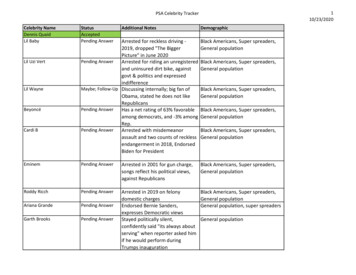
Transcription
Is “Seniors” One Demographic Group?An Analysis of America’s Changing Demographics
Is “Seniors” One Demographic Group?An Analysis of America’s Changing DemographicsTo succeed in today’s fiercely competitive environment, companies mustthoroughly understand consumer spending patterns as tastes and behaviorschange and new products are introduced. Staying abreast of or evenanticipating shifts in consumer spending patterns can greatly benefit thosewho are responsible for making strategic decisions about product and servicedevelopment, site selection, merchandise mix, and marketing.Analyzing census data, or annual projections based on the census, is an excellentway to gain insights about where people live and where different demographicsegments are growing or declining in influence. What demographic data won’treveal is what members of a group spend money on or how to reach and appealto them. These insights are possible by combining demographic data withconsumer spending, market potential, and lifestyle segmentation data to createan accurate view of consumer preferences and purchasing behaviors.2
The Growing Aging PopulationIt’s true that we’re all getting older. But as a whole, the US population truly isgetting older. In 2000, the median age in the United States was 35.3 years. By2010, this number had increased to 37.1 years.The population change for seniors, who are here defined as being 55 or older, ishigher than the percentage change for the US population. Today, seniors represent 25.2 percent of the US population. This is expected to increase to almost27.6 percent by 2016 and is up from just 21 percent in 2000.US Population by Age200020102016 (Projection)Median Age35.337.137.6% Population 55 21.1%24.9%27.6%9.7%3.4%29.5%13.3%US Population Change55 ChangeSource: Census 2010 Data and Updated Demographics (2010/2016)In addition to larger numbers of people reaching their seventies and eighties,the jump in the median age is also due to aging baby boomers. Approximately78 million baby boomers were born between 1946 and 1964, comprising oneof the largest demographic generations to date. According to the US CensusBureau, another American turns 65 every 13 seconds; approximately 10,000 babyboomers retire every day.For both boomers and seniors overall, their interests, social influences, goals,and preferences are very different from those of previous generations andamong themselves.Consumer goods companies have traditionally focused product development onthe coveted 18–49 demographic. Media companies followed suit, creating television shows and magazines that appealed to the same group.Today, there is more diversity in products and services designed for specificdemographics. Companies that target seniors in product development, packagedesign, merchandising, store design, distribution, and marketing can significantlyboost their bottom line.With over 2.3 trillionin disposable income,seniors are a force tobe reckoned with.3
The Diverse Senior PopulationThe differences in preferences and spending habits among seniors become moreapparent when seniors are segmented by affluence, education, employment, andlifestyle.Esri Tapestry Segmentation system recognizes the differences among seniorsand classifies them into nine distinct lifestyle segments:Prosperous Empty Nesters: Active, affluent married couples withno children at home, transitioning from child-rearing to retirement; foundthroughout the United States, with many located on each of the coastsSilver and Gold: Wealthy, educated seniors retired from professionaloccupations, half of whose households consist of married couples who’ve neverhad children; more than 60 percent located in the South, mainly in Florida, and25 percent in the West, primarily in California and ArizonaRustbelt Retirees: Married couples, with no children, or singles content tostay put in Rustbelt industrial cities; 67 percent located in the Northeast andMidwestSegmentation 101Segmentation systems operate on thetheory that people with similar tastes,lifestyles, and behaviors seek andlive near others with the same tastes.Their consumer behaviors—frompropensity to buy specific groceryitems to media consumption—can bemeasured, predicted, and targeted.Esri’s Tapestry Segmentationsystem combines the who of lifestyledemography with the where oflocal geography to create discreteneighborhood lifestyle segments withdistinct consumer behaviors.US Census data, collected every10 years, combined with Esri’sproprietary annual demographicupdates, is the bedrock of theTapestry Segmentation system. Esrialso acquires and vets data on marketpotential, consumer spending, andmedia habits to give analysts andbusiness professionals a comprehensive view of their target consumersand geographic markets.4Retirement Communities: Older, educated singles who live alone inmultiunit buildings or assisted-living facilities; found mostly in cities scatteredaround the United StatesThe Elders: Retirees in senior communities, primarily in Florida, Arizona, andCaliforniaSenior Sun Seekers: Fast-growing market of retired or soon-to-retireresidents in the South and West, especially in FloridaHeartland Communities: Small-town neighborhoods with a country lifestylein the Midwest and SouthSimple Living: Lower-income seniors who rent in US urban outskirts orsuburbsSocial Security Set: Seniors subsisting on very low fixed incomes in low-rentapartments in high‐rise buildings in large citiesThroughout this piece, the authors analyze purchasing behaviors of five of thesesegments—Prosperous Empty Nesters, The Elders, Retirement Communities,Senior Sun Seekers, and Social Security Set—to demonstrate the diversity ofconsumer behaviors among them.
Where Can You Find Seniors?They’re everywhere. Historically, when people retired, some—especially those inthe northeastern states—migrated to warm climates. Senior populations in stateslike California, Florida, Texas, and New York remain high, in part, because seniorsare aging in place, either to be near children and grandchildren or because theyare unable to move due to income or health reasons. Others stay put becausethey are working longer or perhaps never planning to retire.The concentration of seniors tells a different story from the population, ornumber of seniors. There are pockets of high and low concentrations due toa variety of factors. Florida, for instance, is where many seniors relocate toenjoy their retirement years. In other areas, younger people have left to pursueopportunities elsewhere, resulting in a higher concentration of seniors.Percent Seniors by CountyFar above average (more than 33%)Aelow average (25.1% to 33%)Below average (17.1% to 25%)Far below average (17% or less)Seniors make up 25 percent of the US population. This map shows the concentration of seniorsby county compared to the US average.Source: Esri Updated Demographics (2010)5
How to Succeed with SeniorConsumersSenior consumers influence a wide variety of industry sectors because of theirsignificant spending power. There is a real and increasingly profitable challengefor businesses to provide products and services that meet the unique needs ofspecific senior segments.RetailAs their needs and shopping habits change, seniors search for products andservices that meet their evolving demands. Some retailers are catering to theseniors market with larger signage, brighter lighting, shelf inventory that is easilyreached, wider aisles, and varied product selections.Some senior segments are also becoming much more computer savvy, researching and buying products online and even taking advantage of smartphonediscounts at checkout.Interpreting an IndexThroughout this document, you’llsee Market Potential and ConsumerSpending Indexes. They compareconsumer behavior of a particularTapestry Segment to the US nationalaverage.For example, in the Market PotentialIndex: Food Preferences chart onthis page, you’ll see that ProsperousEmpty Nesters index at 155 forbuying high-fiber foods. The nationalaverage is always 100, so ProsperousEmpty Nesters are 55 percent morelikely to purchase high-fiber foods.Conversely, Senior Sun Seekers are4 percent less likely to purchase thesethan the national average.Localizing merchandise mix in areas with a high concentration of senior consumers will help retailers succeed with these segments.For example, many people change their eating habits as they age, switchingto high-fiber and low-sugar diets, with data showing that they buy substantiallymore high-fiber and sugar-free foods than the general population.Market Potential Index: Food PreferencesTapestry SegmentBuy Foods Labeled asHigh FiberBuy Foods Labeled asSugar FreeProsperous Empty Nesters155126Retirement Communities129105The Elders120160Senior Sun Seekers96106Social Security Set123115Source: Esri Market Potential Data6
Conversely, data shows that seniors spend much less on men’s and women’sapparel than other consumers, representing fewer opportunities for manufacturers and retailers in this category. Seniors’ income, lifestyle, and lack of need for awork wardrobe could be contributing factors.Consumer Spending Index: Apparel SpendingTapestry SegmentMen’s ApparelWomen’s ApparelProsperous Empty Nesters7675Retirement Communities6160The Elders4649Senior Sun Seekers4141Social Security Set2828Source: Esri Consumer Spending Data
Real EstateDevelopers need to determine which type of seniors they want to target, sincehousing requirements for seniors are as varied as seniors themselves, with needsbased on affluence, age, lifestyle, and geographic location.Tired of dealing with harsh winters and home maintenance, some seniors incolder climates migrate to warmer places or downsize when they retire and theirchildren leave home. This migration, though, has decreased in recent years asthe economy has worsened.Seniors-only communities that offer amenities such as gyms, fitness programs,golf courses, bike trails, and a full roster of social activities attract many in theactive senior set. Affluent seniors who like to travel may prefer the security ofgated communities so they can “lock it and leave.” Others buy homes based oncurrent or anticipated health concerns, looking for first-floor master suites, openfloor plans, nonskid floors, lower counters, and wider doorways. Many seniorschoose retirement communities near retail stores, golf courses, hospitals, seniorcenters, and medical facilities, as they prefer to have amenities close by.Lifestyle and demographics alone, though, don’t tell the whole story. Thecounty with the highest projected percentage increase in seniors for 2010–2016is St. Bernard Parish, Louisiana. However, the population is comparatively small,and the home vacancy rate in 2010 was very high at 21.3 percent, which generallyindicates low demand for new housing. Lingering effects of Hurricane Katrina area contributing factor. Although Fort Bend County, Texas, has a lower projectedincrease in seniors than St. Bernard Parish, with a much larger senior populationcombined with a 4.9 percent vacancy rate, it represents better opportunity forsenior housing developers.Counties with Highest Projected Increase in Seniors, 2010–2016County2016 (Projection)2010–201620102010201055 Population55 % ChangeHousing UnitsVacant Units% Vacancy11,69364.7%16,7943,57321.3%Geary County, KS8,19456.9%14,5171,82712.6%Sublette County, 64.9%11,88241.7%17,8751,2266.9%St. Bernard Parish, LAFort Bend County, TXLincoln County, SDSource: Census 2010 Data and Esri Updated Demographics (2010/2016)8
Some census tracts in Maricopa County have vacancy rates in excess of 55 percent. Overall,13.9 percent of housing units in this county are vacant, campared to 11.4 percent nationally.Does Growth in Seniors Equal Opportunity?2010 Vacant HousingUnits (Esri) by Tracts40% or Greater30%–39.9%20%–29.9%10%–19.9%9.9% or LessOne of the counties with the highest increase in the senior population from 2000to 2010 was Maricopa County, Arizona, which includes the city of Phoenix. Thesenior population increased 43.5 percent, from 600,081 to 860,950, comparedto just a 24.2 percent increase in the overall population. The growth comes fromcontinued migration of retirees to the area from other parts of the country as wellas immigration. The area saw a 47.9 percent increase in the Hispanic populationfrom 2000 to 2010.Housing in Maricopa County is quite affordable for seniors, with a median homeprice of 136,536 compared to the US median home price of 157,913.So is Maricopa County a good opportunity for developers targeting seniors?Maybe not.In 2000, Maricopa County had 1.25 million housing units; in 2010, it had1.6 million. About 227,696 homes, or 13.9 percent, were vacant in 2010 accordingto the US Census. This is up from 9.4 percent, or 117,345 homes, in 2000, due inlarge part to overbuilding and a high foreclosure rate.9
Interests and ActivitiesAs people age and retire, they have more time to pursue their hobbies, whichrange from golf to reading books. Many expect that since seniors have moretime, they read more books. Interestingly, though, they spend less on books thanthe US average.However, book purchases among one segment, Prosperous Empty Nesters,indexes significantly higher at 125, showing that there’s opportunity for publishers and retailers that understand the interests and preferences of this group.Consumer Spending Index: BooksTapestry SegmentBook PurchasesProsperous Empty Nesters125Retirement Communities97The Elders83Senior Sun Seekers69Social Security Set42Source: Esri Consumer Spending DataMany seniors golf—much more so than the average American. It’s especiallypopular with the Prosperous Empty Nesters, Retirement Communities, and TheElders segments, creating opportunities in communities with high concentrationsof these populations not only for golf courses but also for stores that sell golfproducts such as clothing, equipment, and lessons.Market Potential Index: GolfMany seniors golf—much more sothan the averageAmerican.10Tapestry SegmentPlay GolfProsperous Empty Nesters142Retirement Communities123The Elders166Senior Sun Seekers63Social Security Set105Source: Esri Market Potential DataData can also be used to reveal regional preferences and business opportunities.For example, yoga is very popular in San Juan County, Washington, indexingat 127. People aged 55 and over make up 45.7 percent of the population in thatcounty, suggesting opportunity for yoga studios that create classes geared towardseniors and manufacturers of yoga products marketing specifically to seniors.
Automotive/TransportationData shows that seniors purchase or lease vehicles less frequently than theaverage American. Purchasing behavior varies between senior segments, just asit varies within the total population.Market Potential Index: Car Lease and PurchaseTapestry SegmentBought or LeasedBought or LeasedVehicle in Last 12 Months Vehicle 1–2 Years AgoProsperous Empty Nesters103114Retirement Communities8183The Elders8177Senior Sun Seekers103110Social Security Set6643Source: Esri Market Potential DataProsperous Empty Nesters have relatively high incomes and therefore themeans to purchase new vehicles. This segment primarily lives in establishedneighborhoods where most amenities are not within walking distance, sovehicles are needed. Data also shows that Senior Sun Seekers have lowerincomes but a high propensity for taking trips that require a personal vehicle.Social Security Set has even lower incomes, and many live in high-rises andwalk or rely on public transportation.The fact that some seniors can no longer drive or don’t want to may cause someto think that there are additional opportunities for taxi service companies. Thereality, though, is that seniors overall spend less on those services than average,and in some cases much less. However, local market analysis may show areas ofsignificant opportunity.Consumer Spending Index: Taxi Fare and Limousine ServicesTapestry SegmentProsperous Empty NestersRetirement CommunitiesTaxi and Limousine Spending88118The Elders59Senior Sun Seekers59Social Security Set88Source: Esri Consumer Spending Data11
Health CareAs people age and incomes decline, health care expenses are a primary concern.It’s no surprise that seniors overall spend more on health care than the US average.Yet data shows that two senior segments, Senior Sun Seekers and Social SecuritySet, spend less than the average American household. This is due to their lowermedian incomes and because many receive some sort of public assistance andtherefore pay less out of pocket for medical care.Consumer Spending Index: Average Household SpendingTapestry SegmentMedical sIndexProsperous Empty NestersRetirement Communities 2,290128 670135 120117 1,830102 550110 10097The Elders 1,960109 600120 110107Senior Sun Seekers 1,51084 46092 9097Social Security Set 82046 24048 5049Source: Esri Consumer Spending Data
Opportunities are exploding for home health care companies as more seniors preferto stay in their homes with assistance as long as possible. Jobs abound as thesecompanies struggle to fill home health aide positions to keep up with demand.With the growing senior population, there are increasing opportunities forcompanies that offer services such as home delivery of health care products andmedical equipment, as well as in-home physical therapy, assistance with dailyliving, and hospice care.The Business of DiabetesSource: Esri Community AnalystThe prevalence of diabetes increases as the US population ages. The AmericanDiabetes Association reports that 8.3 percent of the US population has diabetesand that it afflicts almost 27 percent of adults aged 65 and over.Adult Diabetes Rateby County12% or greater11%–11.9%10%–10.9%9%–9.9%8.9% or lessA look at the Tallahassee and Panama City, Florida, area reveals that thepercentage of the total population with diabetes varies from county to county.Analyzing this data could help a pharmacy refine priorities of where to providein-store diabetes counseling services and information for its customers. It couldalso help companies selling diabetes supplies via mail to better target theircustomer acquisition efforts.13
TravelTravel is part of many a retiree’s plans, with some planning to travel around theUnited States and the world. While this dream comes true for some seniors, itdoesn’t for others due to income, health, and physical limitations. Data showsthat seniors who do travel take a variety of trips, from family vacations to beachdestinations to trips abroad.More and more, tourism companies offer trips developed specifically for seniors.Elderhostel, for instance, focuses on providing lifelong learning adventures, andothers offer seniors-only cruises or bus tours.Ability to and interest in travel varies greatly by senior segment. With a medianage of 73.2, The Elders is the oldest of Esri’s Tapestry segments. With a relativelylow median income of 42,293 but a high median net worth of 186,098, theyhave the financial resources to travel both domestically and internationally—which they do at a higher rate than any other senior segment.Market Potential Index: TravelTapestry SegmentDomesticTravel in Last12 MonthsForeign Travelin Last 3 YearsTook Cruise inLast 3 YearsProsperous Empty Nesters127125154Retirement Communities105119118The Elders121145269Senior Sun Seekers8072117Social Security Set876789Source: Esri Market Potential DataData in the table above shows that cruises are popular with many in the seniorset. While some companies offer cruises that cater specifically to seniors, othersoffer trips that appeal to multiple generations so seniors can vacation with theirchildren and grandchildren.14
The amount that seniors actually spend on travel, in general, is lower than that ofthe average US household. This is likely due to the smaller househo
Senior Sun Seekers: Fast-growing market of retired or soon-to-retire residents in the South and West, especially in Florida Heartland Communities: Small-town neighborhoods with a country lifestyle in the Midwest and South Simple Living: Lower