Transcription
PAP-719Evaluation of the Primary Bypass Flowmeters at theTracy Fish Collection FacilitiesJoseph P. KubitschekMarch 1996HYDRAULICS BRANCHOFFICIAL FILE COPY
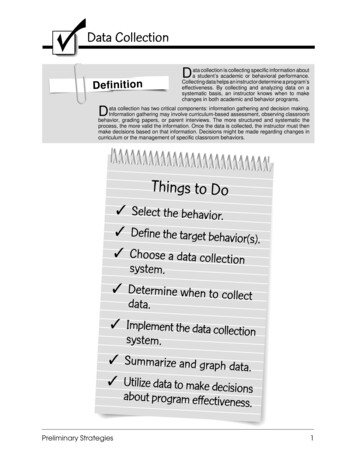
EVALUATION OF THE PRIMARY BYPASS FLOWMETERS AT THETRACY FISH COLLECTION FACILITIESbyJoseph P. RubitschekINTRODUCTIONThe installation of an upgraded instrumentation system for the improvedmonitoring of critical hydraulic operating parameters at the Tracy FishCollection Facilities (TFCF) was completed in 1995. The system is intended toprovide improved salvage efficiencies through improved operation of thefacilities, to support ongoing biological studies, and to provide automationcapabilities for future use. The system consists of ten level sensors formonitoring water surface elevations at critical locations throughout thefacilities; an acoustic, open-channel flowmeter for monitoring primary louverchannel velocity and discharge; four external mount, ultrasonic flowmeters formonitoring each of the four primary bypass discharges; four dissolvedoxygen/temperature/salinity sensors for monitoring water quality in each of thefour holding tanks; and a data acquisition system (DAS) for providing real-timemonitoring via graphical display and data logging of all system parameters.Figure 1 represents a plan view schematic of the TFCF.An evaluation of the primary bypass flowmeters was conducted to ensure that theinstruments are operating correctly. The performance of the primary bypassflowmeters directly influences two critical hydraulic operating parameters, whichare determined indirectly using the primary bypass discharge measurements. Theseparameters consist of the primary bypass velocity ratios for each of the fourprimary bypass entrances and secondary channel louver approach velocities. Theprimary bypass velocity ratios for each of the four primary bypasses aredetermined indirectly as:BE ) ( QB ) ( 1 )Primary bypass ratio, ( V(1)VA ABE VAWhere,V BE Primary bypass entrance velocity (ft/s],VA Measured primary louver forebay approach velocity (ft/s],QB Measured primary bypass discharge [ft'/s], andA,, Primary bypass entrance area [ft2].The secondary channel louver approach velocity is determined indirectly as:1
Secondary channel velocity ( Q131 QB2 QB3 QB4 )dSwS(2)Where,4b11 QBz. Q3. Q9 Measured primary bypass discharges for each primary bypass,respectively [ft3/s],d, Measured flow depth in the secondary channel [ft], andw, Secondary louver channel width [ft].The TFCF operating criteria as established in the Agreement for Reducing andOffsetting Direct Fish Losses - TFCF (memorandum dated July 27,1992) requirethat the above parameters be maintained in accordance with procedures outlinedby Mecum, 1977. Therefore, since these critical parameters are determinedindirectly using the direct primary bypass discharge measurements, it isimportant that these instruments operate correctly.CONCLUSIOThe existing Polysonics flowmeters appear to be operating correctly and on average, measured 2.2 percent greater than the discharge measured by aControlotron flowmeter of similar type.The current condition of the steel pipe sections on which the Polysonics0flowmeters are installed is less than ideal and likely contributes to errorsassociated with the Polysonics instrument.Improvements in the accuracy of the Polysonics flowmeters will likely be realized through the replacement of each steel pipe section.Based on the results of this evaluation, the Polysonics flowmeters are likely operating within the 5 percent accuracy specified by the manufacturer.The results of this comparative evaluation represent the relative0performance of the Polysonics flowmeter as compared with the ControlotronThere is no means available based on this evaluation, forflowmeter.determining, exactly, the accuracy of the Polysonics flowmeter under the uniqueconditions of the TFCF primary bypass applications.TEST SETUPThe existing Polysonics flowmeters are external mount, ultrasonic, transit-timeinstruments which are configured for a single path, direct mode of operation.The ultrasonic transducers are installed such that the acoustic path is orientedin the horizontal plane. These instruments are located on each of the four2
— 4E i-TON hKWOR'Ue.1- WTL*hVA BUNG FVW—HOcn 40 TANK EFRAAWrSCREM"%VOKrEKK Wti::7K 4M4Q PLANrFSH VMS PMTON CABLEWAYFigure 1. - Plan view schematic of the Tracy Fish Collection Facilities.3
primary bypass lines. The primary bypass lines consist of 36-in, unlined steelpipe with a 3/16-in wall thickness. The steel pipe sections on which thePolysonics flowmetes are installed, for each bypass, are approximately 8-ft inlength and are located between two 36-in gate valves.The principle of operation for these instruments is based on measuring thetransit-time of an acoustic signal transmitted through the pipe section to thereceiving transducer. Using the measured transit-time and the known sonicvelocity of the acoustic signal in water, the flow velocity is calculated. Thedischarge is then computed using this measured flow velocity and the known crosssectional area of the pipe.A portable Controlotron, external mount, ultrasonic, transit-time flowmeter wasinstalled at the same location as the Polysonics flowmeter on primary bypassNo.l, for comparison. The flowmeter consists of size 5 mounting tracks fortransducer alignment, size 5 ultrasonic transducers, transducer cables, and aportable flow computer. This instrument was configured for a single path, directmode of operation. The ultrasonic transducers were mounted such that theacoustic path was oriented at 450 to the horizontal plane.PROCEDUREInitial attempts at installation of the Controlotron flowmeter were configuredin a dual path, reflect mode which represents the most accurate configuration.A single path in reflect mode was first installed to determine the feasibilityof this approach. However, upon initialization of the flow computer, detectionfault errors were obtained indicating that the acoustic signal transmission wasnot successful. Repeated attempts at repositioning the transducers also failed.It was reasoned that the physical condition of the pipe (ie. degree of scalingon the interior walls) created significant acoustic signal attenuation.Realizing this condition, the instrument was set up in direct mode which provedto be immediately successful.This result confirmed that the previousunsuccessful attempts were likely due to the physical condition of the pipe asopposed to problems with the equipment. Due to time constraints, an additionalacoustic path was not installed.Upon successful installation of the Controlotron flowmeter in single path, directmode, the sonic velocity, as determined by the Controlotron flow computer, waschecked. The flow computer indicated a measured value of 1378 m/s. However, forthis installation, given an approximate water temperature of 10 C (50 F) themeasured sonic velocity should be closer to 1447 m/s. This value was selectedand input into the flow computer. The contributing factor to this discrepancyis again likely due to the physical condition of the pipe. Scaling on theinterior wall of the pipe can significantly influence the determination of thisparameter. With this correction employed, primary bypass valve No. 1 was closedto allow for zeroing of the instrument. The Controlotron flow computer was thenconfigured to provide analog output of the measured discharge for data loggingpurposes. A DATAQ DAS was used for A/D (analog to digital) conversion of theoutput and interfacing with a laptop computer. This DAS was initially programmedto log discharge data for an 8-hour test period. The intent was to compare thisdata with 8 hours of corresponding Polysonics data being logged by theinstrumentation system (CIMPAC) DAS. However, closer inspection of the CIMPACki
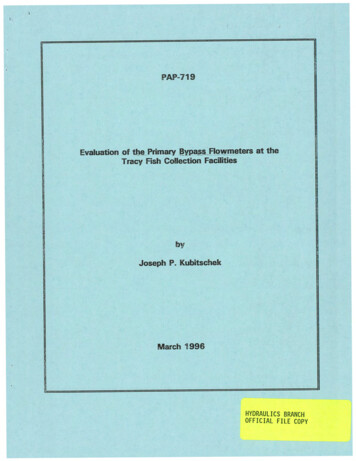
DAS revealed that no data were being logged by the system. The CIMPAC system wasthen configured to log data for a minimum 1-minute interval. The resulting testduration was reduced to 45 minutes. The test was initiated by closing bypassvalve no. 1 for a period of 2 minutes. This initiation procedure allowed for theestablishment of a time datum from which corresponding data acquired by eachflowmeter could be compared at the same instant in time.RESULTSA total of 45 minutes of comparison discharge data was acquired under thepreceding test procedure. Although this was considerably less than initiallydesired, it has proven to be sufficient for the purposes of this evaluation.Table 1 presents the data acquired for this test and the resulting percentdiscrepancy between the Polysonics and Controlotron flowmeters for eachmeasurement at the same instant in time. The percent discrepancy is determinedas:Percent discrepancy ( QPolysonics — QControlotron)X 100(3)QControlotronWhere,QFolysonics Polysonics instantaneous discharge measurement (ft'/s],andQControlotron Controlotron instantaneous discharge measurement (ft'/s] .The average percent discrepancy for all measurements is included in Table 1 andwas found to be 2.2 percent.This result indicates that the Polysonicsflowmeter discharge measurement was, on average, 2.2 percent greater than thedischarge measured by the Controlotron flowmeter.The primary factorcontributing to this discrepancy is most likely due to the respectiveinstallation locations of the two flowmeters. Recall that the Controlotronflowmeter was installed such that the acoustic path was oriented at 45' to thehorizontal plane. And, the Polysonics flowmeter is installed such that theacoustic path is along the horizontal plane. Under this arrangement, anyskewness of the velocity profile in the pipe would create a discrepancy betweenmeasured velocities along the two different acoustic paths. Therefore, sincesome skewness of the velocity profile likely exists, a discrepancy on the orderof that which is indicated by these results is not suprising.Figure 2represents the discharge verses time plot for the data acquired from bothflowmeters. The Controlotron flowmeter readings appear to be somewhat morestable than the corresponding Polysonics readings. Although, this plot indicatesthat good agreement exists between the Polysonics and Controlotron flowmeters,the best indicator of the relative performance between these instruments isillustrated as figure 3. This figure represents the percent discrepancy versestime for each instantaneous discharge measurement.These results indicate that the Polysonics flowmeter is operating correctly.However, no specific determination of the accuracy associated with this19
Table 1. - Primary bypass No. 1 dischargemeasurement comparison data.T iM0T2 {P nlys"o"n 3ca1 Q {C0'xttr l,o'tron) ' 1 4437.67136.01 6.04.83.91.13.12.8a'ncyav rage; instrument can be made. This is due to the fact that this evaluation approachmerely provides an indication of the relative performance of the Polysonicsflowmeter as compared with the Controlotron flowmeter. However, based on theresults of this comparison, previous experience with the Controlotron flowmeter,the hydraulic and physical considerations associated with this application, andengineering judgement, it can be reasoned that the Polysonics flowmeter accuracyis certainly within 10 percent of actual discharge and likely within 5 percent.G
easured Discharge vs. TimePrimary Bypass No. 15040N30vrnm.a.zUNPolysonics Data.6- Controlotron DataO 20100051015202530354045Time (minutes)Figure 2. - Discharge verses time plot of instantaneous dischargemeasurement data.ercent Discrepancy vs. TimePrimary Bypass No. 1 % Discrepancy51015202530354045Time (minutes)Figure 3. - Percent discrepancy verses time plot of instantaneousdischarge measurement data.7
DISCUSSIONA discharge measurement accuracy within 1 percent can be obtained using theControlotron flowmeter under ideal conditions and in a dual path, reflect modeof operation. However, under less than ideal conditions and in single path,In this case, andirect modes of operation this accuracy is compromised.accuracy within 3 percent may be obtained, again if conditions are ideal. Manyfactors contribute to the accuracy limitations of this instrument and otherinstruments of this type. These factors include the installation set up (i.e,number of acoustic paths and mode of operation); the proximity of the instrumentto upstream, flow disturbance generating features (i.e, valves, pipe bends,transitions, etc.); the physical condition of the pipe; the degree of debris loador air entrainment within the flow being measured; and the flow conditions withinthe pipe (i.e, the degree of secondary or cross flow conditions). For the TFCFapplication, conditions are less than ideal. The known poor physical conditionof the bypass pipes on which the Polysonics flowmeters are installed, contributesInto uncertainties regarding the accuracy of the Polysonics instrument.addition, no details concerning secondary or cross flow conditions are available,which further contributes to the uncertainty associated with the accuracy of thePolysonics flowmeter. However, realizing that the secondary or cross flowconditions are likely minimal due to the size of the primary bypass pipes, thelocation of the flowmeters with respect to flow disturbance generating features(i.e, the minimum 20 diameters downstream of the bypass entrance transitionexists), and the relatively small flow velocities (i.e, on the order of 3.0 - 8.0ft/s), the contributing error associated with these considerations is likelysmall.Assuming a 5 percent accuracy in the primary bypass discharge is attainable, anuncertainty associated with the indirectly computed parameters (i.e, primarybypass velocity ratios and secondary channel velocity) may be determined by erroranalysis. From equation (1), the primary bypass velocities ratios are computedusing the directly measured primary bypass discharge and the primary louverchannel velocity parameters. Again, assuming both of these instruments measuretheir respective parameters to within 5 percent, the resulting error associatedwith the primary bypass velocity ratios is determined as:Percent uncertainty (SQ PB) Z (PBS PA)V PAX 100(4)Where,(SQPB/QPB ) Fractional uncertainty associated with the primary bypass dischargemeasurement, and(SVPA /VPA ) Fractional uncertainty associated with the primary louver approachvelocity measurement.The fractional uncertainty is defined as the uncertainty associated with ameasured value divided by that value or in this case (SQPB /QpB ) for the primary0
bypass entrance velocity and (8VFA /VFj for the primary louver approach velocity.Where, in generalized terms 8x is the uncertainty associated with the measuremedparameter, and x is the actual measured parameter. Furthermore, the fractionaluncertainty multiplied by 100 gives the percent uncertainty or error. Thus, theerror associated with the primary bypass velocity ratios is simply the quadraticsum of the errors associated with the directly measured parameters. For theprimary bypass velocity ratio the resulting error would be on the order of 7percent, based on this analysis.The same analytical approach can be applied to the indirect computation of thesecondary channel velocity based on the directly measured primary bypassdischarges. From equation (2), the secondary channel velocity is determinedusing the sum of the four primary bypass discharge measurements. Again, assumingthat each of the four measurements are accurate within 5 percent, the errorassociated with the calculated secondary channel velocity is comprised of thequadratic sum of the fractional uncertainties for each of the four measurements.This is given as:Percent Uncertainty (S Qal 2) (SQaiQa2 )2 (Qazb Qa3Qas)2 (U QB4 2)X100 (5)Qa4Where,(8QBI/QB1) I (8QB2/QB2)I (8Q B3 /Q B3). OQ B9 /Q B4 ) Fractional uncertainties associatedwith each of the primary bypass discharge measurements.Thus, the error associated with the secondary louver approach velocity will beon the order of 10 percent based on this analysis.The results of this analysis indicate that the errors, associated with the directmeasurement of the primary bypass discharge and primary louver approach velocityparameters, will influence the indirectly determined parameter calculations. Thepropagation of errors was determined by the quadratic sum of the independentparameter errors. This approach is valid, since it can be reasoned that theseerrors associated with each measurement are independent of each other and arerandom.9
-W1.Agreement for Reducing and Offsetting Direct Fish Losses - Tracy FishCollection Facilities, Memorandum dated July 27, 1992.2.Mecum, W.L., Recommended Operations for the Federal Fish CollectionFacility at Tracy, From June 1 to September 30, Administrative Report No. 77-4,April 1997.Taylor J.R., An Introduction to Error Analysis - The Study of Uncertainties3.in Physical Measurements, University Science Books, 1982.10
A portable Controlotron, external mount, ultrasonic, transit-time flowmeter was installed at the same location as the Polysonics flowmeter on primary bypass No.l, for comparison. The flowmeter consists of size 5 mounting tracks for transducer alignment, size 5 ultrasonic tran