Transcription
March 9, 2016Mr. and Mrs. Callahan1234 Main St.Baltimore, MD 21287Dear Mr. and Mrs. Callahan,We appreciate your careful consideration in trusting The University of Akron with your financialportfolio. Our knowledge and expertise is sure to help align you with your goals and build asolid foundation for the future.Following this letter, we have included your financial plan. In it, you can expect a thoroughevaluation of your current financial state as well as a plan of action to accomplish the goals youpresented us with. These recommendations and solutions are what we believe to be the mostfavorable steps towards distributing funds, preserving wealth, and leaving a sheltered legacy.Please take time to review amongst yourselves as well as conserving it in a safe location. In thenear future, we will extend an invitation to meet and plan the next steps going forward. Wegreatly anticipate meeting with you soon.Thank you.2
TABLE OF CONTENTSExecutive Summary Goals and Objectives: Page 5SWOT Analysis: Page 5Assumptions: Page 6Cash Flows and Debt Management Current Cash Flows: Page 9Projected Cash Flows: Page 11Debt Management: Page 13Retirement Income Planning Guaranteed Income Elections: Page 16Bucketing Strategy: Page 17Income Distribution: Page 17Annuity Analysis: Page 18Investment Planning Ellie’s Allocation: Page 20David’s Allocation: Page 21Education Planning Brandon’s Funding: Page 24Planning for Future Grandchildren: Page 25Risk Management and Insurance Planning Life Insurance Shortfall Analysis: Page 28Disability Insurance: Page 30Health and Medical Insurance: Page 31Long-Term Care Insurance: Page 31Auto, Homeowners, and Umbrella Insurance: Page 32Estate Planning Beneficiaries: Page 34Basic Estate Planning Documents: Page 34Estate Tax: Page 35Gift Splitting: Page 35Next Steps Checklist: Page 36Closing Summary: Page 37Appendix Tax Calculations: Page 40Investment Account Growth Calculations: Page 41Retirement Option Calculations: 45Retirement Income Distribution Calculations: 46Life Insurance Calculations: 483
EXECUTIVE SUMMARY4
Goals and ObjectivesRetirement Planning:1. Fully fund retirement as soon as possible but no later than David’s age 65Investment Planning:2. Align current investments with personal risk tolerancesInsurance Planning:3. Obtain adequate long term care coverageEducation Planning:4. Help fund grandchildren’s college educationSWOT AnalysisAfter a comprehensive review of your current financial situation, including your personal goalsand objectives, we have created a SWOT analysis. The SWOT chart lays out your currentsituation and what your future could hold, by highlighting your strengths, weaknesses, areas ofopportunity, and potential threats.Our goals for you are to: Utilize your strengths Reduce your weaknesses Increase your opportunities And manage your threatsStrengths1. Limited liabilities2. Multiple retirement income sources3. Job security4. Estate is below tax thresholdOpportunities1. Possibility to refinance mortgage2. Performance based bonus’ at JHH13. Term life insurance convertibility12Weaknesses1. Insufficient long term care coverage2. Dated estate planning documents3. Lack of emergency fund4. High interest rate on mortgageThreats1. Medical expenses in retirement2. Student loan co-signer liability3. Poor performing 403(b) investment optionsJohns Hopkins Hospital (JHH)According to The College Board, the average cost for tuition and room and board for a public, instate, four-year5
AssumptionsPersonal Information:1. Your primary residence is located in Baltimore, Maryland based on your employment atJohns Hopkins HospitalTaxes:1. Your marginal state income tax rate is 5.25%2. Your marginal federal income tax rate is 28%3. Your retirement effective state income tax rate is 3.74%4. Your retirement effective state income tax rate is 18.47%5. Long-term capital gains are taxed at 15%Cash Flows:6. Your annual mortgage payment is 28,992.007. The 5.20% interest rate on your mortgage is fixed8. Your annual auto loan payment is 8,928.009. You are not making payments on Allison’s school loan10. The average inflation rate is 3.22%11. 2015 expenses reflect the reduction due to the kids being out of the houseInvestments:12. Investment income is reinvested13. We expect to earn a 7.2530% rate of return on David’s investments14. We expect to earn a 5.3005% rate of return on Ellie’s investments14. Ellie is a moderately conservative investor15. David is a moderately aggressive investorRetirement Planning:16. Your life expectancies are 95 years17. The Social Security Wage Base does not increase after 201618. David will delay Social Security until age 70 with an annual benefit of 42,50419. Ellie will collect Social Security at age 64 with an annual benefit of 18,99620. The cost of living adjustment on Social Security benefits is 2%21. Retirement income need is 100,700 in today’s dollarEducation Planning:22. The current cost of college tuition is 20,000223. Tuition is increasing by 5% annually2According to The College Board, the average cost for tuition and room and board for a public, instate, four-yearuniversity is nearly 20,000 for 2015-2016.6
Insurance Planning:25. Your current long-term disability coverage ends at age 65 or retirement26. Johns Hopkins provided group term life insurance coverage increases with salary27. Johns Hopkins provided term insurance coverage ends at retirement28. Individual 30-year term policies coverage ceases at the end of 2024Estate Planning:29. You have made no taxable gifts this year30. Current beneficiaries are as listed:AssetDavid's Rollover IRADavid’s 403(b)Ellie’s 403(b)Brokerage Account (JTWROS)David’s 529 PlanPersonal Residence (JTWROS)David’s VehicleFurniture and Household Items (JTWROS)Primary BeneficiaryEllieEllieDavidSurviving SpouseAllisonSurviving SpouseNot SpecifiedSurviving Spouse31. You currently have no contingent beneficiaries assigned7
CASH FLOW AND DEBT MANAGEMENT8
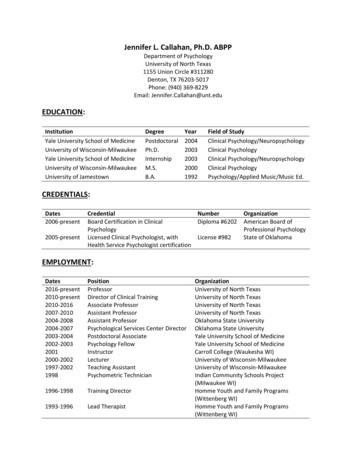
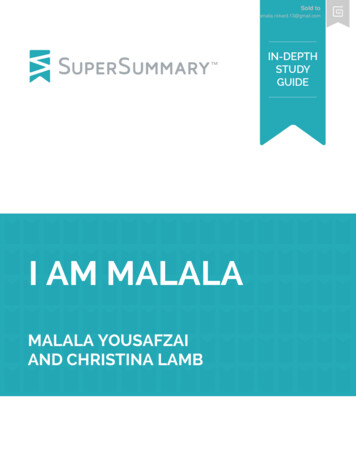
Current Cash Flow AnalysisStatement of Cash Flows 2015INFLOWSHousehold IncomeDavid SalaryDavid BonusEllie SalaryEllie BonusTotal Annual IncomeTOTAL CASH INFLOWS 147,000.00 38,000.00 60,000.00 10,000.00 255,000.00 al TaxesSavingsDavid 403(b)Ellie 403(b)Brokerage AccountTotal SavingsInsurance PremiumsAuto InsuranceTerm Life InsuranceLong Term Disability InsuranceTotal Insurance PremiumsDebt PaymentsMortgage PITIAuto PaymentsTotal Debt PaymentsOther -RestaurantsAuto-Fuel and styleTotal Other ExpensesTOTAL OUTFLOWS 6,600.00 17,250.00 2,750.00 11,394.00 11,928.00 2,964.00 6,200.00 5,500.00 5,100.00 14,164.00 8,350.00 6,700.00 98,900.00 255,000.00CASH FLOWSTotal InflowLess: Total OutflowCASH FLOWS 255,000.00 255,000.00 0.00 39,528.00 11,687.00 3,698.00 9,531.00 64,444.00 12,250.00 8,750.00 28,732.00 49,732.00 1,800.00 1,128.00 1,076.00 4,004.00Taxes, 64,444.00,25%OtherExpenses, 98,900.00,39% 28,992.00 8,928.00 37,920.00DebtPayments, 37,920.00,15%Savings, 49,732.00,19%InsurancePremiums, 4,004.00,2%9
Statement of Financial Position 2015ASSETSCashChecking Account (JTWROS)Savings Account (JTWROS)Total Cash Equivalents 31,526.00 17,865.00 49,391.00Non-Qualified AssetsBrokerage Account (JTWROS)Total Non-Qualified Assets 27,797.00 27,797.00Qualified AssetsRollover IRA (David)Johns Hopkins 403(b) DavidJohns Hopkins Matching AccountJohns Hopkins 403(b) Ellie529 PlanTotal Qualified Assets 142,304.00 305,764.00 23,247.00 49,121.00 15,003.00 535,439.00Personal AssetsPersonal Residence JTWROSVehicleFurniture and Household ItemsTotal Personal Assets 475,000.00 22,000.00 50,000.00 547,000.00TOTAL ASSETSCash 49,3914%NonQualifiedAssets 27,7973%PersonalAssets 547,00047%QualifiedAssets 535,43946% 1,159,627.00LIABILITIESLiabilitiesMortgageAuto LoanStudent LoanTotal Long Term Liabilities 226,964.00 17,282.00 78,000.00 322,246.00TOTAL LIABILITIES 322,246.00NET WORTHTotal AssetsLess: Total LiabilitiesTOTAL NET WORTH 1,159,627.00 322,246.00 837,381.00Upon reviewing your cash flow statement for the previous year, 2015, we can conclude thatyour annual cash inflow of 255,000 is sufficiently covering your annual cash outflow of 255,000. Your net cash flow is 0.v We recommend maintaining a positive net cash flow. Carrying negative net cash flowsmay lead to high interest debt or asset depletion, inhibiting your retirement plans.Therefore, to ensure your financial goals are met we advise maintaining your goodhabit of having positive cash flows each year.10
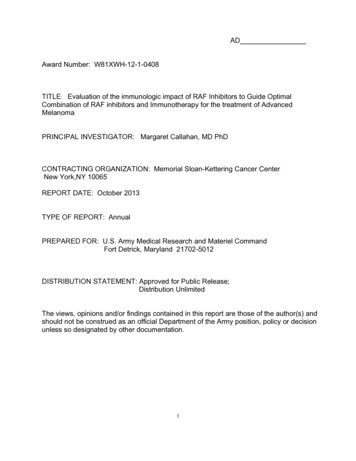
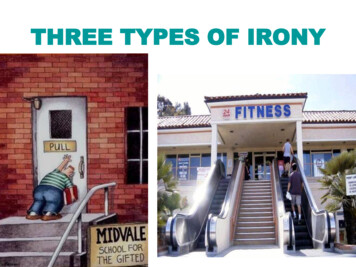
Projected Cash Flow 60616263Pre-Retirement Cash FlowsTotalTotalTotalTaxesExpensesSavings 64,444.00 140,824.00 49,732.00 66,519.10 144,066.54 51,383.10 68,661.01 147,413.49 53,089.02 70,871.90 141,940.21 54,851.58 73,153.97 145,506.17 56,672.65 75,509.53 149,186.96 58,554.18 77,940.94 152,986.27 60,498.18 80,450.63 156,907.92 62,506.72 83,041.14 160,955.84 64,581.94 85,715.07 165,134.11 66,726.06GrossIncome 255,000.00 264,344.40 274,031.33 284,073.32 294,483.42 305,275.10 316,462.37 328,059.73 340,082.21 352,545.41Free CashFlow 0.00 2,375.66 4,867.80 16,409.64 19,150.62 22,024.43 25,036.99 28,194.46 31,503.29 34,970.17 400,000.00 350,000.00 300,000.00Free Cash Flow 250,000.00Savings 200,000.00Expenses 150,000.00Taxes 100,000.00Gross Income 50,000.00 0.002015 2016 2017 2018 2019 2020 2021 2022 2023 2024The table and graph above show your projected pre-retirement cash flows. Gross incomereflects the historical average growth of your income since 1991. David’s income has beengrowing at an average rate of 3.62% and Ellie’s at 3.76%. Taxes, expenses, and savings areshown increasing with inflation. However, the following expenses are earmarked as “fixedexpenses” and are not projected to increase: mortgage payments, auto payments, autoinsurance premiums, term life insurance premiums, and long-term disability insurancepremiums. Free cash flow is gross income minus taxes, expenses, and savings.v We recommend allocating your free cash flow toward your retirement savings andour proposed savings for Brandon’s education according to page 23. The table andgraph on the next page show your projected cash flows reflecting our proposal.11
Proposed Pre-Retirement Cash FlowsTotalProposedProposedTotal TaxesExpensesEducation Savings Retirement Savings 64,444.00 140,824.00 1,998.00 47,734.00 66,519.10 144,066.54 1,998.00 51,760.77 68,661.01 147,413.49 1,998.00 55,958.82 70,871.90 141,940.21 1,998.00 69,263.22 73,153.97 145,506.17 1,998.00 73,825.27 75,509.53 149,186.96 1,998.00 78,580.61 77,940.94 152,986.27 1,998.00 83,537.17 80,450.63 156,907.92 1,998.00 88,703.18 83,041.14 160,955.84 1,998.00 94,087.23 85,715.07 165,134.11 1,998.00 99,698.23GrossIncome 255,000.00 264,344.40 274,031.33 284,073.32 294,483.42 305,275.10 316,462.37 328,059.73 340,082.21 352,545.41 400,000.00 350,000.00 300,000.00Proposed Rehrement Savings 250,000.00Proposed Educahon Savings 200,000.00TaxesExpenses 150,000.00Gross Income 100,000.00 50,000.00 0.002015 2016 2017 2018 2019 2020 2021 2022 2023 202412
Debt Management AnalysisMortgage LiabilityCurrent Balance 226,964.00Annual PITI Payment 28,992.00Fixed Interest Rate5.20%Years Remaining10.311The only mortgage liability you currently have is on your personal residence. According to thestatement of financial position you have provided us the remaining balance is 226,964 with afixed interest rate of 5.20% and your annual PITI (principle, interest, taxes, and insurance) is 28,992. Based on these numbers we are assuming you have 10 years and 4 months left untilyour mortgage is paid off. The housing expense ratio compares your annual PITI payment toyour gross income. We typically recommend housing expense ratios do not exceed 28%. Yourcurrent ratio is 11.37%; therefore you are significantly below the industry standard.Current 10 year fixed interest rates fall around 2.83%3, compared to your current rate of 5.20%.Based on this significant difference, we advise taking advantage of the lower rate andrefinancing your mortgage. Below are two refinancing scenarios.Option 1:Current Balance 226,964.00Annual PITI Payment 28,992.00Fixed Interest Rate2.83%Years Remaining8.974If you want to keep years remaining consistent with your current plan, your annual PITIpayments would be reduced to 25,687.08 increasing your free cash flow by 3,304.92 a year.By taking advantage of option 1, you have the potential to save a total of 34,077.24 in interest.Option 2:Current Balance Annual PITI Payment 226,964.00 25,687.08Fixed Interest Rate2.83%Years Remaining10.311Another option would be to continue with your current annual PITI payment of 28,992 andpay off your mortgage 1 year and 4 months earlier. By taking advantage of option 2, you havethe potential to save a total of 38,754.33 in interest.v We recommend choosing option one in order to strategically match the timehorizon with retirement goal date. The rest of our proposals and projectionscurrently reflect implementing option one. However, should you choose to go withoption two, your plan can be adjusted accordingly.3This rate is based on quotes ran on April 13, 2016. Actual rates might be higher or lower than this estimate.13
Emergency FundYou currently do not have assets earmarked toward an emergency fund. The purpose of thisfund is to ensure financial security should anything detrimental happen to your cash inflows oryou incur a large unexpected expense. An emergency fund should typically cover three to sixmonths of necessary living expenses.v The current balance of your checking account is 31,526, and your savings accountis 17,865. We recommend reallocating 16,452 from your checking account toyour savings account and specifically earmarking 100% of your savings account asan emergency fund. This will sufficiently fund three months of your necessaryliving expenses. The chart below illustrates all of your current expenses we deemnecessary, and shows annual expenses, six months, and three months.Emergency Fund CalculationFederal Taxes 39,528.00State Taxes 9,531.00Auto Insurance 1,800.00Term Life Insurance 1,128.00Long Term Disability Insurance 1,076.00Mortgage PITI 28,992.00Auto Payments 8,928.00Utilities 17,250.00Medical 2,750.00Food-Groceries 11,394.00Food-Restaurants 11,928.00Auto-Fuel and Repairs 2,964.00Total Annual Fixed Expenses 137,269.00Six Months of Expenses 68,634.50Three Months of Expenses 34,317.2514
RETIREMENT INCOME PLANNING15
Retirement Income AnalysisYou have mentioned that your expenses have been reduced due to both of your children beingout of the house now. Therefore, we based your retirement income need off of your currentexpenses.It is very common for your lifestyle to change throughout retirement. During the first phase ofyour retirement we expect you to maintain a similar lifestyle to your current one, and weexpect expenses to remain constant as well. During the second phase of retirement, our clientstend to slow down and reduce their activity. Typically, expenses are significantly reduced duringthis period as well. During the last phase of retirement, and the remainder of life, our clientstend to reduce activity and expenses even more as their lifestyle changes again.To reflect this trend in your financial plan, the first 10 years of your retirement show incomeneed to cover 100% of current expense, minus your mortgage and auto payments that will bepaid off before entering retirement, and your term life insurance and long term disabilityinsurance that will end at retirement as well. During the next 10 years, we show a reduction inexpenses of 15%, and for the remainder of your life expectancy, we show a reduction inexpenses of 30%. We have kept these percentages modest in order to avoid under estimatingneeded income.Our distribution recommendations are based on your income need and current goal of retiringat David’s age 65, at the beginning of 2025. In order to get the most out of your retirementbenefits and leave the largest amount to your heirs, we have the following recommendations:v Elect to receive David’s employer matching account as a single lump sum andimmediately rolling it over to an IRA on January 1, 2025; age 65v Apply, in writing, for David’s pension benefits to begin on January 1, 2025; age 65v Apply, in writing, for Ellie’s pension benefits to begin on January 1, 2025; age 64v Apply for David’s Social Security benefits to begin on January 1, 2030; age 70v Apply for Ellie’s Social Security benefits to begin on January 1, 2025; age 64Your retirement income will be coming from three main buckets: guaranteed income, qualifiedassets, and non-qualified assets. Guaranteed income consists of Social Security and pensionincome. Your qualified assets consist of Ellie’s 403(b) account, David’s 403(b) account, andDavid’s IRA. Non-qualified assets consist of your joint brokerage account. The guaranteedincome table shows all benefit amounts according to the age we recommend electing them at.Qualified and non-qualified assets are shown as their projected balance at retirement age,David age 65. David’s balances grow at a rate of 7.2530% according to the recommendedallocation on page 21, and Ellie’s grow at a rate of 5.3005% according to the recommendedallocation on page 20. The illustration on the next page details the buckets and their values.16
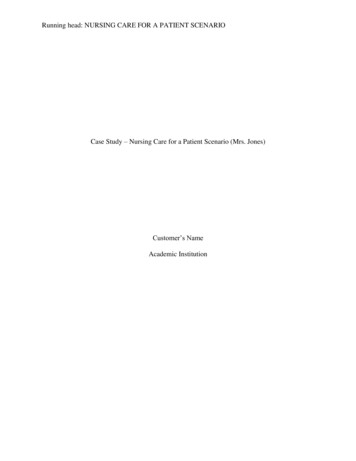
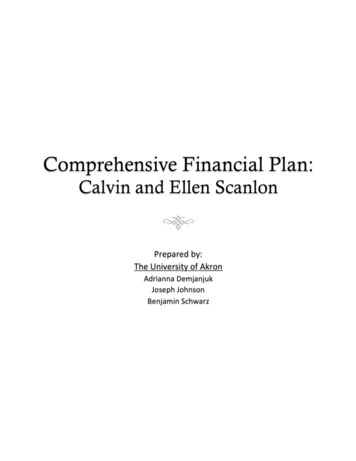
David's Social Security 42,504.00AnnuallyGuaranteed IncomeEllie's Social SecurityDavid's Pension Income 18,996.00 93,753.62AnnuallyAnnuallyDavid's 403(b) Account 722,493.50Qualified AssetsEllie's 403(b) Account 175,872.96Ellie's Pension Income 23,600.41AnnuallyDavid's Rollover IRA 49,469.57Non-Qualified AssetsJoint Brokerage Account 625,481.30The graph below illustrates all retirement income distributions. Once guaranteed income isapplied for, it will remain constant throughout retirement. In order to meet your gross incomeneed, we recommend supplementing your guaranteed income with qualified accountwithdrawals. Qualified accounts have required minimum distributions once the owner reachesage 70 ½ whereas your brokerage account has no withdrawal requirements. Also, when aqualified account is transferred at death, the beneficiary will be required to take distributions atan accelerated rate. According to our projections, we do not see a need to pull any incomefrom your joint brokerage account.v Therefore we recommend first pulling supplemental income from Ellie’s 403(b)until depletion, and then David’s rollover IRA until depletion. This way, by age 70½ only David’s 403(b) will require minimum distributions.Income Distribugon 350,000.00 300,000.00 250,000.00 200,000.00 150,000.00 100,000.00 50,000.00 0.00202520302035204020452050Ellie's PensionEllie's Social SecurityDavid's PensionDavid's Social SecurityEllie's 403(b) WithdrawalsDavid's IRA WithdrawalsDavid's 403(b) WithdrawalsGross Income Need205517
As shown in the graph on the previous page, a large portion of your retirement income iscoming from the guaranteed income bucket. Therefore, we do not recommend utilizing anannuity for retirement income. Annuities can be a good investment and protect against outliving your assets. However, they significantly decrease liquidity. We have projected your networth at life expectancy to be over 9,700,000.v With this number so high, we do not feel that outliving your assets is a large threatright now especially considering your high percentage of guaranteed incomecoming from your pensions and Social Security.18
INVESTMENT PLANNING19
403(b) Portfolio Allocation AnalysisWhile planning for retirement, it is important to position your investments to both preserveand grow you assets. One investment strategy we
Johns Hopkins 403(b) David 305,764.00 Johns Hopkins Matching Account 23,247.00 Johns Hopkins 403(b) Ellie 49,121.00 529 Plan 15,003.00 Total Qualified Assets 535,439.00 Personal Assets Personal Residence JTWROS 475,000.00 Vehicle 22,000.00 Furniture and Hou