Transcription
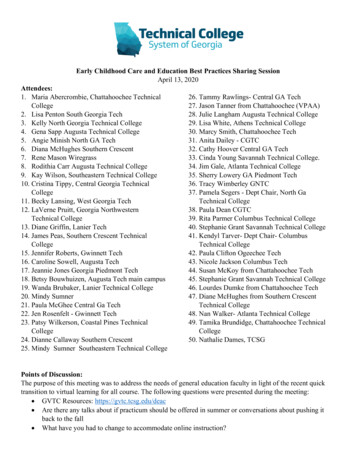
Childhood Lead Poisoning Prevention in PennsylvaniaThe Pennsylvania Department of Health has long supported lead prevention activities in thecommonwealth. The Wolf Administration is dedicated to ensuring safe and healthy homes and waterfor all Pennsylvanians.Nationally, among states with older houses, lead-based paint is a significant source of lead exposurein young children. According to the 2010 Census data, Pennsylvania ranks third in the nation for thenumber of housing units identified as having been built before 1950, when lead was most prevalent inpaint and plumbing.Since Pennsylvania does not have a universal testing law, there is no mandate for children notcovered by Medicaid to be tested for lead. The chart below includes a statewide summary of bloodlead tests performed in 2015.Children aged 0-23 monthsTotal number of children in PennsylvaniaTotal number of children tested 285,13279,265 (27.8%)The percentage of children tested in Pennsylvania for lead poisoning by county ranges from12 – 47% of children aged 0-23 months.For children, less than 2 years of age, the percentage tested for lead in 2015 was nearly28% of this age population.While the childhood lead testing data provides a snapshot of testing throughout Pennsylvania, thedepartment believes that limiting testing requirements to children covered by Medicaid only results insignificant limitations to understanding the prevalence of elevated lead levels across thecommonwealth. Limitations include: The total number of children in Pennsylvania who have elevated blood lead levels.The demographics and risk factors in Pennsylvania of children with elevated blood leadlevels.Why providers may or may not test children.The geographic regions where children with the highest and lowest rates of blood lead levelsreside.Steps ForwardIn order to address the gaps in childhood lead testing data and implement a comprehensive childhoodlead poisoning prevention strategy in Pennsylvania, the department is taking the followings steps: Continue to coordinate childhood lead poisoning prevention efforts with the departments ofEnvironmental Protection, Human Services, and Education. Update Pennsylvania’s policies on childhood lead testing. In the commonwealth, not allchildren are tested for lead exposure. Pennsylvania does not mandate universal testing andhealth care providers’ lead testing practices vary. Without universal lead testing,Pennsylvania’s ability to capture a comprehensive picture of the impact on children is limited.The department will work with the General Assembly to develop legislation to support1
universal lead testing in Pennsylvania, which will allow the department to understand who isat risk for lead poisoning and where children with the highest and lowest rates of blood leadlevels reside. This information will be crucial to implement an effective childhood leadpoisoning prevention strategy. Conduct a survey of Pennsylvania providers regarding attitudes and practices aroundchildhood lead testing. The results of the survey will inform the department’s education andoutreach efforts to ensure health care providers have accurate information about childhoodlead testing.2
3
2015 Childhood LeadSurveillance Annual Report4
TABLE OF CONTENTSItemPage(s)Executive Summary2Data Methods and Case Definition3Limitations6Definitions8Table 1: Summary of Blood Lead TestsPerformed in 2015, by Age Category9Table 2: Characteristics of Children Tested for Lead,by Age Category9Figure 1: Percent of Children Tested for Lead,by Age Category and Race11Table 3: Elevated Blood Lead Confirmation Statusper 2016 CDC Case Definition, by Age Category12Table 4: Details of Elevated Blood Lead ConfirmationStatus, by Age Category13Table 5: Confirmation After an Elevated CapillaryBlood Lead Test, by Capillary Test Level13Table 6: Blood Lead Reporting, by Method of Reportand Type of Reporting Organization14Table 7: Number of Children Tested for Lead by Maximum BloodLead Level and County of Residence, Children Aged 0–23 Months15Table 8: Number of Children Tested for Lead by Maximum BloodLead Level and County of Residence, Children Aged 0–71 Months18Table 9: Number of Children Aged 0–23 Months, by Countyof Residence and Elevated Blood Lead Confirmation Status21Table 10: Number of Children Aged 0–71 Months, by Countyof Residence and Elevated Blood Lead Confirmation Status24Table 11: Number of Children Aged 0–71 Months, by Urban/Rural Statusof County of Residence and Elevated Blood Lead Confirmation Status27Contact Information285
Executive SummaryThis is the Pennsylvania Department of Health’s (Department) ninth childhood leadsurveillance annual report, covering data for children tested in Pennsylvania during calendar year2015. Data was extracted from the Pennsylvania National Electronic Disease Surveillance System(PA-NEDSS), which is the Department’s disease reporting system. Although not legislativelymandated, the report is provided as a source of information for the public, federal, state and localagencies, as well as health care providers, and any organizations and individuals interested in leadpoisoning prevention in Pennsylvania. The report is an overview of lead testing in Pa. and providesinformation about testing for children under the age of 2, as well as under the age of 6 by: race;confirmation status; method of testing; method of reporting; county of residence; and if they live in arural county or an urban county.Exposure to lead, even at low levels, can cause intellectual, behavioral and academic deficits.For this reason, in 2012, the Centers for Disease Control and Prevention (CDC) defined an elevatedblood lead level (EBLL) as a blood lead level (BLL) 5 micrograms per deciliter (µg/dL). This value isalso used to identify children who require case management because, even at low levels, lead hasbeen known to affect IQ, the ability to pay attention and educational achievement.Thus, the 2015 report was compiled using a different methodology for data analysis fromprevious years’ reports. Because of the change in methodology, only state and county data areincluded in the report. Additionally, the report now presents data for a BLL reference value of 5 µg/dL.It is important to note that the data in this report cannot be compared to previous years’ reports due tothe change in methodology and must be considered independently.This report is used by the Department to identify areas that may be at high-risk for leadexposure; locate areas of potential under-testing; and make data available for state and local needsassessments. This report may also be used by federal agencies, hospitals, universities, providers andcounty/municipal health departments.Nationally, among states with older housing stock, lead-based paint is a significant source oflead exposure in young children. According to the 2010 Census data, Pennsylvania ranks third in thenation for having the most housing units identified as having been built before 1950, when lead wasmost prevalent. Other sources of lead exposure include toys, ceramics and other consumer products.Water, as a source of lead exposure, can also be considered problematic when it flows through olderlead plumbing and pipes or where lead solder has been used (which can occur in newer plumbing aswell).Lead poisoning is a preventable environmental health hazard and, if not addressed, affectsfamilies regardless of race, ethnicity or socioeconomic status. In recent years, there has been anational reduction in children’s BLLs, along with efforts to leverage resources more efficiently, causinga shift in 2013 from the Childhood Lead Poisoning Prevention Program (focused on casemanagement and lead abatement) to the Healthy Homes program (a holistic and comprehensiveapproach to preventing environmental exposures including lead exposure in the home). Leadabatement efforts were continued through the Lead Hazard Control Program, which provided fundingto local partners to contract with certified lead professionals to remove lead hazards. TheDepartment’s community health nurses (CHN) continued to monitor elevated lead levels ( 10µg/dL) inchildren ages 7 and under living in Pennsylvania. The CHNs contacted families to provide educationon laboratory results, sources of lead exposure and actions to take to prevent/decrease the risk ofexposure and help facilitate follow-up testing between client’s and their pediatricians. In cases where6
there was a significant lead exposure, CHNs worked with the pediatrician and facilitated referrals toobtain home inspections, which could identify the source of exposure as well as provide hands-oneducation to parents. CHNs also worked to provide referrals to the Pennsylvania SpecialSupplemental Nutrition Program for Women, Infants and Children and to early intervention whereappropriate. The Department also continued an ongoing collaboration with the Department of HumanServices on a data match project to share data between the Medicaid claims database and the leadsurveillance database. The data match will lead to improved quality lead data and better serviceprovision for Medicaid-enrolled children. The Department also staffed a toll-free Lead InformationLine, to provide information and referrals for concerned parents or professionals.The Wolf Administration and the Department are committed to preventing lead exposure and,by coordinating with state agencies, will work toward improving the outcomes of children throughoutthe commonwealth. This report is intended to provide information that is succinct, comprehensible andmore accessible to the public. Although lead surveillance should be considered an ongoing process,the goal of the report is to provide meaningful, useful and easy to access data to the commonwealthand its citizens, so that the data can be better utilized for decision-making, targeting of resources andimplementing initiatives aimed at preventing exposure to lead.Data Methods and Case DefinitionReporting of Test Results and Case InvestigationsIn Pennsylvania, clinical laboratories are required to report blood lead results on both venousand capillary specimens for persons under 16 years of age to the Pennsylvania Department of Health,Childhood Lead Poisoning Prevention Program, Division of Maternal and Child Health, Bureau ofFamily Health (28 Pa. Code § 27.34). In addition, clinicians are required to report cases of leadpoisoning (28 Pa. Code § 27.21a). Reports are submitted electronically (either through electroniclaboratory reporting or online key entry) to the Department through Pennsylvania’s electronicreportable disease surveillance system, PA-NEDSS. In 2015, reports with a BLL 10 μg/dL wereassigned to public health investigators for follow-up based on the location of the patients’ residence.Investigators reviewed, verified and corrected, when necessary, critical pieces of information such asdate of birth, address and specimen source.It is quite common for different entities to report the same BLL test result. For example, theordering provider and the lab performing the analysis may both report a test. The Department doesnot discourage reporting from multiple sources, as it maximizes the likelihood that reporting will occur.In addition, different reporters often have different information about the patient — for instance, onemay know more details about the specimen source and another may have better address information.PA-NEDSS is designed to handle duplicate reports from different sources. Several strategies areused in PA-NEDSS to ensure that all reports pertaining to a single patient are assigned to a singlepatient identifier. For the purposes of this annual report, tests with identical specimen collection datesand identical blood lead level results from the same patient were considered as a single test. The totalnumber of blood lead tests was defined as the total number of de-duplicated blood tests obtained fromchildren within the specified age categories. All blood lead tests were included, including thosecollected for screening, confirmation or follow-up purposes. Since many children had more than oneBLL test during the year, the total number of children tested is less than the total number of blood leadtests performed. Per-child summary BLL measures were calculated using all BLL results obtainedwhile the child was in the given age category.Case Definition7
In May 2012, the CDC accepted the recommendation from the Advisory Committee on LeadPoisoning Prevention to eliminate the term “level of concern” (associated with the level of 10 μg/dL)and to begin using a reference value of 5 μg/dL based on the 97.5 percentile of the blood leaddistribution among U.S. children. Although the new case definition was not officially implemented byCDC until 2016, for consistency with other state analyses, this report uses the 2016 case definition toidentify children with confirmed elevated blood lead. Therefore, a confirmed elevated BLL is definedas a venous blood lead test 5 μg/dL, or two capillary blood lead tests 5 μg/dL drawn within 84 days(12 weeks) of each other. An unconfirmed elevated BLL is defined as a capillary blood lead test 5μg/dL with no other blood lead test done in the next 84 days.To apply the CDC case definition, a number of different data elements need to be evaluated.These data elements were handled as follows in our analyses:ooooIf specimen collection date was missing or illogical, the laboratory received date orresult date was used instead. If all three were missing, the reported date was used.Specimens with unknown specimen source or characterized as simply “blood” (asopposed to venous or capillary) were treated as if they were capillary specimens. Incases where a test result was reported by different entities as coming from both acapillary and venous specimen, case records were reviewed to determine the properspecimen source.Tests with undetectable blood lead levels were either reported as below a numericdetection limit or with a qualitative result of “negative,” “not detected” or “normal.” Forstatistical purposes, these results were given a numeric BLL value of 0.1 μg/dL.If an elevated capillary test was obtained on a child near the end of 2015 or as the childneared the limit of a particular age category, and if another elevated test result wasobtained within the next 84 days, the initial elevated test was considered to beconfirmed, even if the confirmatory test occurred in 2016 or outside of the agecategory. For example, if a child had an elevated capillary test at 23 months of age inNovember 2015 and received a confirmatory follow-up test within 12 weeks (in 2016),this was considered an elevated BLL result in 2015 for a child “aged 0-23 months.”For children who had multiple BLL tests performed, it was possible for them to qualify for morethan one case definition category (for example, they may have had an unconfirmed elevated test andthen six months later had another elevated test that was confirmed). In these situations, a child wasassigned to the highest BLL case definition category for which they qualified.Statistical MethodsAll BLL test data obtained on children less than 16 years of age in 2015 was extracted fromthe PA-NEDSS database. Analyses were performed on a per-test or per-child basis as indicated inthe tables below.Most of the analyses in this report are limited to children in two overlapping age categories,under 2 years of age (i.e., 0–23 months) and under 6 years of age (0–71 months). Age was definedas age at the time of the specimen collection date.Childhood lead race and sex data in PA-NEDSS is obtained primarily from laboratory reports.Although nearly all labs can report sex information, race information is not routinely collected or storedby most laboratories. For these analyses, when possible, children were categorized as either AfricanAmerican, Asian, white, or other (which included multiracial children, American Indians, and PacificIslanders). However, given that race is unknown for almost 60 percent of children, the race tables and8
figures should be interpreted with caution, and inferences regarding the implications of thepercentages presented in this report cannot be generalized.For the per-child analyses, two measures were used to indicate their BLL status: The maximum BLL was defined as the highest venous BLL obtained from a child in2015 while they were in the specified age category. If a child had no venous BLL testperformed during that time period, maximum BLL was defined as the highest BLL froma capillary or unknown specimen source. Venous results were ranked over capillaryresults because capillary test results may be skewed by the presence of lead dust onthe skin.Elevated blood lead confirmation status was determined as described in the casedefinition section above.For county-specific analyses, the residential address accompanying the report that containedthe BLL result of interest was used to determine the county. For the maximum BLL measure, thecounty was determined from the report containing the maximum test result. For the elevated bloodlead confirmation status measure, county was determined from the address accompanying the initialelevated BLL. PA-NEDSS attempts to geocode all residential addresses. For addresses that weresuccessfully verified, county was based on the actual home address. If an address was not able to beverified, the county was based on the centroid of the residential zip code. A small proportion ofchildren did not have a residential address reported (approximately 3 percent, depending on themeasure and age category). In these instances, when possible, the county was set by the location ofthe provider who ordered the test.Intercensal population estimates for 2015 by county and age were provided by thePennsylvania Department of Health, Division of Health Informatics. These figures were used tocalculate the proportion of children tested for blood lead, and the proportion of children with elevatedlead levels.Differences from Previous Annual ReportsThe methodology used to create the 2015 Childhood Lead Annual Surveillance report differsfrom previous reports. Therefore, the data generated for the 2015 report cannot be compared toprevious years’ data, and trend analyses are not presented.The Department reviewed annual childhood blood lead reports from other states, as well asCDC online data and reports, to design a report which provides the best data available to assess theburden of elevated childhood blood lead. Age categories used in this report differ from prior years andwere based on our review of best practices in reporting. Analyses below the county level wereremoved from the report, given the small numbers of children with elevated blood lead in manycounties and the lack of mandated universal testing (the proportion of children tested was less than 30percent overall, and below this percentage in many counties). Without universal testing, the number ofchildren tested and the characteristics of children tested are dependent upon provider practices,access to testing and parental preferences. Current testing patterns do not allow for an unbiasedestimate of the prevalence of children with elevated blood lead levels and assessment of burden atthe local level.In addition, calculation of the geometric mean for BLLs was dropped, given that the value ofthe geometric mean is strongly dependent upon the arbitrary value the Department would use torepresent negative or undetected BLLs (those results sent to us as negative but without a numericvalue). BLL distribution frequencies are presented instead.9
Finally, the Department undertook a detailed review of data entry and electronic laboratoryreporting of BLL test results from 2015. Thousands of records were discovered to have miscoded ormisplaced information which could be recaptured with custom computer algorithms and/or individualreview and recoding. Records with these types of
The chart below includes a statewide summary of blood lead tests performed in 2015. Children aged 0-23 months Total number of children in Pennsylvania 285,132 Total number of children tested 79,265 (27.8%) . For example, the ordering provider and the lab performing