Transcription
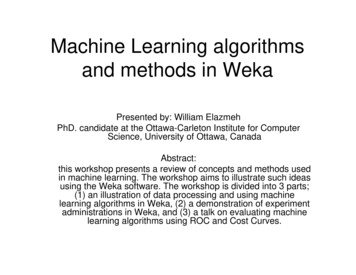
Machine Learning algorithmsand methods in WekaPresented by: William ElazmehPhD. candidate at the Ottawa-Carleton Institute for ComputerScience, University of Ottawa, CanadaAbstract:this workshop presents a review of concepts and methods usedin machine learning. The workshop aims to illustrate such ideasusing the Weka software. The workshop is divided into 3 parts;(1) an illustration of data processing and using machinelearning algorithms in Weka, (2) a demonstration of experimentadministrations in Weka, and (3) a talk on evaluating machinelearning algorithms using ROC and Cost Curves.
Machine learning/data mining software written in Java(distributed under the GNU Public License) Used for research, education, and applications Complements “Data Mining” by Witten & FrankMain features: Data pre-processing tools Learning algorithms evaluation methods Graphical user interfaces An environment experimentingWEKA is a Machine Learning Toolkit that consists of: The Explorer Classification and Regression Clustering Finding Associations Attribute Selection Data Visualization The Experimenter The Knowledge Flow GUINote: the content of this presentation is based on a Weka presentation prepared by EibeFrank at the Department of Computer Science, University of Waikato, New Zealand
The ARFF Flat File FormatclassNominal attributeNumeric attributeData records
Command line console
Weka Explorer
Weka Experimenter
Weka KnowledgeFlow Designer
Weka ARFF Viewer
Weka Log Viewer
Part I: data processing and usingmachine learning algorithms inWeka
Explorer: pre-processing the data Data can be imported from a file in variousformats: ARFF, CSV, C4.5, binary Data can also be read from a URL or from anSQL database (using JDBC) Pre-processing tools in WEKA are called “filters” WEKA contains filters for:Discretization, normalization, resampling, attributeselection, transforming and combining attributes,
Preprocessing
Data Visualization
Data Filtering
Explorer: building “classifiers” Classifiers in WEKA are models for predictingnominal or numeric quantities Implemented learning schemes include:– Decision trees and lists, instance-basedclassifiers, support vector machines, multi-layerperceptrons, logistic regression, Bayes’ nets, “Meta”-classifiers include:– Bagging, boosting, stacking, error-correctingoutput codes, locally weighted learning,
Classification
Explorer: clustering data WEKA contains “clusterers” for finding groupsof similar instances in a dataset Implemented schemes are:– k-Means, EM, Cobweb, X-means, FarthestFirst Clusters can be visualized and compared to“true” clusters (if given) Evaluation based on loglikelihood if clusteringscheme produces a probability distribution
Clustering
Explorer: finding associations WEKA contains an implementation of the Apriorialgorithm for learning association rules– Works only with discrete data Can identify statistical dependencies betweengroups of attributes:– milk, butter bread, eggs (with confidence 0.9and support 2000) Apriori can compute all rules that have a givenminimum support and exceed a given confidence
Finding Associations
Explorer: attribute selection Panel that can be used to investigate which (subsetsof) attributes are the most predictive ones Attribute selection methods contain two parts:– A search method: best-first, forward selection,random, exhaustive, genetic algorithm, ranking– An evaluation method: correlation-based,wrapper, information gain, chi-squared, Very flexible: WEKA allows (almost) arbitrarycombinations of these two
Attribute Selection
Explorer: data visualization Visualization very useful in practice: e.g. helps todetermine difficulty of the learning problem WEKA can visualize single attributes (1-d) and pairsof attributes (2-d)– To do: rotating 3-d visualizations (Xgobi-style) Color-coded class values “Jitter” option to deal with nominal attributes (and todetect “hidden” data points) “Zoom-in” function
Data Visualization
Part II: experimentadministrations in Weka
Performing experiments Experimenter makes it easy to compare theperformance of different learning schemes For classification and regression problems Results can be written into file or database Evaluation options: cross-validation, learning curve,hold-out Can also iterate over different parameter settings Significance-testing built in!
Weka Experimenter
The Knowledge Flow GUI New graphical user interface for WEKA Java-Beans-based interface for setting up andrunning machine learning experiments Data sources, classifiers, etc. are beans and can beconnected graphically Data “flows” through components: e.g.,“data source” - “filter” - “classifier” - “evaluator” Layouts can be saved and loaded again later
Weka KnowledgeFlow Designer
Finally!WEKA is available athttp://www.cs.waikato.ac.nz/ml/wekaAlso has a list of projects based on WEKAWEKA contributors:Abdelaziz Mahoui, Alexander K. Seewald, Ashraf M. Kibriya, BernhardPfahringer , Brent Martin, Peter Flach, Eibe Frank ,Gabi Schmidberger,Ian H. Witten , J. Lindgren, Janice Boughton, Jason Wells, Len Trigg,Lucio de Souza Coelho, Malcolm Ware, Mark Hall ,Remco Bouckaert ,Richard Kirkby, Shane Butler, Shane Legg, Stuart Inglis, Sylvain Roy, TonyVoyle, Xin Xu, Yong Wang, Zhihai Wang
Part III: evaluating machinelearning algorithms using ROCand Cost Curves
Introduction to ROC Curves (Drummond et. al.) The focus is on visualization of classifier’s performance ROC curves show the tradeoff between false positive and true positive rates We want to know when and by how much a classifieroutperforms another The analysis is restricted to a two class classifier
Introduction to Cost Curves (Drummond et al.) The focus is on visualization of classifier’s performance ROC curves show the tradeoff between false positive and true positive rates We want to know when and by how much a classifieroutperforms another The analysis is restricted to a two class classifier
Cost Curves (Drummond et al. 2004) Given a specific misclassification cost and class probabilities, what is theexpected cost of classification? For what misclassification costs and class probabilities does a classifier outperform the trivial classifiers? For what misclassification costs and class probabilities does a classifier outperform another? What is the difference in performance between two classifiers? What is the average performance of several independent classifiers? What is the 90% confidence interval for a particular classifier’sperformance? What is the significance of the difference between the performances of twoclassifiers?
ROC Space
GeneratingROCcurves
ROC curves
Cost Space
Cost Curves
Machine Learning algorithms and methods in Weka Presented by: William Elazmeh PhD. candidate at the Ottawa-Carleton Institute for Computer Science, University of Ottawa, Canada Abstract: this workshop presents a review of concepts and methods used in machine learning. The worksh