Transcription
The Basic Principle for TradingStocks:The Power and the Profit of the S-CurvebyRobert C. JoinerCopyright 2008 by GapDownProfitsNo part of this book may be copied, sold, or redistributedwithout the author's written consent.
The Basic Principle for TradingStocks:The Power and the Profit of the S-CurvebyRobert C. JoinerI have a confession to make. I was in my early 50's before I traded my firststock.After earning nearly one million dollars, by working in a variety of careers,I had little to show for it. I was upside down on my house and my car. I had moredebt than I care to admit. And the only thing I knew about the stock market wasthe small amount I had stuck away in a 401K.Sad, isn't it? After 1,000,000, you'd think I'd have something to show forit.
The reality, however, is that most of you reading this small book are in thesame position as me, or you are headed in that same direction. Why? Becauseeach of us failed to realize that our greatest asset was the cash flowing through ourhands and into the pockets of everyone else. That cash, had we been able to stopit just for a little while before it left our hands, would have enabled us to create astream of cash flow that would have provided for us handily. But, we didn't know.I didn't know. I kept working, paying the bills, and struggling to get the cash inhand so all of the required payments wouldn't be late.When I first started trading stocks, I didn't know anything about WallStreet. NASDAQ, ask, bid, brokers, stop loss - these were words I had heard, butI didn't know their importance. So, I dug in. I wasn't interested in a long term"buy-and-hold" approach. That works fine for some people. But I wanted tocreate immediate cash flow. I needed extra money.My education began with a simple realization: stock prices go up andstock prices go down. Now, this may not seem much of an epiphany for you. ButI never realized exactly how much prices go up and go down. It's somethingcalled volatility. And some people think it's a bad thing. An individual stock mightchange between 2% and 20% in a single day! Such volatility can make you graybefore you're old - unless you understand the patterns within that volatility andhow the very thing that others fear can actually make you wealthy.If you lay the letter "S" on its side, then you can see an example of a typicalstock. It starts high, goes low, climbs again, and then falls again. Now, everystock doesn't do this every single day. And some stocks do it more often thanothers. But, the way I'm thinking here. why buy and hold a stock for weeks oryears, only to see the price go up and down like this over and over again? Whynot simply buy it at the low point and sell it at the high point, and do this over andover again?Well, this is the basic idea behind trading stocks. Rather than guessing onwhich stocks are going to go up in price over years or even decades, I look atsomething called technical indicators. It's not all that technical, actually. But theseindicators help guide me to the stocks that are getting ready to go up or down inprice. Once I've spotted those stocks, I buy them. I hold them for 20 minutes. Ihold them for 4 hours. It all depends on what the indicators tell me. But I buythem when the price is low and I sell them when the price is high and I stick themoney back into my account.
That earned money is now added to my trading account, giving me moremoney than I had earlier. With more money to trade, I can buy more shares. Itake a new stock and buy it at the bottom of the S-curve and sell it at the top ofthe S-curve. And I stick this money back into my account.I repeat this process again and again. The longer I can hold onto thisearned money and trade with this higher amount, the more money I am able toearn. Eventually, however, I take some money out and pay a few bills. And then Igo and repeat the process again.Now, if the idea of making money out of money seems like a good idea toyou, then I'd encourage you to keep reading. I'll answer some of your questionsand address some of the doubts that are already running through your mind.But first, I want to tell you about a certain type of stock that I focus upon.It's called a Gap. You see, one of the things I learned about trading stocks (thehard way), is that you must have a system for trading stocks. And you must find astrategy that's comfortable for you. I have a lot of profit with Gap stocks, so Ihave focused on them for the past year - studying thousands of gap stocks andtrading hundreds of them.In case you've never heard of a Gap stock, let me explain it. A Gap occurswhenever a stock opens at a price far lower than the previous day's closing price(this is called a gap down), or opens at a price far higher than the previous day'sclosing price (this is called a gap up). Of the stocks traded every day on WallStreet, these Gap stocks are some of the most volatile stocks traded. Therefore, Iactually seek out these stocks each morning because I know that their volatility isfertile ground for making short-term cash.Last time I checked, making money was the primary reason why anyonegets involved in buying and selling stocks. The difference is the time perspectiveand the amount of direct involvement you seek to have with that involvement. Ifyou want to just write a check and have your money grouped together with tens ofthousands of other investors, allowing someone else to make your investmentdecisions for you, and earning you less than 10 % annual interest on that money,then the lessons in this book are not for you.But, some of you are willing to study and practice the art of trading stocksin the hopes of earning higher gains. This book will introduce you to somepowerful information. In fact, it will teach you the central, most basic strategy ofall stock investing, and give you the technical knowledge to make that strategy
work for you.People have different ways of earning money. Some people will go andspend a ton of money to buy a franchise or they will struggle to start a business.They will go through the hassle of hiring, training, and firing new employees.They will do all of this (and much more) to try and create a stream of cash tosupport their lives. Yet they know nothing about the simple power of the "Scurve" to multiply their wealth without employees or advertising or the start-upcosts associated with any new venture. (I know this because I've started a fewmyself.)So what is it? Fear? Low self-esteem? What keeps people from tradingstocks and making money out of money?Overall, most peole are simply ignorant of the stock market. Our limitedknowledge of the stock market is wrapped up in 3 numbers and a letter - 401K.We put our money into the market and we hold and we hold and we hope that inthe end we'll have enough for our retirement. We are told to be happy with annualROI (Return on Investment) rates of 8% - that's a whole year to earn what canhappen in just one week!But some people are a little more adventurous. They think that makingmoney in the stock market involves getting inside information about an up-andcoming new company. They might also believe that the stock market is like a giantdart board where it's either hit or miss. Still others believe it's like a large casino,where luck rules the day.Well, I'm happy to inform you that none of these statements is true. Iguess you could approach the stock market in that way. And you would end upbeing an outsider who never hits a bull's eye and who is very unlucky.Rather than luck or inside information, what you need in order to tradestocks is a narrow focus. You could take one stock and trade that stock over andover, using the patterns I teach in this book to earn your daily living. I knowpeople who do this. Or, you can learn a system that shows a repeating patternamong the technical indicators, and use that system to trade a more diverse groupof stocks. This is what I do.But, what you cannot do (if you want to make any money) is to tradestocks without a narrow focus and without a proven, repeatable pattern. Youneed a system that has a proven track record. And you need someone to teach youhow to trade that repeatable pattern. Then you simply practice it until you know it
well enough to make money at it. And the more you practice it, like anything else,the better (more profitable) you become at it.Good luck finding a patient teacher. Your local broker is not going to giveyou tudoring lessons on how to trade in the stock market. Most of them don'teven know the things that I've figured out on my own. They take the longer "buyand-hold" approach. And, as I've said, that works fine for some folks. But "buyand-hold" will never produce the kind of results that I have seen. And that's whythe short-term play is my stock play of choice.But enough of a preamble. I want to show you an example of the kind ofstock play I like. It's called a Gap. As I said, this type of stock has been my focusnow for quite some time. The reasons are many. But the primary reasons are two:(1) a Gap produces a repeatable pattern that we can recognize, and (2) a Gap is bynature a volatile stock with a high degree of same-day fluctuation. Put thosetogether and we have a stock with a big movement in price that we can recognizeas the "S-curve" and therefore we can profit when we buy it low and sell it high.So let's go ahead and look at one now.
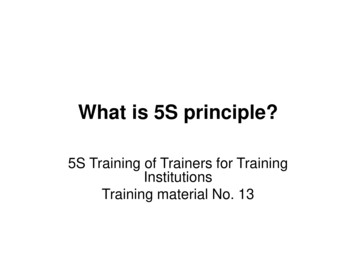
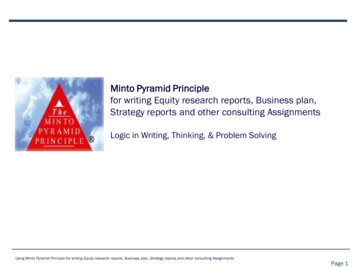
Chart # 1The first thing I want you to see is the S-curve we've been discussing. Ifyou turn this page sideways, then you'll see a series of curves that closely resemblethe letter S. The S can be seen in the actual price of the stock and in the MACD
indicator at the bottom of the chart. (No, it's not a perfectly shaped S. But, youget the idea. It has curves that fluctuate up and down, sort of like a roller-coaster.It has high points and it has low points.)Let me explain what you are looking at. This chart shows the stock symbolSTV (see the symbol in the upper left hand of the chart). The chart covers a sixday period in the life of this stock. The chart reads from left to right, so the dateof 3-28-08 is the most recent date on the chart and it is shown on the far rightcolumn.The chart is broken down further by five main horizontal blocks. On thetop block, the price "candles" are shown. On the far right side of the chart, youcan see the price of the stock. By aligning the candles with the prices, you can seethat the price fluctuated from a low of 17.81 on the first day of the chart (far leftcolumn) to a high of 19.86 on the sixth day. That's a price change of 11 %. Onthe bottom right, you can see the time signatures when this price change occured.Now, an 11 % ROI is pretty impressive over a six-day period in the stockmarket. If you had made this play, then you would have been pretty proud ofyourself.But, the fact is that over just the last four days of this stock, there were sixobvious trading points. These six plays, had you traded them, would have nettedyou a ROI of over 30% during a four-day period.What does this mean to you? Simple. If you had 3000 of your ownmoney plus 3000 in a margin account at your broker, giving you a total of 6000with which to trade, then you would have earned 1800 in four days.And the funny thing is this - this pattern repeats itself day after day in thestock market. Based on the research I do each morning, these stocks come acrossmy desk. I then wait for the patterns to develop and I buy low and I sell high. Or,as in the above example, I also sell high and buy low (more about this later).It is almost this simple. Do the research. Recognize the pattern. Buy atthe bottom of the "S-curve". Sell at the top of the "S-curve". Rinse and repeat.The key question I have for you is this: is this something that is interestingto you? And I ask this for one obvious reason - everyone doesn't "get it". Theydon't see the potential or they simply are not interested. They'd rather do the gruntwork that their particular job requires and then go home and "chill". They're notmotivated toward making more money out of money. They are content. And
that's okay.But, for some of you, you get it. You see the potential. You recognize thepattern. And you want to know more.For those who want to chill, just file this book away somewhere. If youever get the urge to make more money, then pull it out and keep reading.Consider the fact that you only spent a few dollars to get a quick education onchart patterns.But for those folks who see the pattern and want to know more, you areinvited to keep reading.Your first question, of course: "Is it always this easy?" No.Second question: "Can you loose money?" Yes.Any more questions?You see, in order to become a successful trader, you need to get educated.You may not even have a brokerage account set up yet. Maybe you've nevertraded a stock in your life. You may not know the first thing about where to start.And if you just jump right in then you will probably lose your shirt. It would bekind of like giving a high school kid a hockey stick and sending him into the NHL.Yes, he knows how to swing the stick. He may even understand a few of therules. But, without extensive training and coaching, he will get clobbered andnever want to play the sport again.The key thing is this: you must trade a repeatable pattern of a certain typeof stock in order to increase your odds. You cannot just jump on every train thatpasses by. You have to be selective on the stocks you buy and when you buythem. But the good news is that you can figure this out. More than that, you canwatch me trade these sorts of stocks. You can even copy my trades, do what I do,and make money by just copying my trades.To me, it's kind of like learning to ride a bike. First, you see someoneriding a bike and you think "Oh, that looks like fun. Look how fast you can go. Iwant the wind in my face too." And then you start with training wheels, fourwheels instead of two, to give yourself a sense of balance along with
Rather than luck or inside information, what you need in order to trade stocks is a narrow focus. You could take one stock and trade that stock over and over, using the patterns I teach in this book to earn your daily living. I know people who do this. Or, you can learn a system that shows a repeating pattern among the technical indicators, and use that system to trade a more diverse group of .