Transcription
Mission Statement:ToMissioncreateand grow sustainable value by applying leading, technicallyStatement : To create and grow sustainable value by applying leading, technicallyexcellentanddifferentiatedto managingmining assets andexcellent anddifferentiatedapproaches to approachesmanaging mining assetsand unlocking theirunlockingtheir mitted tounrealized potential,being firmly committedto protectingthe dthecommunitiesinwhichwework.protecting the health, safety and wellbeing of our employees, theenvironment and the communities in which we work.Suite 3083 – 595 Burrard St. 1 (604) 558-1107Suite 3083 - 595 Burrard St. 1 (604) nc.comVancouver, BC, Canada V7X 1L3info@artemisgoldinc.comJune 2021Disciplined Development of theBlackwater Gold Project in BCTSX-V: ARTG artemisgoldinc.com
Forward Looking & Cautionary StatementsThis presentation contains certain "forward looking statements" and certain "forward-looking information" as defined under applicable Canadian and U.S. securities laws (together, “forward-looking statements”). Forward-looking statements cangenerally be identified by the use of forward-looking terminology such as "may", "will", "expect", "intend", "estimate", "anticipate", "believe", "continue", "plans", "potential" or similar terminology. Forward-looking statements in this presentationinclude, but are not limited to, statements and information related to the results of the Company’s 2020 Pre-Feasibility Study (based on a technical report entitled “Blackwater Gold Project British Columbia – NI 43-101 Technical Report on PreFeasibility Study” with an effective date of August 26, 2020, available on SEDAR and the Company’s website) (“2020 PFS”); estimates of mineral reserves and mineral resources; the Blackwater Gold Project (“Blackwater”, or the “Project”)development and mining plans; commencement of a Feasibility Study; engagement and negotiations with Indigenous nations; completing supplemental geotechnical and hydrogeological site investigation work; progressing and achieving finalpermitting; commencement of drilling and exploration programs; awarding lump-sum fixed price EPC contracts for the construction of the Project; arranging debt and equity financings to support development activities; the merits of the Project; theCompany’s plans and objectives with respect to the Project and the timing related thereto, including with respect to permitting, construction, improved economics and financeability, and de-risking development risks; and other statements regardingfuture plans, expectations, guidance, projections, objectives, estimates and forecasts, as well as statements as to management's expectations with respect to such matters.Forward-looking statements and information are not historical facts and are made as of the date of this presentation. These forward-looking statements involve numerous risks and uncertainties and actual results may vary. Important factors that maycause actual results to vary include without limitation, risks related to the ability of the Company to accomplish its plans and objectives with respect to the 2020 PFS and the Project within the expected timing or at all, including the ability of theCompany to improve the economics and financeability and de-risk the Project; the timing and receipt of certain approvals, changes in commodity and power prices, changes in interest and currency exchange rates, risks inherent in explorationestimates and results, timing and success, inaccurate geological, mining, and metallurgical assumptions (including with respect to the size, grade and recoverability of mineral reserves and resources), changes in development or mining plans due tochanges in logistical, technical or other factors, unanticipated operational difficulties (including failure of plant, equipment or processes to operate in accordance with specifications, cost escalation, unavailability of materials, equipment and thirdparty contractors, delays in the receipt of government approvals, industrial disturbances or other job action, and unanticipated events related to health, safety and environmental matters), political risk, social unrest, and changes in generaleconomic conditions or conditions in the financial markets. In making the forward-looking statements in this presentation, the Company has applied several material assumptions, including without limitation, the assumptions that: (1) marketfundamentals will result in sustained mineral demand and prices; (2) the receipt of any necessary approvals and consents in connection with the development of any properties; (3) the availability of financing on suitable terms for the development,construction and continued operation of any mineral properties; and (4) sustained commodity prices such that any properties put into operation remain economically viable. The actual results or performance by the Company could differ materiallyfrom those expressed in, or implied by, any forward-looking statements relating to those matters. Accordingly, no assurances can be given that any of the events anticipated by the forward-looking statements will transpire or occur, or if any of themdo so, what impact they will have on the 2020 PFS, results of operations or financial condition of the Company. Except as required by law, the Company is under no obligation, and expressly disclaim any obligation, to update, alter or otherwise reviseany forward-looking statement, whether written or oral, that may be made from time to time, whether as a result of new information, future events or otherwise, except as may be required under applicable securities laws.Non-IFRS Performance Measures: The Company has included certain non-IFRS measures in this presentation. The company believes that these measures, in addition to conventional measures prepared in accordance with IFRS, provide investors animproved ability to evaluate the underlying performance of the Project. The non-IFRS measures are intended to provide additional information and should not be considered in isolation or as a substitute for measures of performance prepared inaccordance with IFRS. These measures do not have any standardized meaning prescribed under IFRS and therefore may not be comparable with other issuers.Cash Costs: Cash costs are a common financial performance measure in the gold mining industry but with no standard meaning under IFRS. Artemis considers and discloses cash costs on a sales basis. The Company believes that, in addition toconventional measures prepared in accordance with IFRS, such as sales, certain investors use this information to evaluate the Project’s performance and ability to generate operating earnings and cash flow from its mining operations. Managementuses this metric as an important tool to monitor cost performance. Cash costs include production costs such as mining, processing, refining and site administration, less non-cash share-based compensation, less gross revenue generated from silversales, divided by gold ounces sold to arrive at cash costs per gold ounce sold. Cash Costs include royalty payments and permitting costs. Other companies may calculate this measure differently.All-in Sustaining Costs (“AISC”): The Company believes that AISC more fully defines the total costs associated with producing gold. The Company typically calculates all-in sustaining costs as the sum of cash costs (as described above), corporategeneral and administrative expense (net of stock-based compensation), reclamation and sustaining capital, all divided by the gold ounces sold to arrive at a per ounce figure. Other companies may calculate this measure differently as a result ofdifferences in underlying principles and policies applied. Differences may also arise due to a different definition of sustaining versus growth capital.Free Cash Flow (“FCF”): Free cash flow is a common financial performance measure in the gold mining industry but with no standard meaning under IFRS. Artemis considers and discloses FCF as the net operating cash flow net of deductions forsustaining capital, closing costs and cash taxes payable. Artemis does not deduct growth or expansion capital in its measure of FCF. Other companies may calculate this measure differently.Note that in respect of AISC metrics within the 2020 PFS, as such economics are disclosed at the project level, corporate general and administrative expenses are not included in the AISC calculations.Alastair Tiver, VP Projects for Artemis is a Qualified Person as defined by National Instrument 43‐101 and he has reviewed and approved of the scientific and technical information related to the Blackwater project contained in slides 3,4,6, and 11.Klaus Popelka, P. Geo., Manager Resource Geology for Artemis is a Qualified Person as defined by National Instrument 43‐101 and has reviewed and approved the scientific and technical information related to the Blackwater project contained in allother slides.For further information regarding the 2020 PFS, including data verification and the mineral resources and mineral reserves, please refer to the Company’s news release dated August 26, 2020 or the 2020 PFS Technical Report.TSX Venture: ARTGwww.artemisgoldinc.com2
Why Invest in Artemis Gold? Proven Track Record of Execution and Value Creation: Same team that founded, developed, operated and sold Atlantic Gold Board and Management Alignment with Shareholders: Board/Management own 41% of the fully diluted sharesInvested 138M in the company over the last two years Blackwater Gold Project (100%, BC, Canada): One of the largest gold projects in CanadaReserves1: 8 Million ounces of goldM&I Resources2: 11.7 M ounces of gold Steadily Derisking Blackwater Catalyst by Catalyst 204M cash position: Derisks project equity financing requirementsCredit Approved Term Sheet 360M Project Loan Facility3: 60% of project financing requirementsProcess Plant GMP4: Insulates 40% of total initial capital costs from cost and schedule overrunsGrade Control Drilling Results5: Significantly improved confidence in high-grade starter zonePermitting Progress: On track to receive all permits to start construction in Q2 20221Referto Appendix II: Mineral Reserve Estimate for Blackwaterto Appendix I: Mineral Resource Estimate for Blackwater3Refer to News Release Dated April 9, 2021 “Artemis Gold Executes Credit Approved Term Sheet and Mandate for 360 Million Project Debt Financing to Develop Blackwater”4Refer to News Release Dated March 29, 2021 “Artemis Awards GMP (Guaranteed Maximum Price) on Blackwater Process Plant”5Refer to News Release Dated May 4, 2021 “Artemis Provides Interim Results of Grade Control Drilling of High-grade Near Surface Mineralization”2ReferTSX Venture: ARTGwww.artemisgoldinc.com3
Why Invest in Artemis Gold (continued) 3-Stage Development Unlocks Value: 2020 PFS Initial Development Capital: 592MPayback Period: 2 yearsLevered1 after-tax IRR: 50%After-tax NPV (5%): C 2.2bn (US 1541 gold price, 0.76 US :CAD F/X)Economics include the impact of the gold stream granted to New Gold Leverage to an 8 million ounce gold reserve2, but with downside protection: Base Case - US 1,541/oz Gold: NPV (5%) C 2.2bn, levered1 After-Tax IRR of 50%Upside Case – US 1,800/oz Gold: NPV (5%) increases to C 3.1bn, levered1 After-Tax IRR of 61%Downside Case – US 1,300/oz Gold: NPV (5%) is still C 1.5bn, levered1 After-Tax IRR of 38%Good Timing: Sector is starved for growth and flush with free cash flow Producers have a flat to declining growth profile (Source: BMO) Top 10 gold producers forecast to generate US 81 B in free cash flow from 2021-2024 (US 1,850/ozgold, Source: BMO) Blackwater is a scarce Tier 1 gold project Artemis is trading at a discounted valuation: Trading at 0.47x P/NAV compared with the peer group average of 0.54x P/NAV (Source: BMO) Significant revaluation potential as the Company de-risks Blackwater and advances it to productionNote: PFS Pre-Feasibility Study, NPV Net Present Value, IRR Internal Rate of Return, All amounts are in Canadian Dollars unless otherwise noted1Refer2Referto News Release Dated August 26, 2020 “Artemis Announces Revised PFS for Blackwater Project” for Levered scenario assumptionsto Appendix II: Mineral Reserve Estimate for BlackwaterTSX Venture: ARTGwww.artemisgoldinc.com4
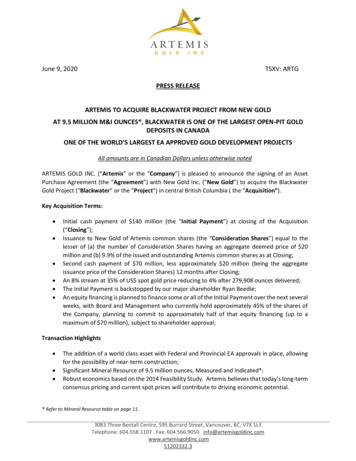
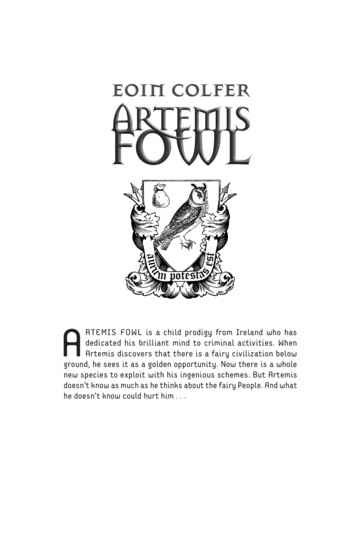
Value Creation Through Derisking and ExecutionAtlantic Gold (2014 - 2019) Acquisition to Production in 3 years 1,129% return to shareholders GDXJ Index down 29% during the same periodArtemis Gold (2020 -) Acquired Blackwater in August 2020 Targeting all permits by end of Q1 2022 Targeting start of construction in Q2 2022 Targeting production in 2024TSX Venture: ARTGwww.artemisgoldinc.com5
Derisking Blackwater One Catalyst At A Time Artemis is building on a track record of delivering derisking catalysts on time and in line with guidanceSenior Management Depth (Q1 2021): Addition of Jeremy Langford (COO) and Candice Alderson (SVP Corporate Affairs)GMP Process Plant (Q1 2021): Insulates 40% of initial development capital from capital and schedule overrunsCredit Approved Term Sheet Project Loan Facility (Q2 2021): Low-cost capital for C 360 M or 60% of initial development capitalGrade Control Drill Results (Q2 2021): Increased confidence in high-grade starter zone and early mine planning 171m equity offering (Q2 2021): Secures significant portion of project equity requirementsNazko IBAGMP Power Transmission Line: Targeting Q2 2021Definitive Feasibility Study: Targeting Mid 2021Final Fixed Price EPC Contracts: Targeting Q3 2021Final BC Mines Act and Federal Schedule 2 Amendment: Targeting Q1 2022Start of Blackwater Construction: Targeting Q2 2022TSX Venture: ARTGwww.artemisgoldinc.com6
Blackwater Project 2020 PFS SummaryAfter accounting for the gold stream granted to New GoldGold Price –US 1,541/ozPhase 1Phase 2Phase 3Phase 4LOM1-56-1011-1718-2323 yearsInitial/Expansion Capex 592m 426m 398mNil 1,415mSustaining Capex1 132m 199m 273m 107m 712mThroughput (tpa)5.5m12m20m20mVariableGold Grade ,000442,000168,000324,000Operating Strip Ratio1.681.922.17n/a2.00Operating Cost (C /t) 28.42 23.30 18.28 11.04 17.65 668 696 872 1,029 811 262m 351m 318m 102m 257mYearsGold RecoveryAvg. Annual Gold ProductionAISC (C /oz)Avg. Annual FCF22.0 YearsInitial Capex Payback Period50%Levered After-Tax IRR3C 2,247mAfter-Tax NPV (5%)Note: PFS Pre-Feasibility Study, NPV Net Present Value, IRR Internal Rate of Return, Operating Strip Ratio is calculated by dividing waste by processed and stockpiled ore1Sustaining Capex includes closure costs2FCF Operating Cash Flow – Sustaining Capex– Cash Taxes (Excludes Expansion/Growth Capital)3Refer to News Release Dated August 26, 2020 “Artemis Announces Revised PFS for Blackwater Project” for Levered scenario assumptionsTSX Venture: ARTGwww.artemisgoldinc.com7
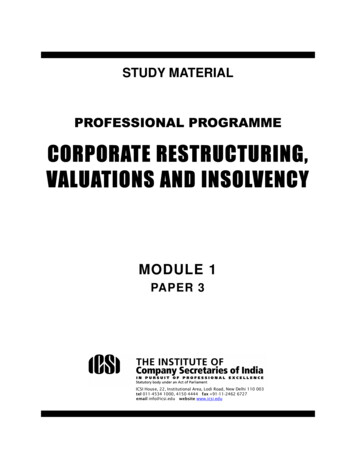
Broad Zones of Mineralization drive the low LOM stripA – Long Section N 5892775AEWB – Cross Section E 375050BCNSC – Cross Section E 375550NSTSX Venture: ARTGwww.artemisgoldinc.com8
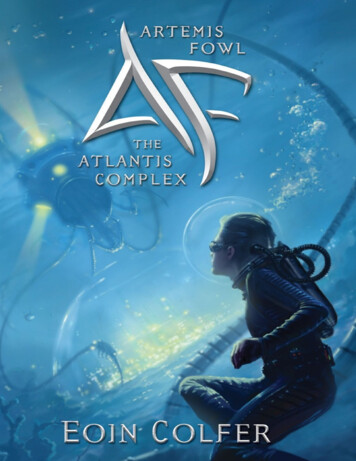
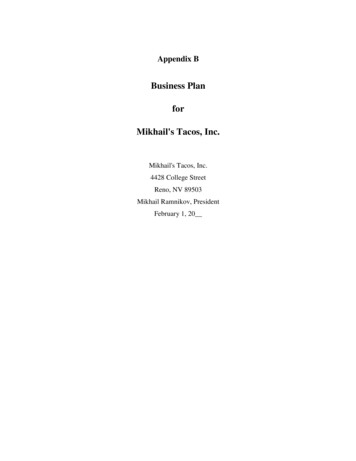
Targeting a High-Grade Starter Zone (Years 1-7)Bench 1570 –Within Year 1 Pit DesignHigh-grade starter zone for the firstseven years: 50.5 M tonnes processed from the southwestzone of the deposit Average grade processed: 1.50 g/t gold 2 strip ratioBench 1570: 1 of 7 benches to be mined within the firstyear of operationBench 1570 – YR1COG (AuEq g/t) 0.24 – 0.50Tonnes (kt)AuEq (g/t)koz7950.369.20 0.501,3651.4563.63Total2,1601.0572.83TSX Venture: ARTGwww.artemisgoldinc.com9
High Grade Continuity: Ramped up to 35,000 tpd (Year 7)Bench 1480 –Within Year 7 Pit DesignBench 1480: 1 of 8 benches to be mined within theseventh year of operationBench 1480 – YR7COG (AuEq g/t)Tonnes (kt)AuEq (g/t)koz 0.24 – 0.502,4060.3627.79 0.504,5541.39203.11Total6,9601.03230.90TSX Venture: ARTGwww.artemisgoldinc.com10
Grade Control Drilling Results: High-Grade Starter Zone 33,000m RC Drill Program Targeting 5 million tonnes of high grademineralization Refined drill density down to 12.5m x 12.5mspacing Derisks production and mine plan at start ofoperations Improved definition of waste to ore boundarieswith potential for a reduced strip ratio Interim LeachWellTM Results: 96.7% recovery for gold 72.2% recovery for silverHigh-Grade Highlights (Au only): 27m grading 12.5 g/t Au (starting at 24m) 33m grading 10.4 g/t Au (starting at 33 m) 21m grading 12.4 g/t Au (starting at 18 m) 39m grading 6.5 g/t Au (starting at 21 m) 45m grading 5.6 g/t Au (starting at 18 m)Note: LeachWellTM Assay results are based on the leached Au and Ag after 5-hour LeachWellTM accelerated leach, and exclude Au and Ag remaining in residue solids.Highlighted results on this slide only reflect intercepts with width x grade greater than 200 g–m of gold based on a 1.0 g/t Au cut off.TSX Venture: ARTGwww.artemisgoldinc.com11
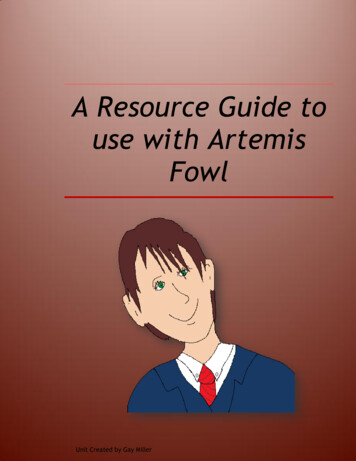
Grade Control: Section 5892787.5NSection 5892787.5NSection Highlights (Au only): BWRC00152: 6m @ 11.0 g/t Au (starting at 6m) And 21m @ 3.8 g/t Au (starting at 24m) BWRC00155: 18m @ 4.4 g/t Au (starting at 27m) BWRC00156: 18m @ 5.4 g/t Au (starting at surface) Including 3m @ 22.7 g/t Au (starting at 12m) BWRC00157: 33m @ 10.4 g/t Au (starting at 33m) Including 6m @ 39.4 g/t Au (starting at 45m)Note: LeachWellTM Assay results are based on the leached Au and Ag after 5-hour LeachWellTM accelerated leach, and exclude Au and Ag remaining in residue solids.Highlighted results on this slide only reflect intercepts with width x grade greater than 60 g–m of gold based on a 1.0 g/t Au cut off.TSX Venture: ARTGwww.artemisgoldinc.com12
Grade Control: Section 5892775NSection 5892775NSection Highlights (Au only): BWRC00132: 24m @ 3.0 g/t Au (starting at surface) BWRC00139: 12m @ 5.0 g/t Au (starting at 57m) BWRC00142: 27m @ 3.0 g/t Au (starting at 39m) BWRC00143: 15m @ 4.0 g/t Au (starting at 21m) BWRC00145: 15m @ 5.0 g/t Au (starting at surface) And 18m @ 4.0 g/t Au (starting at 18m) BWRC00147: 30m @ 3.5 g/t Au (starting at 3m)Note: LeachWellTM Assay results are based on the leached Au and Ag after 5-hour LeachWellTM accelerated leach, and exclude Au and Ag remaining in residue solids.Highlighted results on this slide only reflect intercepts with width x grade greater than 60 g–m of gold based on a 1.0 g/t Au cut off.TSX Venture: ARTGwww.artemisgoldinc.com13
Grade Control: Section 5892762.5NSection 5892762.5NSection Highlights (Au only): BWRC00110: 45m @ 5.6 g/t Au (starting at 18m) Including 3m @ 30.5 g/t Au (starting at 18m) BWRC00114: 30m @ 2.3 g/t Au (starting at 30m) BWRC00115: 21m @ 2.9 g/t Au (starting at 12m) BWRC00118: 21m @ 4.1 g/t Au (starting at 18m) BWRC00119: 39m @ 4.0 g/t Au (starting at 3m) BWRC00122: 42m @ 3.7 g/t Au (starting at 3m)Note: LeachWellTM Assay results are based on the leached Au and Ag after 5-hour LeachWellTM accelerated leach, and exclude Au and Ag remaining in residue solids.Highlighted results on this slide only reflect intercepts with width x grade greater than 60 g–m of gold based on a 1.0 g/t Au cut off.TSX Venture: ARTGwww.artemisgoldinc.com14
Differentiators: Blackwater Gold Project Tier 1 mining jurisdiction in Central British Columbia Environmental Assessments Approved in 2019 Supportive Primary Indigenous Nations: Participation Agreement with Lhoosk’Uz Dené Nation and theUlkatcho First Nation executed in April 2019. Manageable Initial Development Capital of 592 M High-Grade, Low Strip Starter Pit: Average gold grade of 1.50 g/t gold processed through the mill overthe first seven years with a strip ratio of 1.80.TSX Venture: ARTGwww.artemisgoldinc.com15
Blackwater: Bottom Quartile AISC The World Gold Council reported average AISC of US 983/oz in Q4 2020 With AISC of CAD 811 per ounce or US 616 per ounce (assuming 0.76 US :CAD F/X
Artemis considers and discloses cash costs on a sales basis. The Company believes that, in addition to conventional measures prepared in accordance with IFRS, such as sales, certain investors use this information to evaluate the Project’s performance and ability to generate operating earnings and cash flow from its mining operations. Management