Transcription
Texas A&M University CommerceAssessing our Learning, Living, and WorkingOctober 24-25, 20161
Climate In Higher EducationCommunityMembersCreate rning)Barcelo, 2004; Bauer, 1998, Kuh & Whitt, 1998; Hurtado, 1998, 2005; Ingle, 2005; Milhem, 2005; Peterson,1990; Rankin, 1994, 1998, 2003, 2005; Rankin & Reason, 2008; Smith, 2009; Tierney, 1990; Worthington, 20082
Assessing Campus Climate Campus Climate is a constructWhat is it?Definition? Current attitudes, behaviors, andstandards and practices of employeesand students of an institutionHow is itmeasured? Personal Experiences Perceptions Institutional EffortsRankin & Reason, 20083
Campus Climate & StudentsHow studentsexperience theircampus environmentinfluences bothlearning ments have anegative effect onstudent learning.2Research supports thepedagogical value ofa diverse studentbody and faculty onenhancing learningoutcomes.3Pascarella & Terenzini, 1991, 2005; Harper & Hurtado, 2009, Maramba. & Museus, 2011, Patton, 2011, Strayhorn, 2012Cabrera, Nora, Terenzini, Pascarella, & Hagedron, 1999; Feagin, Vera & Imani, 1996; Pascarella & Terenzini, 2005Hale, 2004; Harper & Quaye , 2004; Harper, & Hurtado, 2009; Hurtado, 2003, Nelson & Niskodé-Dossett, 2010; Strayhorn, 20134
Campus Climate & Faculty/StaffThe personal andprofessionaldevelopment ofemployees includingfaculty members,administrators, and staffmembers are impactedby campus climate.1Faculty members whojudge their campusclimate morepositively are morelikely to feel personallysupported and perceivetheir work unit as moresupportive.2Research underscores therelationships between (1)workplace discriminationand negative job/careerattitudes and (2)workplace encounters withprejudice and lowerhealth/well-being.31Settles,Cortina, Malley, and Stewart , 2006, Gardner, S. 2013; Jayakumar, Howard, Allen, & Han, J. 20092012; Sears, 2002; Kaminski, & Geisler, 2012; Griffin, Pérez , Holmes, & Mayo 20103Silverschanz, Cortina, Konik, & Magley, 2007; Waldo, 19992Costello,5
Climate MattersStudent Activism in 20166
Climate MattersStudent Activism in 20167
What Are Students Demanding?While the demands vary by institutionalcontext, a qualitative analysis revealssimilar themes across the 76 institutionsand organizations (representing 73 U.S.colleges and universities, three Canadianuniversities, one coalition of universitiesand one consortium of Atlanta HBCUs.)Chessman & Wayt explore theseoverarching themes in an effort to providecollective insight into what is important totoday’s students in the heated context ofracial or other bias-related incidents oncollege and university campuses.Source: Chessman & Wayt, 2016 ; http://www.thedemands.org/8
Seven Major ThemesPolicy (91%)Leadership (89%)Resources (88%)Increased Diversity (86%)Training (71%)Curriculum (68%)Support (61%)Source: Chessman & Wayt, 2016 ; http://www.thedemands.org/9
Responses to UnwelcomingCampus ClimatesWhat are students’ behavioralresponses?10
Lack of Persistence30% of respondentshave seriouslyconsidered leavingtheir institution due tothe challengingclimateWhat do studentsoffer as the mainreason for theirdeparture?Similarly, 33% of Queer spectrumand 38% of Transspectrumrespondents have seriouslyconsidered leaving their institutiondue to the challenging climateSource: R&A, 2015; Rankin, et al., 2010; Strayhorn, 201211
Suicidal Ideation/Self-HarmExperiencedVictimizationLack of SocialSupportFeelings ofhopelessnessSuicidal Ideationor Self-HarmSource: Liu & Mustanski 201212
Projected OutcomesTexas A&M University-Commerce will add to theirknowledge base with regard to how constituentgroups currently feel about their particular campusclimate and how the community responds to them(e.g., work-life issues, curricular integration, intergroup/intra-group relations, respect issues).Texas A&M University-Commerce will use theresults of the assessment to inform current/on-goingwork.13
Setting the Context forBeginning the WorkExaminetheResearch Review workalreadycompletedPreparationAssessmentFollow-up Readiness ofeach campus Examine theclimate Building onthe successesandaddressingthechallenges14
Transformational Tapestry Model ipCurrentCampusClimateLocal / Sate /RegionalEnvironmentsSystemsAnalysisContextualized Campus Wide up pusClimateCurriculumPedagogyIntergroup &IntragroupRelationsExternalRelations 200115
Project OverviewPhase I Focus GroupsPhase II Assessment Tool Development and ImplementationPhase III Data AnalysisPhase IV Final Report and Presentation16
Phase ISpring/Fall 2015Processto DateIn collaboration with R&A, the ClimateStudy Working Group (CSWG;comprised of faculty, staff, students andadministrators) was created.17 focus groups were conducted oncampus (84 participants – 14 undergradstudents; 14 grad students; 56 faculty,staff, and administrators) on November 13, 2015Data from the focus groups informed theCSWG and R&A in constructingquestions for the campus-wide survey.17
Phase IIProcessFall 2015/Spring2016to DateMeetings were held with the CSWG todevelop the survey instrument.The CSWG reviewed multiple drafts ofthe survey and approved the final surveyinstrument.The final survey was distributed to theentire Texas A&M UniversityCommerce community (students, faculty,staff, and administrators) via aninvitation from President Jones.18
Instrument/SampleFinal instrument 110 questions and additional space forrespondents to provide commentary(24 qualitative, 86 quantitative) On-line or paper & pencil optionsSample Population All community member were invitedto take the survey. The survey was available fromFebruary 23 – April 3, 2016.19
Survey irabilityCaution ingeneralizing resultsfor constituentgroups with lowresponse rates20
Method LimitationData were not reported forgroups of fewer than 5individuals where identity couldbe compromisedInstead, small groups werecombined to eliminate possibilityof identifying individuals21
Phase IIIProcesstoSpring/Summer 2016DateQuantitative and qualitativeanalyses conducted22
Phase IVFall 2016Report draft reviewed by theCSWGFinal report submitted to TexasA&M University-CommercePresentation to the campuscommunity23
ResultsResponseRates24
Who are the respondents?2,495 people responded to the call toparticipate18% overall response rate25
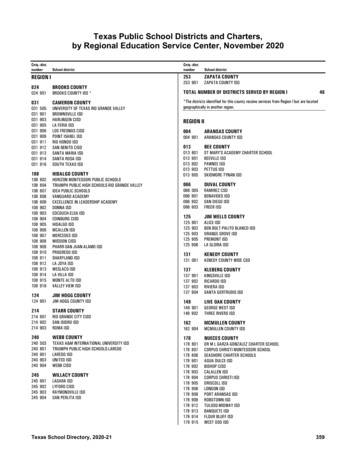
Response Rates byStudent Position18%13% Undergraduate Student (n 1,316) Graduate Student (n 679)26
Response Rates byEmployee Position24%47%N/A Faculty (n 158) Staff (n 313) Senior Administrator (n 29)27
Response Rates byGender Identity20%16%N/A Woman (n 1,592) Man (n 878) Genderqueer (n 10)28
Response Rates byRacial Identity46%34%16%16% Asian/Asian American/South Asian (n 213) Hispanic/Latin@/Chican@ (n 317) Black/African American (n 416) White/European American (n 1,266)29
Response Rates byRacial Identity10%3%1%N/A Native Hawaiian/Other Pacific Islander (n 7) First Nation/American Indian/Indigenous (n 19) International/Middle Eastern/North African (n 10) Multiple Race/Other (n 247)30
ResultsAdditional DemographicCharacteristics31
Respondents by Position (%)32
Faculty Respondents’Primary Academic DivisionAcademic divisionn%College of Business2012.7College of Science & Engineering2717.1College of Education & Human Services3924.7College of Humanities, Social Sciences & Arts4629.1Provost Office (e.g., Library)106.3Institutional Effectivenessn 5---Business & Administrationn 5---Student Access and Successn 5---School of Agriculturen 5---Center for Faculty, Excellence & Innovationn 5--33
Undergraduate Student Respondents’Top Academic MajorsAcademic majorn%Psychology91 6.9Criminal Justice87 6.6AccountingB.A.I.S./B.S.I.S. – Teacher Certification, EC-6Generalist84 6.473 5.5Nursing66 5.0Management63 4.8Human Performance47 3.6Sociology46 3.5Note: For a full listing of Undergraduate Student respondents’ majors, see Appendix B34
Undergraduate Student Respondents’Year in College CareerYearn%120.9First year26620.2Second year25419.3Third year36027.4Fourth year27520.9Fifth year806.1Sixth year30382.32.9Non-degree studentSeventh year (or more)35
Graduate Student Respondents’Academic Degree ProgramsAcademic divisionn%56983.8Master’s degree certificates50.7Doctoral degree programs8813.0Teacher Certification111.630.4Master’s degree programsSpecialist degree in School PsychologyNote: For a full listing of Graduate Student respondents’ academic degree programs, see Appendix B36
Graduate Student Respondents’Year in Graduate CareerYearn%59187.0First year29549.9Second year18731.6Third year or more6310.7Doctoral degree student8813.0First year2831.8Second year2022.7Third yearFourth year or moreABD11101512.511.417.0Master’s degree student37
Respondents by Racial/Ethnic Identity (%)38
Respondents by Gender Identity andPosition Status (%)Note: Responses with n 5 are not presented in the figure.39
Respondents by Sexual Identity andPosition Status (n)Undergraduate Students1,071Graduate StudentsFacultyStaff53729212612153925LGBQNote: Responses with n 5 are not presented in the figure.Heterosexual40
10% (n 245) of Respondents Had Conditions thatSubstantially Influenced Their Learning, Working, orLiving ActivitiesConditionn%Learning disability9036.7Mental health/psychological conditionChronic medical conditionPhysical/mobility condition that affects walkingPhysical/mobility condition that does not affect walkingA disability/condition not listed hereHearing impaired or deafAcquired/traumatic brain injuryVisually-impaired or blindSpeech/communication .72.9n 5---Asperger’s/autism spectrum41
Respondents byFaith-Based Affiliation (%)42
Citizenship StatusCitizenshipU.S. citizen, birthA visa holder (such as F-1, J-1, H1-B, and U)U.S. citizen, naturalizedPermanent residentDACA (Deferred Action for Childhood Arrival)Other legally documented statusMissingRefugee statusUndocumented residentn%2,05320310259402014n 5n 582.38.14.12.41.60.80.6-----Currently under a withholding of removal statusDAPA (Deferred Action for Parental Accountability)n 5n 5----43
Military StatusMilitaryNever served in the militaryNow on active duty (including Reserves or NationalGuard)On active duty in the past but not nown%2,36194.6100.41074.344
Employee Respondents by Age (n)45
Student Respondents by Age (n)46
Student Respondents’ EmploymentEmploymentn%NoYes, I work on campus1-10 hours/week11-20 hours/week21-30 hours/week31-40 hours/weekMore than 40 hours/weekYes, I work off campus1-10 hours/week11-20 hours/week21-30 hours/week31-40 hours/weekMore than 40 .017.372.34.92.72.941.38.316.614.522.438.247
Student Respondents’ ResidenceCampus housing(35%, n 688)Off-campushousing(64%, n 1,267)48
Student Respondents’ ResidenceCampus HousingResidenceWhitley HallPride RockSmith HallBerry HallWomen's HallSorority HousingPhase II New Residence HallWest HallsNew Pride ApartmentsPrairie Crossing ApartmentsLeberman Family 5.422.53.216.914.01.749
Student Respondents’ ResidenceOff-campus housingResidencen%Living in an apartment/house (alone or sharing)72575.1Living with family member/guardian24024.950
Student Respondents’ Income byDependency Status (%)51
54% (n 1,077) of Student RespondentsReported Experiencing FinancialHardship MannerDifficulty affording tuitionDifficulty purchasing my booksDifficulty in affording housingDifficulty affording foodDifficulty in affording health careDifficulty in affording other campus feesDifficulty participating in social eventsDifficulty participating in co-curricular events or activities (e.g.,alternative spring breaks, class trips)Difficulty in affording study abroadDifficulty traveling home during A&M-Commerce breaksDifficulty commuting to campusDifficulty in affording childcareAn experience not offered 020.8223200189178796720.718.617.516.57.36.2Note: Table includes Student respondents who reported having experienced financial hardship (n 1,077) only. Sum does not total100% as a result of multiple response choices.52
How Student Respondents WerePaying For CollegeFormnLoansGrant (e.g., Pell, Texas Public Education Grant)Family contributionPersonal contribution/jobNon-need-based scholarship (e.g., athletic, merit)Credit cardNeed-based scholarship (e.g., Gates)GI Bill/HazelwoodA method of payment not listed hereGraduate assistantshipWork-studyResident 5.424.521.917.016.29.15.65.24.94.62.053
Student Respondents’ Participation inClubs or Organizations at Texas A&MUniversity-CommerceClubs/Organizationsn%I do not participate in an organization93146.7Honorary ly-affiliated1336.7Special interest groups1286.454
Student Respondents’ Participation inClubs or Organizations (cont’d)Clubs/OrganizationsnGoverning associations572.9Greek social fraternity653.31035.2Intercollegiate athletics984.9Service organizations693.5Greek social sorority%55
Student Respondents’ CumulativeG.P.A.G.P.A.n%No GPA (started at Texas A&M University-Commercethis semester)453.43.75 - 4.0031123.63.25 - 3.7439329.93.00 - 3.2420315.42.50 - 2.9924018.22.00 - 2.49826.2Below 2.00403.056
Findings57
Comfort Levels“Very Comfortable”/ “Comfortable”Overall CampusClimate(94%)Department/WorkUnit Climate(84%)ClassroomClimate (95%)58
Comfort With Overall ClimateRespondents fromChristian Affiliationsmore comfortablethan wererespondents with NoAffiliationGraduate Studentrespondents morecomfortable than wereStaff and FacultyrespondentsWhite respondentsmore comfortablethan wereBlack/AfricanAmerican andMultiracialrespondents59
Comfort With Department/Work UnitClimateWhite Faculty and Staffrespondents morecomfortable than wereBlack/African AmericanFaculty and Staffrespondents60
Comfort With Classroom ClimateWhite Student andFaculty respondentsmore comfortablethan wereBlack/AfricanAmerican andMultiracial Studentand FacultyrespondentsGraduate Studentrespondents andFaculty respondentsmore comfortablethan wereUndergraduateStudent respondentsHeterosexual Facultyand Studentrespondents morecomfortable thanwere LGBQ Facultyand Studentrespondents61
Comfort With Classroom ClimateNot-Low-IncomeStudent respondentsmore comfortablethan were LowIncome StudentrespondentsFaculty and Studentrespondents with NoDisability morecomfortable thanwere Faculty andStudent respondentswith MultipleDisabilities62
Challenges and Opportunities63
Personal Experiences of Exclusionary,Intimidating, Offensive or Hostile Conduct13% 319 respondents indicated thatthey had personally experiencedexclusionary (e.g., shunned,ignored), intimidating, offensiveand/or hostile (bullying,harassing) conduct at TexasA&M University-Commercewithin the past year64
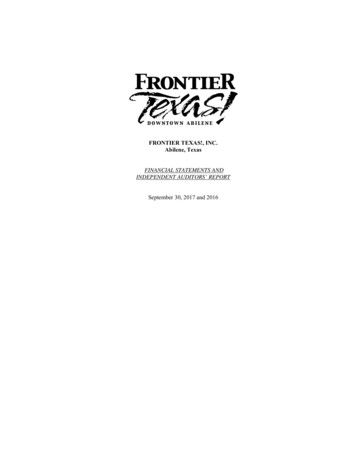
Personally Experienced Based on (%)22Position (n 70)Ethnicity (n 69)Gender/gender identity (n 56)Age (n 53)Don't know (n 52)Racial identity (n 40)Educational credentials (n 39)2218171613Note: Only answered by respondents who experienced exclusionary conduct (n 319).Percentages do not sum to 100 due to multiple responses.1265
Forms of Experienced Exclusionary,Intimidating, Offensive or Hostile Conductn%Ignored or excluded12238.2Intimidated/bullied11937.3Isolated or left out10332.3Experienced a hostile work environment8125.4Target of derogatory verbal remarks6821.3Target of workplace incivility5316.6Note: Only answered by respondents who experienced exclusionary conduct (n 319).Percentages do not sum to 100 due to multiple responses.66
Personal Experiences of Exclusionary,Intimidating, Offensive or Hostile Conduct asa Result of Position Status (%)(n 128)¹(n 55)¹(n 40)¹(n 96)¹(n 11)²(n 12)²(n 10)²(n 37)²¹ Percentages are based on total n split by group.² Percentages are based on n split by group for those who believed they had personally experienced this conduct.67
Personal Experiences of Exclusionary,Intimidating, Offensive or Hostile Conduct asa Result of Ethnicity (%)(n 54)¹(n 22)¹(n 34)¹(n 157)¹(n 31)¹(n 20)²(n 10)²(n 12)²(n 19)²(n 5)²¹ Percentages are based on total n split by group.² Percentages are based on n split by group for those who believed they had personally experienced this conduct.68
Personal Experiences of Exclusionary,Intimidating, Offensive or Hostile Conduct asa Result of Gender Identity (%)(n 112)¹(n 204)¹(n 13)²(n 43)²¹ Percentages are based on total n split by group.² Percentages are based on n split by group for those who believed they had personally experienced this conduct.69
Personal Experiences of Exclusionary,Intimidating, Offensive or Hostile Conduct asa Result of Age (%)(n 28)¹(n 52)¹(n 42)¹(n 65)¹(n 41)¹(n 38)¹(n 27)¹(n 5)²(n 5)²(n 13)²(n 16)²(n 6)²(n 5)²(n 6)²¹ Percentages are based on total n split by group.² Percentages are based on n split by group for those who believed they had personally experienced this conduct.70
Location of Experienced Conductn%In a meeting with a group of people6219.4While working at an A&M-Commerce job6219.4In a class/lab6119.1In an A&M-Commerce administrative office5517.2In a meeting with one other person4714.7In other public spaces at A&M-Commerce4313.5In campus housing4112.9At an A&M-Commerce event/program3611.3On phone calls/text messages/email3511.0Note: Only answered by respondents who experienced exclusionary conduct (n 319).Percentages do not sum to 100 due to multiple responses.71
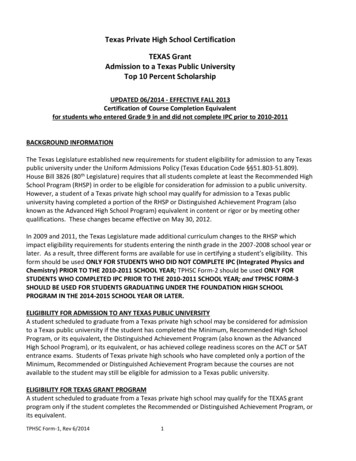
Source of Experienced Conduct forStudent Respondents (%)Note: Only answered by respondents who experienced exclusionary conduct (n 319).Percentages do not sum to 100 due to multiple responses.72
Source of Experienced Conduct forFaculty Respondents (%)Note: Only answered by respondents who experienced exclusionary conduct (n 319).Percentages do not sum to 100 due to multiple responses.73
Source of Experienced Conduct forStaff Respondents (%)Note: Only answered by respondents who experienced exclusionary conduct (n 319).Percentages do not sum to 100 due to multiple responses.74
What did you do?Emotional Responses Felt angry (61%)Felt embarrassed (37%)Was afraid (24%)Ignored it (22%)Felt somehow responsible (9%)Note: Only answered by respondents who experienced exclusionary conduct (n 319).Percentages do not sum to 100 due to multiple responses.75
What did you do?Actions Told a friend (36%)Didn’t do anything (34%)Told a family member (33%)Avoided the person/venue (28%)Contacted an on-campus resource (18%) Senior administrator (32%)Faculty member (30%)Office of Human Resources (28%)Staff person (28%)Department chair (21%)Note: Only answered by respondents who experienced exclusionary conduct (n 319).Percentages do not sum to 100 due to multiple responses.76
25% (n 80) ofRespondents whoExperienced ConductReported ItFelt that it was not responded toappropriately(43%)While the outcome was not what Ihad hoped for, I felt as though mycomplaint was responded toappropriately(34%)Felt satisfied with the outcome(15%)Note: Only answered by respondents who experienced
Texas A&M University - Commerce 1 Assessing our Learning, Living, and Working . October 24-25, 2016