Transcription
CITY OF AURORA//Integrated Water Master PlanTable of Contents1.0Executive Summary . 1-61.11.21.31.41.51.61.72.0Project Introduction . 2-12.12.22.33.0Planning Horizon . 4-1Planning Scenarios . 4-1Risk Identification. 4-3IWMP Assumptions . 4-4Water Resources . 5-15.15.25.35.45.55.65.76.0Water Demands . 3-1Water Conservation . 3-3Planning Framework . 4-14.14.24.34.45.0Background . 2-1Overview of the Aurora Water System. 2-1Authorization . 2-2Demand Planning . 3-13.13.24.0Introduction . 1-6Planning Scenarios and Demand Projections . 1-6Water Resources . 1-8Water Treatment . 1-10Distribution . 1-13Integrated 10 Year CIP Prioritization and Results. 1-14Summary . 1-16Introduction . 5-1Basis of Planning . 5-1Water Resources Modeling . 5-1Vulnerability and Planning Scenarios Assessment . 5-3Water Resources Projects . 5-5Water Resources Portfolios . 5-15Water Resources Plan . 5-17Treatment . 6-16.16.26.36.46.5MWH FINAL REPORTSystem Design Requirements . 6-1Existing System Demands and Capacity . 6-1Future System Demands and Capacity Required . 6-4Proposed Capital Projects . 6-66.4.1 Rampart Raw Water System . 6-66.4.2 Griswold WPF Capacity Recovery . 6-66.4.3 Binney WPF – South Platte Train Build-Out . 6-7Findings and Recommendations . 6-106.5.1 Planning Scenario 1 (Baseline Plus). 6-136.5.2 Planning Scenario 2 (Fast Growth) . 6-146.5.3 Planning Scenario 3 (Fast and Hot) . 6-156.5.4 Planning Scenario 4 (Hot Baseline) . 6-16SEPTEMBER 2017//PAGE i
CITY OF AURORA//Integrated Water Master Plan7.0Distribution . 7-17.17.27.37.48.0CIP Prioritization and Results . 8-18.18.28.39.0System Design Requirements . 7-1Near-Term Projects . 7-8Long-Term Projects . 7-9Capital Improvement Plan . 7-10CIP Prioritization . 8-1Approach . 8-18.2.1 Overview . 8-18.2.2 Criteria Determination, Weighting, and Scoring. 8-28.2.3 Additional Prioritization Analyses – Schedule Optimization . 8-5CIP Results . 8-5References . 9-1MWH FINAL REPORTSEPTEMBER 2017//PAGE ii
CITY OF AURORA//Integrated Water Master PlanList of TablesTable 1-1.Table 1-2.Table 1-3.Table 3-1.Table 3-2.Table 3-3.Table 4-1.Table 4-2.Table 5-1.Table 5-2.Table 5-3.Table 5-4.Table 5-5.Table 5-6.Table 5-7.Table 5-8.Table 6-1.Table 6-2.Table 6-3.Table 6-4.Table 6-5.Table 7-1.Table 7-2.Table 7-3.Table 7-4.Table 7-5.Table 7-6.Table 8-1.Table 8-2.MWH FINAL REPORTIWMP Planning Scenario Characteristics . 1-7Key Metrics for Water Resources System Performance Analysis. 1-8Existing Raw Water Supply and Treatment Capacities. 1-11Annual Demand for Future Years by Exceedance Probability . 3-2Conservation Measures Included in Program B . 3-3Projected GPCD Change with Conservation Program B as Compared to 2014GPCD . 3-4IWMP Planning Scenario Characteristics . 4-2CIP Growth and Climate Related Risks . 4-4Drought Response Stages and Watering Restrictions . 5-2Drought Response Stage Thresholds for Current Demand and StorageConditions . 5-2Key Metrics for Water Resources System Performance Analysis. 5-3Potential Water Resources Supply Projects for Analysis in the IWMP . 5-6Potential Delivery System Improvement Projects for Analysis in the IWMP . 5-11Cost Estimates for Potential Water Resources Supply Projects . 5-14Cost Estimates for Potential Delivery System Improvement Projects . 5-14Balanced Storage/Supply Portfolios for 2070 Gap . 5-17Existing Raw Water Supply and Treatment Capacities. 6-3Water Demands by Year and Planning Scenario. 6-4Water Demands Satisfied by Existing Capacity . 6-5Capital Costs of Proposed Treatment and Water Resources Projects ImpactingCapacity . 6-11Cumulative Raw Water Supply and Treatment Capacities . 6-122020 T&D Improvement Projects . 7-22035 T&D Improvement Projects . 7-32070 T&D Improvement Projects . 7-52070 Pump Station Improvement Projects . 7-72070 Storage Improvement Projects . 7-7Distribution CIP Total Cost by Year and Project Category . 7-10Final TBL Prioritization Criteria . 8-4Aurora Water 10 Year CIP Cash Flow Summary* . 8-8SEPTEMBER 2017//PAGE iii
CITY OF AURORA//Integrated Water Master PlanList of FiguresFigure 1-1.Figure 1-2.Figure 1-3.Figure 1-4.Figure 1-5.Figure 1-6.Figure 3-1.Figure 4-1.Figure 4-2.Figure 5-1.Figure 5-2.Figure 5-3.Figure 5-4.Figure 5-5.Figure 6-1.Figure 6-2.Figure 6-3.Figure 6-4.Figure 6-5.Figure 6-6.Figure 8-1.Figure 8-2.Figure 8-3.Figure 8-4.MWH FINAL REPORTRange of Annual Demand Projections . 1-7Summary of Water Resources Portfolios for Each Planning Future . 1-9Peak Day Water Demands by Year and Total Existing WPF Production Capacity 1-12Planning Scenario 2 Project Timing . 1-13Aurora Water 10 Year CIP, Spend by Year . 1-14Aurora Water 10 Year CIP Summary Gantt Chart . 1-15Range of Annual Demand Projections . 3-2System-wide Annual Raw Water Demands at WPF Intakes for IWMP PlanningScenarios . 4-2Risk Workshop Process . 4-3Non-Restriction Frequency System Performance with Selected System Risks . 5-5Overview of Portfolio Development Process . 5-15Summary of CIP Portfolios for Each Planning Future . 5-16Aurora Water Resources Strategies and Threats . 5-18Factors to Track for Adaptive Water Supply Planning . 5-19Ideal Annual System Demand and WISE Distribution . 6-2Water Demands by Year and Planning Scenario. 6-5Planning Scenario 1 (Baseline Plus) Project Timing . 6-14Planning Scenario 2 (Fast Growth) Project Timing . 6-15Planning Scenario 3 (Fast and Hot) Project Timing . 6-16Planning Scenario 4 (Hot Baseline) Project Timing . 6-17Initial Prioritization Process . 8-2Aurora Water 10 Year CIP, Total by Discipline . 8-6Aurora Water 10 Year CIP, Spend by Year . 8-6Aurora Water 10 Year CIP Summary Gantt Chart . 8-7SEPTEMBER 2017//PAGE iv
CITY OF AURORA//Integrated Water Master PlanList of RMFSPSQLTAZT&DTDSTWMPUHETVFDWISEWNAWPFWRTMMWH FINAL REPORTacre-feetacre-feet per yearAutomated Meter InfrastructureAurora ReservoirAquifer Recharge and RecoveryAurora WaterBBC Research & ConsultingCommercial, Institutional, and IndustrialCapital Improvement Plandata management systemfilter-to-wastegallons per capita per dayhigh efficiencyIntegrated Water Master Planlevel of servicelarge propertymillion gallons per dayMWH Americas, Inc.operation and maintenanceOpinion of Probable Construction Costsoptimization-based searchespre-stressed concrete cylinder pipepump stationPrairie Watersriverbank filtrationRisk Management FrameworkSouth PlatteStructured Query LanguageTransportation Analysis ZoneTransmission and DistributionTotal Dissolved SolidsTreated Water Master Planultra-high-efficiency toiletvariable frequency driveWater Infrastructure and Supply Efficiencywater needs assessmentwater purification facilityWater Resources Technical MemorandumSEPTEMBER 2017//PAGE v
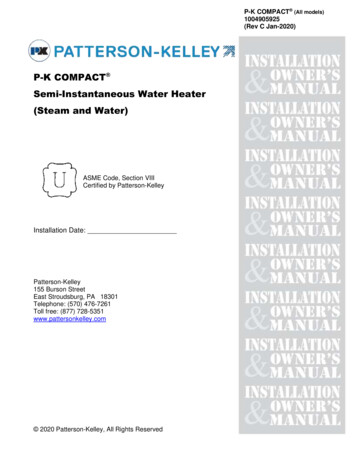
CITY OF AURORA//Integrated Water Master Plan1.0 Executive Summary1.1IntroductionThe Integrated Water Master Plan (IWMP) integrates short-term and long-range planning across theWater Resources, Treatment, and Transmission and Distribution (T&D) disciplines within AuroraWater. An integrated Capital Improvement Plan (CIP) focused on growth-related projects wasdeveloped using consistent key assumptions and the same planning horizon for all disciplines. Longrange plans were also developed for each of the disciplines to address uncertainty around futuregrowth and climate variability.1.2Planning Scenarios and Demand ProjectionsThe IWMP addresses water needs and planning strategies from 2016 to 2070. Planning milestoneswere set at 2025, 2035, and 2050 to evaluate interim needs and solutions. Four planning scenarioswere developed to cover a range of population growth, economic growth, future climate, and futureconservation program assumptions. Table 1-1 shows a summary of the assumptions included in eachplanning scenario and the associated system-wide raw water demands.Demand projections were created using a demand forecasting model that incorporated population,land use, development density, projections of water use and water use intensity among different classesof customers, employment factors, water pricing, and weather conditions – 19 variables in all.Demands were estimated for different confidence intervals, representing the uncertainty surroundingthe demand model parameters used to develop the future demand projections. Figure 1-1 shows theplanning scenario demands as well as the base forecast and its associated 90% and 99% confidenceintervals.A review of the water conservation program was conducted to identify additional conservationmeasures that would be cost-effective to add to the existing program. Three future conservationprograms were analyzed and resulted in the selection of Program B, which includes additionalconservation measures that provide the greatest benefit-cost and can be readily implemented byAurora Water. When combined with savings associated with changes in the plumbing code, ProgramB will reduce 2015 per capita demands by about 10 percent by 2050.Simulations of Aurora Water’s water supply system were performed using a Paleo hydrologic ensemblerepresenting current climate conditions and a Modified Paleo hydrologic ensemble representing ahotter, drier climate that would result in approximately 19 percent reduction in mean streamflow.MWH FINAL REPORTSEPTEMBER 2017//PAGE 1-6
CITY OF AURORA//Integrated Water Master PlanTable 1-1.IWMP Planning Scenario ual Demands (ac-ft/year) at WPF Intakes**202520352050Average growth, weather,and hydrology –1) Baseline PlusPaleo49,75055,17261,31375,928enhanced conservation(Program B)High growth, averageweather, and hydrology –2) Fast GrowthPaleo51,29059,43868,30187,194enhanced conservation(Program B)High growth, hot/dryweather, and hot/dryModified3) Fast and Hot57,24766,42976,47798,295hydrology – enhancedPaleoconservation (Program B)Average growth, hot/dryweather, and hot/dryModified4) Hot Baseline55,49561,62068,55085,367hydrology – enhancedPaleoconservation (Program B)*Forecast was prepared in 2014; actual 2015 demand was 47,540 ac-ft.**Demands for finished water from the water purification facilities are 3 percent less than the values in thisFigure e of Annual Demand ProjectionsPlanning Scenario 2 (Fast Growth) was selected as the basis for IWMP CIP development. PlanningScenario 3 (Fast and Hot) generated demands that fell outside the 90 percent confidence range of thebase demand forecast, and was thus eliminated from most IWMP analyses.Future maximum-day and maximum-hour demands were estimated based on analysis of historicaldata and anticipated future water use, demographic trends, and climate conditions. Maximum-daydemand was estimated as 3.4 times average winter day demand and maximum-hour demand wasestimated as 1.6 times maximum-day demand.MWH FINAL REPORTSEPTEMBER 2017//PAGE 1-7
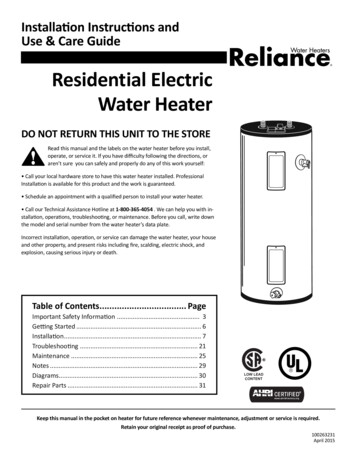
CITY OF AURORA//Integrated Water Master Plan1.3Water ResourcesThe Aurora Water supply simulation model (Excel-CRAM) was used to quantify impacts of waterresource risks on raw water system performance. Baseline models were developed for existing (2015)and future (2070) conditions and include currently owned water rights and current operation of AuroraWater facilities, historical operation of other entities in the source water basins, and all existing waterprojects (e.g., reservoirs and storage accounts). Aurora Water’s drought response program was alsoincluded in the Baseline Excel-CRAM model.Water resources system performance was evaluated using metrics and acceptable levels of service(LOS). Selected metrics and LOS goals are shown in Table 1-2.Table 1-2.Metric NameNo-RestrictionFrequencyKey Metrics for Water Resources System Performance AnalysisDescriptionProbability of being in“Normal Conditions” abovethe Stage I thresholdstorage level at thebeginning of any MayTargetStage I storagelevelAcceptableLOS (1)LOS Narrative 0.80 (80%)There will be no additionaloutdoor watering restrictions (2)in a minimum of 8 years in 10;or, there will be some form ofdrought restrictions no morethan 2 years in 10Demands afterreductionsReducedWill always meet demands thatfrom droughtSupply 1.0 (100%) are reduced due to any level ofrestrictionsReliabilitydrought restrictionshave beenappliedWISE (3)Probability of meeting WISE 10,000 ac-ftWill always meet WISE supplySupplyobligations on a monthlyannual 1.0 (100%)obligationsReliabilitybasisdeman
An integrated Capital Improvement Plan (CIP) focused on growth-related projects was . and 2050 to evaluate interim needs and solutions. Four planning scenarios were developed to cover a range of population growth, economic growth, future climate, and future . When combined with savings associated with changes in the plumbing code, Program