Transcription
15th International Conference on Cognition and Exploratory Learning in Digital Age (CELDA 2018)ANALYSING UNIVERSITY STUDENT ACADEMICPERFORMANCE AT THE UNIT LEVELEric Parkin, Simon Huband, David Gibson and Dirk IfenthalerCurtin Learning and Teaching, Curtin University, Perth, Western AustraliaABSTRACTThis paper describes the creation of a dataset to enable the analysis of student academic performance at the unit level at alarge Australian University. The dataset was designed to enable academic leaders to explore research questionsconcerning student performance and pass rates in units. Four example research questions are presented here and explored,to demonstrate the value of the exploratory dataset, along with an overview of the methodology and tools used tosynthesise the data. The data handling methodology and reflections on tools and processes may be useful for otheranalysts.KEYWORDSData Integration, Exploratory Analysis, Hypothesis Testing, Analytics Tools and Methods, Pass Rates1. INTRODUCTIONUniversities are increasingly interested in improving their capability to make data informed decisions aroundLearning and Teaching. Curtin University has employed a Learning and Teaching analytics team to helpenable this capability. Much the team’s work involves combining and transforming institutional data to createdatasets for the University’s academic leaders to explore for insights, and to use to answer hypotheses aboutlearning and teaching. The datasets are also used by the analytics team to conduct more complicated analysesat the request of academic leaders. This paper describes the creation of a dataset with information on studentacademic performance in units (known elsewhere as subjects). A sample analysis of four research questionsfollows, to demonstrate how the dataset can be used to answer hypotheses about learning and teaching.The need for this dataset was prompted by requests from academic leaders for data on student academicperformance, with statistics at the unit level. Faculties used existing data to identify units with low pass rates,but the data did not provide the detail required to explore some of their specific questions. Existing dataaddressed high-level reporting and strategic decision-making needs, rather than learning and teaching needs.One of the main differences in this tool, compared to other learning analytics tools used by the university, isthat it enables analysis at the unit level. Other learning analytics tools used by the university have focusedprimarily either on students, such as by using machine learning to predict student attrition (Kevin EK Chai,2015), or on courses (known elsewhere as degrees), by using clustering to find categories of students thatattrition in courses is low, (David Gibson, 2015).The issue of student attrition is related closely linked to academic performance in units. One study atanother Australian institution found that “first year academic performance is a much stronger predictor ofattrition than any demographic factors or educational background” (Andrew Harvey, 2014), and determinedthat “attrition is an institutional problem, but the causes often lie at the lower levels of course and subject”(Andrew Harvey, 2014). According to a recent report (Higher Education Standards Panel, 2017) it is apparentthat student attrition and the factors driving it have been of concern since the Commonwealth claimed a rolein higher education funding. Substantial resources have been committed over many years to exploring waysto reduce it. The consistently reported drivers of attrition, which are documented in the report, aresummarised in Table 1.153
ISBN: 978-989-8533-81-4 2018Table 1. Drivers of attritionDriverThe learning environmentThe teaching ability of lecturersLack of student engagementHigh student staff ratiosLack of student support informationand servicesPersonal factorsExamplesDramatic changes in learning culture from school to highereducationNew modes of learning (off-site, online, part-time)Adequacy of level of training in teachingHelpful and unhelpful patterns of student/student andstudent/teacher interactionAvailability of lecturers and tutors to studentsFinancial, social, emotional, health or other life events.The adjusted attrition rate (the rate at which students do not complete their course, and do not return tostudy it at any Australian University) in Australia has changed little over the period from 2005 to 2014. Theattrition rate fell from 15.04 per cent in 2005, down to a low of 12.48 per cent in 2009, before rising over theremainder of the period to 15.18 per cent by 2014 (Higher Education Standards Panel, 2017).The panel report and the other historical studies of attrition do not seem to focus on why students chooseeither to course switch or leave, even though the rate difference between normal attrition and adjustedattrition (course or institutional switchers) is significant. For example, the three-year running nationalaverage from 2012 to 2014 is 6%.The success rate measures units of study passed by commencing students and is understandably highlycorrelated with the adjusted attrition rate and adjusted retention rate, as poor academic performance is amajor factor in a student’s decision to discontinue studies. The success rate in 2015 was 83.72 % and hasdropped from its peak in 2004 of 86.85 % (Higher Education Standards Panel, 2017).This report also found that student characteristics alone appear to only explain a relatively small part ofthe overall variation in student attrition, with an adjusted R 2 of 22.55 for a full model consisting ofinstitution, full-time or part-time, attendance mode, age group, basis of admission, field of education,socio-economic status, indigenous, non-English speaking background, and gender (Higher EducationStandards Panel, 2017). The field of education, which may be the closest indicator related to units of study,had an adjusted R 2 of only 1.49, well below the leading indicator, institution, which had 18.83. Thisindicates that exploring unit of study success rates may need to be part of a wider array of inquiries andinterventions that will impact institutional culture to have an impact on schools, faculty areas, and the largeruniversity.The paper is structured as follows: Section 2 introduces the research questions used as a sample analysis,Section 3 describes the methodology of creating the dataset and conducting the analysis, Section 4 presentsthe results of the analysis, Section 5 discusses plans for future improvements and Section 6 concludes with areflection on the methodology and results.2. RESEARCH QUESTIONSCurtin University is a large, multi-campus Western Australian University, with over 35,000 from diversebackgrounds studying undergraduate and postgraduate , including over 10,000 international students as of2017, see Curtin’s ‘Office of Strategy and Planning’ website for more detail (Curtin University Office ofStrategy and Planning, 2017).To demonstrate the capabilities of the dataset, the following research questions were formulated, based ontypical questions the analytics team are asked by the University’s academic leaders:RQ1a: Is there a difference in pass rates between international students and domestic students whostudied a first-year communications unit in 2017?RQ1b: If there is a difference in pass rates, is this difference consistent with other first-year units?RQ2: Were students who attempted, but did not pass a first-year communications unit in 2017, lesslikely to have completed their attempt, compared to students who studied other first-year units?154
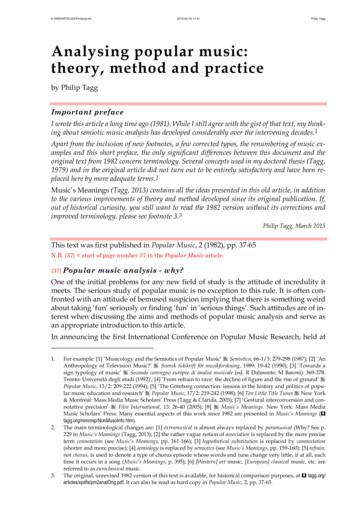
15th International Conference on Cognition and Exploratory Learning in Digital Age (CELDA 2018)RQ3: Were international students who entered via a particular ‘enabling pathway’ less likely to passa first-year communications unit in 2017 than international students who entered via otherpathways?RQ4a: Is there a difference in pass rates between students on their first attempt and students on theirsecond or subsequent attempt at a first-year communications unit in 2017?RQ4b: If there is a difference in pass rates, is this difference consistent with other first-year units?The ‘communications units’ refer to six communications-skills focused units from the University’s fourmain Faculties (Business and Law, Health Sciences, Humanities, and Science and Engineering). At leastone of these six units is compulsory for most undergraduate students.To eliminate potential confounding factors, only student enrolments which met the criteria in Table 2were included. To use as a control group in the analyses, a set of ‘control units’ were selected, whichincluded all enrolments that met all criteria in Table 2, excluding enrolments in communications units.Further detail about the units is shown in the results section.Table 2. Student enrolment inclusion criteriaCategoryYearCampusAttendance ModeYear LevelUnit LevelResult TypeCoursework or ThesisFor Degree EnrolmentCriteria2017 enrolments onlyEnrolments at the University’ main campus onlyFace-to-face enrolments only (online students are excluded)First-year units onlyUndergraduate units only (enabling and postgraduate units are excluded)Exclude units graded only as pass or fail (not marked out of 100)Coursework type units only. Thesis-type units are excluded.Students studying ‘not for degree’, e.g. doing a single unit, are excluded3. METHODOLOGYThis section summarises the methodology used to create the dataset. The primary purpose of the dataset wasto enable academic leaders to investigate unit outcomes, enabling investigation of the research questions wasa secondary goal. The aim for the workflow was to rapidly develop a rapid prototype that could be quicklyand easily modified and updated with new data and was easy for staff to engage with and can be summarisedin the following steps:1. Explore Data: find data sources and gain understanding of the data2. Extract Data: extract data from the source systems3. Combine Data: merge data to into a single table and derive new columns4. Finalise Data: add calculated columns and aggregate data5. Share Data: prepare data for dissemination and share it with academic leaders6. Analyse Data: use the data to answer the research questions1. Explore DataSMS ApplicationOracle SQLDeveloper2. Extract DataPython3. Combine DataJupyter Notebook(Python)4. TransformDataTableau5. Share DataExcel6. Analyse DataTableauFigure 1. Data workflow155
ISBN: 978-989-8533-81-4 20181. Explore DataGain an understanding data available, its structure, accuracy, and reliability, by exploring the StudentManagement System (SMS) application, and consulting with domain experts. Find the required tables andcolumns by referring to the database documentation and exploring the database using a database IDE (OracleSQLDeveloper) in this case. The Result of this step will be a list of tables and columns, their sources, andnotes/diagrams about the data, and how the tables relate to each other, i.e. primary and foreign keys.2. Extract DataExtract the data with Python script using the ‘Pandas’ ‘read sql’ module to connect to the database (withlogin credentials), extract the tables, and save them as CSV files on a local (encrypted) storage device.3. Combine DataCombine the data into a single table with one row per enrolment. A Jupyter Notebook, using the ‘Pandas’and ‘NumPy’ libraries, was the tool of choice for this step. Within in the notebook, import the CSV files,then sequentially transform and merge the tables into a single data frame. Use ‘groupby’ commands to derivenew columns which require constructing from multiple rows (e.g. derive number of attempts by counting thenumber of rows with an enrolment in the same unit for the same student). Validate the data by running testcommands to check for issues such as duplicates and inconsistencies between rows. Perform a ‘sanity test’ ofthe data by checking whether the data is sensible. Complete a final manual ‘spot check’ of the data byvalidating a selection of rows with the SMS Application. Correct any issues, re-execute the code, and repeat.Lastly, rename columns save as a CSV file on a local (encrypted) storage device.Steps 1 to 3 will differ significantly for different institutions, but the combined table produced by stepshould be similar to the structure described in Table 3. Producing a dataset with these fields can beconsidered the goals of steps 1 to 3.Table 3. Combined data structureGroupEnrolment: (unique combination todefine an enrolment in a unit)Course Details (determined by thecourse (degree) the student is studyingUnit Details (determined by the unitcode)Enrolment Details (details about astudent’s enrolment in a unit)Student Details (unique per student)ColumnsStudent ID, Unit Code (unique unit identifier), Year, StudyPeriod (Semester/Term)Course (degree) code and title, Undergraduate or Postgraduatecourse, ‘Not for Degree’ course flag, Basis for Admission(determines entry pathway)Unit title, Unit owning Faculty and School, Year Level,Postgraduate or Undergraduate unit, Campus, Internal or FullyOnlineAttempt Number, Enrolment Status (Pass/Fail/Withdraw),Grade and MarkInternational or Domestic Student flag4. Transform DataTransform the combined data into the final dataset, by connecting to the combined CSV file from aTableau workbook and the set data types for each column. Create calculated columns to flag rows as 1 or 0,based on existing columns (e.g. ‘domestic student pass’, or ‘zero mark’). Create a table and add rows for unit,campus, faculty, year, and semester. Set the granularity of the dataset by adding or removing rows(e.g. remove semester for a more aggregated dataset or add ‘attendance mode’ to create separate rows foronline and face-to-face enrolments). Add filters to remove student enrolments which should not be included,e.g. ‘not for degree’ students. Validate the calculated columns by creating tables which flag inconsistencies,e.g. count rows which are flagged as both ‘passed’ and ‘zero mark’ (should be none).This step could be done within other spreadsheet tools, or within the Jupyter Notebook (although this maybe more time-consuming). One of the transformed datasets, focusing on students with multiple attemtps isshown in Table 4. Different columns can be used to focus on different information (e.g. international ordomestic student statistics), but the ‘Unit and course information’ and ‘Basic Enrolment Statistics’ canremain.156
15th International Conference on Cognition and Exploratory Learning in Digital Age (CELDA 2018)Table 4. Transformed data structure, with data for multiple attemptsGroupUnit and Course DetailsBasic Enrolment StatisticsFirst Attempt StatisticsSecond Attempt StatisticsThird Attempt StatisticsColumnsUnit Code, Unit Title, Faculty and School, Campus,Postgraduate or Undergraduate Unit, Year and Study PeriodTotal Enrolments, Passes, Pass %, Fails, Fail %, Withdrawals, Withdraw%No. on 1st Attempt, 1st attempt pass %, 1st attempt fail %, 1st attemptwithdrawal %, 1st attempt avg. markNo. on 2nd Attempt, 2nd attempt pass %, 2nd attempt fail %, 2nd attemptwithdrawal %, 1st attempt avg. markNo. on 3rd Attempt, 3rd attempt pass %, 3rd attempt fail %, 3rd attemptwithdrawal %, 3rd attempt avg. mark5. Share DataCreate a shareable from of the transformed datasets by copying data from Tableau text tables intoseparate tabs of a ‘master’ Excel workbook. Add a description tab with instructions, explanations of the data,and known issues. Create a separate workbook for each area by deleting data for other areas. Email the Excelworkbooks to authorised personnel, for distribution more widely in their areas.6. Analyse DataThe combined dataset produced in step 3 was used to conduct the analysis for this paper (with some ofthe transformed columns from step 4), the data was filtered to the scope in Table 2, and structured to createthe aggregated tables shown in the results section, instead of to produce the more aggregated, unit level data.4. RESULTSThis section presents the results of analysing the research questions presented in section 2. The findingspresented here cannot be generalised to apply in all contexts, and can vary significantly when looking atindividual units, and when looking at different types of units. These results are a sample only and are notintended to provide definitive answers to questions that are known to be inherently complex.For context in the analyses to follow, overall enrolment and completion statistics for the communicationsunits and control group units are shown in Table 5.Table 5. Overall completion statistics for the communications units, and control group unitsNumber of UnitsEnrolmentsPassesFailsWithdrawalsControl Units24852565 (100.0%)41433 (78.8%)8280 (15.8%)2842 (5.4%)Communications Units67726 (100.0%)6467 (83.7%)863 (11.2%)396 (5.1%)Difference 4.9%-4.6%-0.3%RQ1a: Is there a difference in pass rates between international students and domestic students who studied afirst-year communications unit in 2017?RQ1b: If there is a difference in pass rates, is this difference consistent with other first-year units?The completion statistics for international students and domestic students in the communications units andcontrol units are shown in Table 6.RQ1a Answer: The results show that the pass rates in the communications units is lower for internationalstudents compared to domestic students (-3.8%). This lower pass rate for international students is accountedfor, mainly by the higher fail rate ( 7.5pp), which is partly offset by the lower withdrawal rate.157
ISBN: 978-989-8533-81-4 2018Table 6. Completion statistics for international studentsCommunication UnitsControl ic Students6508 (100.0%)5487 (84.3%)650 (10.0%)371 (5.7%)International Students1218 (100.0%)980 (80.5%)213 (17.5%)25 (2.1%)EnrolmentsPassesFailsWithdrawals47706 (100.0%)37725 (79.1%)7221 (15.1%)2760 (5.8%)4859 (100.0%)3718 (76.5%)1086 (21.8%)82 (1.7%)Difference-3.8pp 7.5pp-3.6pp-2.6pp 6.7pp-4.1ppRQ1b Answer: The results show that the pass rates are lower for international students more in the controlunits, however, the difference is more pronounced in the communications units (-3.8pp compared to -2.6pp).RQ2: Were students who attempted, but did not pass a first-year communications unit in 2017, less likely tohave completed their attempt, compared to students who studied other first-year units?‘Non-completions’ can be classified into four categories:1. ‘Fail (complete & low mark)’ – fail based on the student’s mark (out of 100) being too low.2. ‘Fail (incomplete & non-zero mark)’ – student achieved a non-zero mark and failed on the basis ofnot meeting all pass criteria (e.g. student did not submit all compulsory assessments).3. ‘Fail (incomplete & zero mark)’ – student achieved a zero mark and failed on the basis of notmeeting all pass criteria (these students likely have not participated in the unit, despite beingenrolled).4. ‘Withdrawal’ – students decided to drop out of the unit after the cut-off date for fees (census date).A breakdown of the non-completion statistics, as a proportion of all non-passing students, for the controlunits and communications units is shown in Table 7.Table 7. Non-completion statisticsMeasureAll non-passes (withdrawals fails)Fails (complete & low mark)Fails (incomplete & non-zero mark)Fails (incomplete & zero mark)WithdrawalsControl Units11155 (100.0%)5006 (44.9%)2156 (22.6%)786 (7.0%)2847 (25.5%)CommunicationsUnits1259 (100.0%)344 (27.3%)420 (33.4%)99 (7.9%)396 (31.4%)Difference-17.6pp 10.8pp 0.9pp 5.9ppRQ2 Answer: The results show that students who attempted but did not pass a communications unit weresignificantly less likely to have completed their attempt (-17.6pp), than students who studied other units. Thedifference is accounted for by the higher rates of ‘fails with incomplete attempts & non-zero mark’( 10.8pp), ‘fails with zero mark’ ( 0.9pp), and
The issue of student attrition is related closely linked to academic performance in units. One study at another Australian institution found that “first year academic performance is a much stronger predictor of attrition than any demographic factors or educational background” (Andrew Harvey,