Transcription
Using the Design for Six Sigma (DFSS)Approach to Design, Test, and Evaluateto Reduce Program RiskDr. Mark J. KiemeleAir Academy AssociatesNDIA Test and Evaluation SummitVictoria, British ColumbiaFebruary 24-27, 2003AirAcademyAssociatesCopyright2003
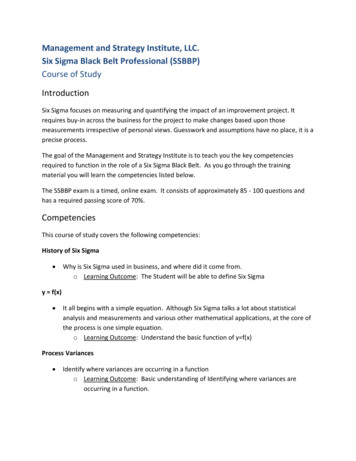
Agenda A Brief Six Sigma Primer The What and Why of Design forSix Sigma (DFSS) The DFSS ProcessAirAcademyAssociatesCopyright20031
Six Sigma DefinedOriginally: Metric Based on the Statistical Measure CalledStandard DeviationExpanded To:WORLD CLASS QUALITYProviding aLowSpecHighSpecBETTER product or service,FASTER, andat a LOWER COSTthan our competition.VARIATION is the enemy!AirAcademyAssociatesCopyright2003"Always know the language of the enemy."2
Graphical Meaning of a Distributiony (measure of yright20033
Graphical Meaning of yy (measure of performance)130140150160170y 153AirAcademyAssociatesCopyright20034
Graphical Meaning of Points of InflectionPoint of InflectionPoint of Inflectiony (measure of performance)130140150160170y 153AirAcademyAssociatesCopyright20035
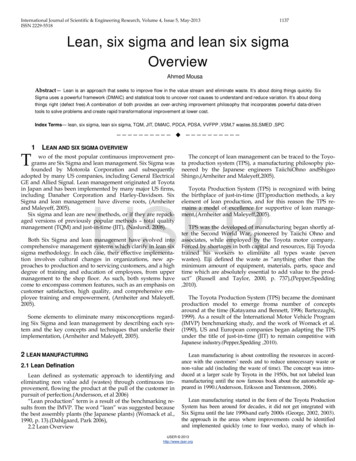
Graphical Meaning of σσ distance from the center of the distribution to a point of inflectionPoint of InflectionσFor this example,σ 7 160 - 153y (measure of performance)130140150160170y 153AirAcademyAssociatesCopyright20036
Graphical View of Variation-6σ-5σ-4σ-3σ-2σ-1σ0 1σ 2σ 3σ 4σ 5σ AirAcademyAssociatesCopyright2003Typical Areas under the Normal Curve7
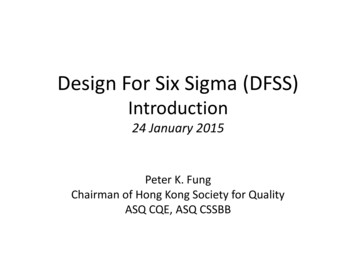
Graphical View of Variation andSix Sigma PerformanceThe Sigma Capability of a process performance measure compares the Voice of theProcess with the Voice of the Customer, and it is defined as follows:The number of Sigmas between the center of a process performance measure distributionand the nearest specification limitLowerSpecificationLimit3σ ProcessUpperSpecificationLimitDetermined bythe customer-6σ -5σ -4σ -3σ -2σ -1σWASTE6σ Process0 1σ 2σ 3σ 4σ 5σ 6σWASTEAirAcademyAssociatesCopyright20033σ Process Centered Process is WIDERthan thespecifications,causing waste andDetermined by cost of poor qualitythe customer6σ Process Centered Process FITS wellwithin thespecifications, soeven if the processshifts, the values fallwell withintolerances-6σ -5σ -4σ -3σ -2σ -1σ 0 1σ 2σ 3σ 4σ 5σ 6σ8
Six Sigma Measures Process CapabilitySigma Capability is a measure of processcapability. It is correlated to the defect rate andthe complexity of the process/product.σ Capability yAssociatesCopyright2003DPMODefects per MillionOpportunitiesYield is the probability that whatever weare producing (manufactured part, PO,shipped part, etc.) will pass through theentire process without rework andwithout defects.RTY69.1%93.3%99.4%99.97%99.99966%Rolled ThroughputYieldSix Sigma is a standard of Excellence.It means less than 4 Defects per Million Opportunities.9
Relationship Between Lean and Six SigmaOVERALL YIELD vs SIGMA# of 70003800070000150000 -------------------(Distribution Shifted 1.5σ) Use forBenchmarking 2475.8850.151.910.01 60.000Source: Six Sigma RESEARCH INSTITUTEMotorola University Motorola, Inc.10
How Process Capability Impacts CycleTime and Resource AllocationStep XLSStartStep YLSUSNo DefectDefectUSNo ixFix.*FixFixEvery Time a Defect is Created During a Process (Step), it Takes Additional Cycle Timeto Test, Analyze, and Fix.AirAcademyAssociatesCopyright2003* These Non-Value Added Activities Typically Require Additional Floor Space, CapitalEquipment, Material, and People.11
Six Sigma Project PhasesAirAcademyAssociatesCopyright2003 efine the problem / defects easure the current performance level nalyze to determine the root causes ofthe problem / defects mprove by identifying and implementingsolutions that eliminate root causes ontrol by monitoring the performance ofthe improved process12
What Have We Learned From Six Sigma?Total CostTypicalSix Sigma BarrierDFSSOptimal PointAirAcademyAssociatesCopyright20032345Sigma Rating6713
Food for Thought.the systems and products thatdeliver value to our customers areperfectly designed to achieve theresults we are getting today.AirAcademyAssociatesCopyright200314
DFSS – What is it?Design For Six Sigma is: A methodology for designing new products and/orprocesses. A methodology for re-designing existing productsand/or processes. A way to implement the Six Sigma methodology asearly in the product or service life cycle as possible. A way to exceed customer expectations. A way to gain market share. A strategy toward extraordinary ROI.AirAcademyAssociatesCopyright200315
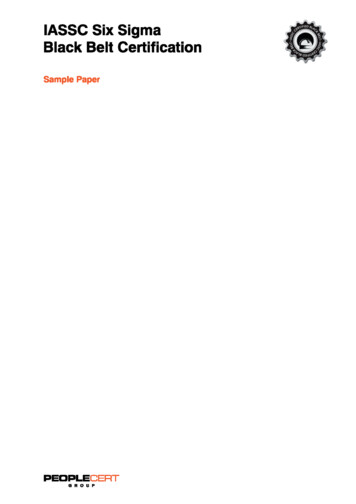
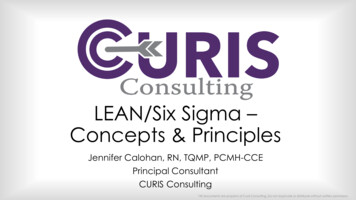
Why DFSSRelative Cost to Makea Design Change"Classic" Six Sigmafocuses here1000100DFSS focuses here101ResearchDesignDevelopmentProductionProduct StageAirAcademyAssociatesCopyright2003 "Design"Design in"in" qualityquality whenwhen costscosts areare lowestlowest ShowShow customerscustomers “Six“Six Sigma”Sigma” productsproducts rightright fromfrom thethe startstart16
The Big itionalSix lidateIsImprovementSufficient in Yield,CTC's, CycleTime?YesControl17
The Benefits of DFSS Goal: Create new game-changing products andservices which––––Wow customers with 6σ performance on their CTCsHave 6σ reliabilityHave 6σ manufacturabilityHave high performance/cost ratios Payoffs– Quality designed in from the start– Revenue growth: customer delight, market share, volume, price– Warranty cost river forfor growthgrowth18
The Opportunity of DFSSResourcesRequiredRevenueGeneratedDFSS Vision:Predictive DesignRevenuew/ DFSSRevenuew/o DFSSLaunch LaunchAirAcademyAssociatesCopyright2003 Early problem identification; solution when costs low Faster market entry: earlier revenue stream, longerpatent coverage Lower total development cost Robust product at market entry: delighted customers Resources available for next game-changerTimePre-DFSS: Reactive Design Unhappy customers Unplanned resource drain Skyrocketing costs Next product compromised UpfrontUpfront investmentinvestment isis mostmost effectiveeffective andand efficientefficient ShowShow customerscustomers “6s“6s”” productsproducts rightright fromfrom thethe startstart19
The Vision of DFSSReactiveDesign QualityFrom Evolving designrequirements Extensive designrework Product performanceassessed by “buildand test” Performance andproducibilityproblems fixed afterproduct in use Quality “tested sign QualityDFSSTo Disciplined CTCflowdown Controlled designparameters Product performancemodeled and simulated Designed for robustperformance andproducibility Quality “designed in” 6 s products everywhere Revolutionize Engineering20
DFSS ProcessIdentifyVoice of CustomerSystems Engineering andRequirements FlowdownDesignTransfer Function Strategic PlanBenchmark ResultsPrioritized Customer RequirementsPrioritized CTC'sHouse of Quality #1Initial Performance Scorecard For each CTC, Identify Design ParametersHouse of Quality #2Prioritized Product Design CharacteristicsTransfer Function(s)Preliminary Design Risk AssessmentPerformance/Process Scorecard Process Capability StudiesReliability StudiesCapability FlowupOptimal DesignTolerances on X'sComplete ScorecardDesign for RobustPerformanceTolerance AllocationOptimizeDesign for ManufacturabilityProduct Capability Test and ValidateValidateOKYesCelebrate Capable Product and ProcessSensitivity AnalysisAssess Performance, Reliability, and RisksNo* The IDOV four-phase DFSS process originated with Dr.Norm Kuchar at GE CRD and is used with permission.21
Systems EngineeringMain SystemAutomobileSub SystemAssembliesPartsDrive TrainEngineSpark PlugsBodyElectricalTransmissionValvesInjectors Complex products may require the "Divide and Conquer"approach. Flow the system requirements down and roll the capability up.AirAcademyAssociatesCopyright2003 System Engineers are the masters of the scorecard and maketradeoff decisions.22
DFSS and Six SigmaProd. DesignCharacteristicsPerformanceCTC'sMfg. ProcessCharacteristicsMfg. ProcessControlHouse ofQuality#3Mfg. ProcessCharacteristicsHouse ofQuality#2Prod. DesignCharacteristicsHouse ofQuality#1Functional Req.(CTC's)CustomerExpectationsCustomer Req.Functional Req.(CTC's)ProductDesign CTC'sHouse ofQuality#4ProcessDesign CTC'sMfg. keting FeaturesDesign Engineering Performance Quality Performance Cost Reliability CostMfg. Engineering Manufacturability CostManufacturing SPC Process CapabilityDFSSSix Sigma23
Scorecard ComponentsInputDecision?NoYesProcess yAssociatesCopyright2003SCORECARD24
Scorecard ExampleSOLENOID PART SCORECARDSOLENOID PROCESS SCORECARDSOLENOID PERFORMANCE SCORECARDAirAcademyAssociatesCopyright200325
Solenoid Scorecard (cont.)Scorecard Summary# Steps/Parts4Total .432PartST Sigma LT Copyright200326
DFSS ToolsIdentifyProject CharterStrategic PlanDesignAssign Specificationsto CTC’sCopyright2003ValidateHistogramSensitivity AnalysisDistributional AnalysisGap AnalysisCross-Functional TeamCustomer InterviewsEmpirical Data DistributionFMEAVoice of the CustomerFormulate Design ConceptsExpected Value Analysis (EVA)Fault Tree AnalysisBenchmarkingPugh Concept GenerationAdding Noise to EVAControl PlanKANO’s ModelTRIZ or ASITNon-Normal Output Distributions PF/CE/CNX/SOPQuestionnairesPugh Concept SynthesisDesign of ExperimentsRun/Control ChartsFocus GroupsControlled ConvergenceMultiple Response OptimizationMistake ProofingInterviewsFMEARobust Design DevelopmentMSAInternet SearchFault Tree AnalysisUsing S-hat ModelHistorical DataBrainstormingUsing Interaction PlotsQuality Function Deployment QFDAirAcademyAssociatesOptimizeReaction PlanUsing Contour PlotsPairwise ComparisonScorecardParameter DesignDesign of ExperimentsTransfer FunctionTolerance AllocationSpecify CTC’sDesign of ExperimentsReducing Standard DeviationsPerformance ScorecardDeterministic SimulatorsFlow ChartsConfidence IntervalsDesign For ManufacturabilityFMEAHypothesis TestingMistake ProofingVisualizationMSAProduct Capability PredictionComputer Aided DesignPart, Process, and SW ScorecardComputer Aided EngineeringRisk AssessmentHigh Throughput TestingReliabilityof InputsMultidisciplinary Design Optimization (MDO)27
High Throughput Testing (HTT)(for all two-way combinations)Full Factorial 8100 runsHTT 27 runsAirAcademyAssociatesCopyright20035 Levels3 LevelsMotherboard Ram3 LevelsBIOS3 LevelsCD5 LevelsMonitor3 LevelsPrinter2 LevelsVoltage2 00 by 600800 by 6001024 by 7681024 by 768800 by 6001024 by 7681024 by 768800 by 600800 by 600800 by 6001024 by 768800 by 600800 by 600800 by 6001024 by 7681024 by 768800 by 600800 by 600800 by 600800 by 600800 by 600800 by 600800 by 600800 by 600800 by 600800 by 600800 by 600128 MB256 MB512 MB128 MB256 MB256 MB512 MB128 MB256 MB512 MB128 MB256 MB128 MB256 MB512 MB512 MB128 MB512 MB512 MB128 MB128 MB128 MB128 MB128 MB128 MB128 MB128 MB28
Tolerance Allocation ExampleR1 N (50,22)ImpedanceZ R2 N(100,22 )ExampleR1 R2R1 R2LSL 31USL 35AirAcademyAssociatesCopyright2003If we were able to change a resistor’s standard deviation, whichresistor, R1 or R2, would have the greater impact on the dpm of Z(impedance)?29
Tolerance Allocation Example (cont.)A reduction of R1 by 50% reduces dpm by an order of magnitudeX, while R2 has little impact.Tolerance Allocation TableN 10,000 (in defects per million)Impedance TableR1R2-50% Sigma372.4034,683-25% Sigma8,05836,849-10% Sigma23,90635,663Nominal39,22039,657 10% Sigma59,50837,556 25% Sigma92,39847,317 50% Sigma148,11346,801A reduction of R1's standard deviation by 50% combined with anincrease in R2's standard deviation by 50%2R1 N(50, 1 )AirAcademyAssociatesR2 N(100, 3 )Copyright2003results in a dpm 1,254.230
Examples of Simulation and HighPerformance Computing (HPC)PowerSimulation of stress and vibrations of turbineassembly for use in nuclear power generationAutomotiveSimulation of underhood thermal cooling for decreasein engine space and increase in cabin space and comfortAerospaceEvaluation of dual bird-strike on aircraft enginenacelle for turbine blade containment 3Evaluation of cooling air flow behaviorinside a computer system chassis31
Examples of Computer Aided Engineering(CAE) and Simulation SoftwareMechanical motion: Multibody kinetics and dynamicsADAMS DADSImplicit Finite Element Analysis: Linear and nonlinearstatics, dynamic responseMSC.Nastran , MSC.Marc ANSYS Pro MECHANICAABAQUS Standard and ExplicitADINAExplicit Finite Element Analysis : Impact simulation,metal formingLS-DYNARADIOSSPAM-CRASH , PAM-STAMPAirAcademyAssociatesCopyright2003General Computational Fluid Dynamics: Internal andexternal flow simulationSTAR-CDCFX-4, CFX-5FLUENT , FIDAP PowerFLOW 32
Examples of Computer Aided Engineering(CAE) and Simulation Software (cont.)Preprocessing: Finite Element Analysis andComputational Fluid Dynamics mesh generationICEM-CFDGridgenAltair HyperMesh I-deas MSC.PatranTrueGrid stprocessing: Finite Element Analysis andComputational Fluid Dynamics results visualizationAltair HyperMesh I-deasMSC.PatranFEMBEnSightFIELDVIEWICEM CFD Visual3 2.0 (PVS)COVISE33
Multidisciplinary Design Optimization(MDO): A Design Process ApplicationAirAcademyAssociatesCopyright200334
MDO: A Design Improvement ProcessAirAcademyAssociatesCopyright200335
Environments Where MDO/HPC Is BeneficialDesign of complex vehicles & systems results in asimulation environment with: A high number of design variables A substantial number of design subsystems andengineering disciplines Interdependency and interaction between the subsystems High resolution, complex models across severalengineering disciplinesAirAcademyAssociatesCopyright200336
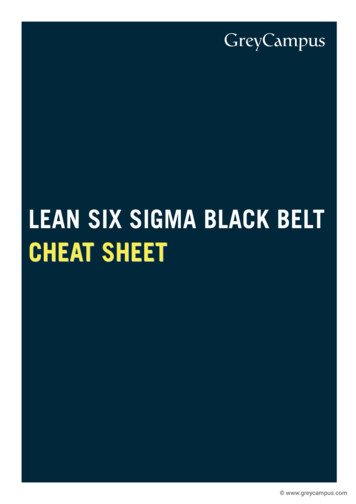
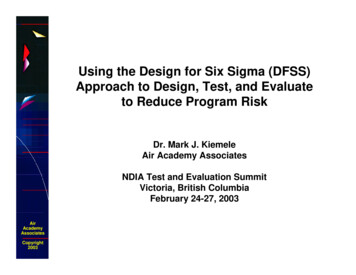
Risk Assessment Assess risks of key areas: technology, cost, schedule, market, etc.Use formal tools: FMEA, etc.Quantify risks: probability of failure and impact of failureFormulate responsive projects to reduce high risksTrack progress with quantitative risk “waterfall”Tracking RiskProbability of FailureQuantifying RiskRisk RatingHigh 55 15 25339 15Low 1135135LowHigh199719981999AirAcademyAssociatesO Significant riskCopyright2003G Proceed with cautionY Fix before production200120022003HIGHInvestment authorization obtained by 2 Qtr 98 .Tooling in place for mfg trial by 9/98.SIGNIFICANTAcceptable root stress achieved for selected fillet.HCF degradation not exceeded.Mat’l prop tests validate estimates prior to product design release.Instability does not occur or can be avoided in all start-up& shutdown modes, substantiated by rig & product tests.Rig test stresses within allowable limits.MODERATEImpact of FailureR Show stopper2000LOWTollgates &MilestonesPredefined RiskAcceptance LevelRigTestBlade bench test validates vibration analysisfor root fillet.Instrumented engine substantiates rig test.Product validation test within allowablelimits.Rig ProductTestTestProductDelivery37
Characteristics of a SuccessfulDFSS Implementation Commitment and leadership from the top Measurable, “stretch” goals for each project Accountability for project success Involvement and support of everyone Training and implementing an extremely powerful, yeteasy-to-use toolset for predicting quality and makingtradeoffs before the product or process is even builtAirAcademyAssociatesCopyright2003 It’sIt’s veryvery easyeasy toto focusfocus onon thethe lastlast item.item.But,But, thethe firstfirst fourfour –– involvinginvolving leadershipleadership andand culturalculturalchangechange –– areare eveneven moremore criticalcritical forfor successsuccess38
How Process Capability Impacts Cycle Time and Resource Allocation Desired End State Desired End State. . FixFix * LSUS No Defect TestTest . – Revenue growth: customer delight, . Academy Associates 2003)))) .