Transcription
ARMSTRONG WORLD INDUSTRIES, INC.2014 ANNUAL REPORTArmstrong World Industries, Inc.P. O. Box 3001Lancaster, PA 17604-3001www.armstrong.com
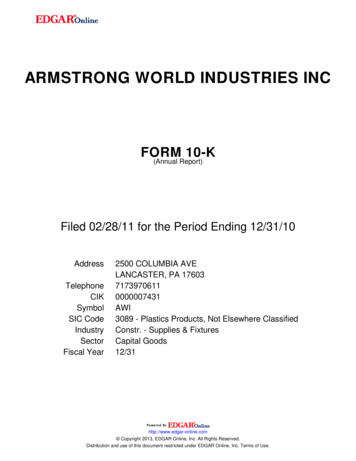
SHARE PERFORMANCE GRAPHThe following graph shows the cumulative total shareholder return for Armstrong World Industries, Inc. CommonShares (NYSE: AWI) during the period from December 31, 2009 to December 31, 2014 . The graph also shows thecumulative returns of the NYSE Composite Index and a building materials peer group composed of the companieslisted below the chart. The performance shown in the chart should not be considered indicative of futureperformance.COMPARISON OF CUMULATIVE TOTAL RETURNArmstrong World Industries, Inc.NYSE Composite IndexPeer Group Index 300 275 250 225 200 175 150 125 100 75 50 25 0ASSUMES 100 INVESTED ON DEC 31, 2009ASSUMES DIVIDENDS REINVESTEDFISCAL YEAR ENDING DEC. 31, 2014Company/Market/Peer GroupArmstrong World Industries, Inc.NYSE Composite IndexPeer Group Index12/31/2009 100.00 100.00 100.00Period Ending12/31/2010 12/31/2011 147.60 150.58 113.76 109.70 123.79 120.25The client-selected peer group is composed of the following companies:% of Total Market CapAmerican Woodmark Corporation1%Interface, Inc.2%Masco Corporation20%Mohawk Industries, Inc.13%Owens-Corning, Inc.13%Sherwin-Williams Company28%Stanley Black & Decker, Inc.17%USG Corporation6%100%12/31/2012 204.66 127.52 186.1212/31/2013 232.41 161.19 234.8512/31/2014 206.23 172.25 282.83
UNITED STATESSECURITIES AND EXCHANGE COMMISSIONWashington, D.C. 20549FORM 10-K(Mark One)ANNUAL REPORT PURSUANT TO SECTION 13 OR 15(d) OF THE SECURITIES EXCHANGEACT OF 1934For the fiscal year ended December 31, 2014ORTRANSITION REPORT PURSUANT TO SECTION 13 OR 15(d) OF THE SECURITIESEXCHANGE ACT OF 1934For the transition period fromtoCommission File Number 1-2116ARMSTRONG WORLD INDUSTRIES, INC.(Exact name of registrant as specified in its charter)Pennsylvania(State or other jurisdiction ofincorporation or organization)23-0366390(I.R.S. EmployerIdentification No.)2500 Columbia Avenue, Lancaster, Pennsylvania17603(Zip Code)(Address of principal executive offices)Registrant’s telephone number, including area code (717) 397-0611Securities registered pursuant to Section 12(b) of the Act: NoneSecurities registered pursuant to Section 12(g) of the Act:Title of each classCommon Stock ( 0.01 par value)Indicate by check mark if the registrant is a well-known seasoned issuer, as defined in Rule 405 of the Securities Act. Yes NoIndicate by check mark if the registrant is not required to file reports pursuant to Section 13 or Section 15(d) of the Act. YesNoIndicate by check mark whether the registrant (1) has filed all reports required to be filed by Section 13 or 15(d) of the Securities Exchange Act of1934 during the preceding 12 months, and (2) has been subject to such filing requirements for the past 90 days. Yes NoIndicate by check mark whether the registrant has submitted electronically and posted on its corporate Web site, if any, every Interactive Data Filerequired to be submitted and posted pursuant to Rule 405 of Regulation S-T (§232.405 of this chapter) during the preceding 12 months (or for suchshorter time period that the registrant was required to submit and post such files). Yes NoIndicate by check mark if disclosure of delinquent filers pursuant to Item 405 of Regulation S-K is not contained herein, and will not be contained, tothe best of registrant’s knowledge, in definitive proxy or information statements incorporated by reference in Part III of this Form 10-K or anyamendment to this Form 10-K.Indicate by check mark whether the registrant is a large accelerated filer, an accelerated filer, a non-accelerated filer, or a smaller reporting company.See the definitions of “large accelerated filer,” “accelerated filer” and “smaller reporting company” in Rule 12b-2 of the Exchange Act (Check one):Large accelerated filerAccelerated filerNon-accelerated filerSmaller reporting companyIndicate by check mark whether the registrant is a shell company (as defined in Rule 12b-2 of the Act). YesNoThe aggregate market value of the Common Stock of Armstrong World Industries, Inc. held by non-affiliates based on the closing price ( 57.43 pershare) on the New York Stock Exchange (trading symbol AWI) of June 30, 2014 was approximately 2,596 million. As of February 17, 2015, thenumber of shares outstanding of registrant’s Common Stock was 55,130,109.Documents Incorporated by ReferenceCertain sections of Armstrong World Industries, Inc.’s definitive Proxy Statement for use in connection with its 2015 annual meeting of shareholders,to be filed no later than April 30, 2015 (120 days after the last day of our 2014 fiscal year), are incorporated by reference into Part III of this Form10-K Report where indicated.
TABLE OF CONTENTSSECTIONPAGESCautionary Note Regarding Forward-Looking Statements . 3PART IBusiness.Risk Factors.Unresolved Staff Comments.Properties.Legal Proceedings .Mine Safety Disclosures.4814151515PART IIMarket for the Registrant’s Common Equity, Related Stockholder Matters and Issuer Purchases of EquitySecurities .Item 6.Selected Financial Data .Item 7.Management’s Discussion and Analysis of Financial Condition and Results of Operations .Item 7A. Quantitative and Qualitative Disclosures about Market Risk.Item 8.Financial Statements and Supplementary Data .Item 9.Changes in and Disagreements with Accountants on Accounting and Financial Disclosure .Item 9A. Controls and Procedures.15161732348484Item 10.Item 11.Item 12.Item 13.Item 14.PART IIIDirectors, Executive Officers and Corporate Governance .Executive Compensation .Security Ownership of Certain Beneficial Owners and Management and Related Stockholder Matters.Certain Relationships and Related Transactions, and Director Independence .Principal Accountant Fees and Services.8586868686Item 15.PART IVExhibits and Financial Statement Schedules . 87Item 1.Item 1A.Item 1B.Item 2.Item 3.Item 4.Item 5.Signatures . 932
CAUTIONARY NOTE REGARDING FORWARD-LOOKING STATEMENTSCertain statements in this Annual Report on Form 10-K and the documents incorporated by reference may constitute forward-lookingstatements within the meaning of the Private Securities Litigation Reform Act of 1995. Those forward-looking statements are subjectto various risks and uncertainties and include all statements that are not historical statements of fact and those regarding our intent,belief or expectations, including, but not limited to, our expectations concerning our residential and commercial markets and theireffect on our operating results; our expectations regarding the payment of dividends, and our ability to increase revenues, earnings andEBITDA (as such terms are defined by documents incorporated by reference herein). Words such as “anticipate,” “expect,” “intend,”“plan,” “target,” “project,” “predict,” “believe,” “may,” “will,” “would,” “could,” “should,” “seek,” “estimate” and similarexpressions are intended to identify such forward-looking statements. These statements are based on management’s currentexpectations and beliefs and are subject to a number of factors that could lead to actual results materially different from thosedescribed in the forward-looking statements. Although we believe that the assumptions underlying the forward-looking statements arereasonable, we can give no assurance that our expectations will be attained. Factors that could have a material adverse effect on ourfinancial condition, liquidity, results of operations or future prospects or which could cause actual results to differ materially from ourexpectations include, but are not limited to: global economic conditions; construction activity; our announced plan to separate our flooring business from our ceilings (buildings products) business, and ourability to successfully complete such separation; competition; key customers; availability and costs of raw materials and energy; covenants in our debt agreements; our indebtedness; our liquidity; our exit from the European flooring business; our WAVE joint venture; environmental matters; international operations; strategic transactions; plant construction projects; availability of deferred tax assets; negative tax consequences; claims and litigation; labor; our intellectual property rights; outsourcing; costs savings and productivity initiatives; and other risks detailed from time to time in our filings with the Securities and Exchange Commission (the “SEC”),press releases and other communications, including those set forth under “Risk Factors” included elsewhere in thisAnnual Report on Form 10-K and in the documents incorporated by reference.Such forward- looking statements speak only as of the date they are made. We expressly disclaim any obligation to release publiclyany updates or revisions to any forward-looking statements to reflect any change in our expectations with regard thereto or change inevents, conditions or circumstances on which any statement is based.3
PART IITEM 1. BUSINESSArmstrong World Industries, Inc. (“AWI” or the “Company”) is a Pennsylvania corporation incorporated in 1891. When we refer to“we,” “our” and “us” in this report, we are referring to AWI and its subsidiaries. We are a leading global producer of flooring productsand ceiling systems for use primarily in the construction and renovation of residential, commercial and institutional buildings. Wedesign, manufacture and sell flooring products (primarily resilient and wood) and ceiling systems (primarily mineral fiber, fiberglassand metal) around the world.In August 2009, Armor TPG Holdings LLC (“TPG”) and the Armstrong World Industries, Inc. Asbestos Personal Injury SettlementTrust (“Asbestos PI Trust”) entered into agreements pursuant to which TPG purchased from the Asbestos PI Trust 7,000,000 shares ofAWI common stock and acquired an economic interest in an additional 1,039,777 shares pursuant to a forward sales contract. Duringthe fourth quarter of 2012, the Asbestos PI Trust and TPG together sold 5,980,000 shares in a secondary public offering. In the thirdquarter of 2013, the Asbestos PI Trust and TPG together sold 12,057,382 shares in another secondary public offering.Contemporaneously with this secondary public offering, we paid 261.4 million, including associated fees, to buy back 5,057,382shares, which we currently hold in treasury. The treasury share purchase was funded by existing cash and borrowings under our creditand securitization facilities. In November 2013, the Asbestos PI Trust physically settled the 2009 forward sales contract by deliveringto TPG the 1,039,777 shares in which TPG previously held an economic interest. Additionally, during the fourth quarter of 2013, theAsbestos PI Trust and TPG together sold an additional 6,000,000 shares. In March 2014, the Asbestos PI Trust and TPG together soldan additional 3,900,000 shares, which consisted of the last remaining 2,054,977 shares owned by TPG and an additional 1,845,023shares owned by the Asbestos PI Trust. We did not sell any shares and did not receive any proceeds from these offerings. As a resultof these transactions the Asbestos PI Trust currently holds approximately 17% of our outstanding shares and TPG no longer owns anyof our common stock.Recent DevelopmentOn February 19, 2015, our board of directors approved a plan to separate our flooring business from our ceilings (building products)business through a spinoff, which would result in two independent, publicly-traded companies.Reportable SegmentsWe operate four business segments - Building Products, Resilient Flooring, Wood Flooring and Unallocated Corporate. See Note 3 tothe Consolidated Financial Statements and Management’s Discussion and Analysis of Financial Condition and Results of Operationsin Item 7 of this Form 10-K for additional financial information on our reportable segments.MarketsWe are well positioned in the industry segments and markets in which we operate - often holding a leadership or significant marketshare position. The major markets in which we compete are:North American Residential. Our Building Products, Resilient Flooring and Wood Flooring segments sell products for use in thehome. Our ceiling products compete against mineral fiber and fiberglass products from other manufacturers, as well as drywall.Homeowners can choose from our vinyl and wood flooring products, for which we are North America’s largest provider, or from ourlaminate flooring products. We compete directly with other domestic and international suppliers of these products. Our flooringproducts also compete with carpet and ceramic products, which we do not offer.Our products are used in new home construction and existing home renovation work. Industry analysts estimate that existing homerenovation (also known as replacement / remodel) work represents approximately two-thirds of the total North American residentialmarket opportunity. Key U.S. statistics that indicate market opportunity include existing home sales (a key indicator for renovationopportunity), housing starts, housing completions, home prices, interest rates and consumer confidence. We believe there is somelonger-term correlation between these statistics and our revenue after reflecting a lag period of several months between a change inconstruction activity and our operating results. However, we believe that consumers’ preferences for product type, style, color,availability and affordability also significantly affect our revenue. Further, changes in inventory levels and/or product focus at nationalhome centers and building materials distributors can significantly affect our revenue.North American Commercial. Many of our products, primarily ceilings and resilient flooring, are used in commercial and institutionalbuildings. Our revenue opportunities come from new construction as well as renovation of existing buildings. Renovation work isestimated to represent approximately two-thirds of the total North American commercial market opportunity. Most of our revenuecomes from four major segments of commercial building – office, education, retail and healthcare. We monitor U.S. construction4
starts and follow project activity. Our revenue from new construction can lag behind construction starts by as much as eighteenmonths. We also monitor office vacancy rates, gross domestic product (“GDP”) and general employment levels, which can indicatemovement in renovation and new construction opportunities. We believe that these statistics, taking into account the time-lag effect,provide a reasonable indication of our future revenue opportunity from commercial renovation and new construction.Outside of North America. About 60% of our 2014 revenues generated outside of North America were in Europe and almost all werecommercial in nature. For the countries in which we have significant revenue, we monitor various national statistics (such as GDP) aswell as project activity. Revenues come primarily from new construction and renovation work.The following table provides an estimate of our segments’ 2014 net sales, by major markets.(Estimated percentages of individual segment’s sales)North AmericanResidentialNewBuilding ProductsResilient FlooringWood Flooring—5%35%Renovation5%40%65%North tside of %100%100%Management has used estimates in creating the table above because the end-use of our products is not easily determinable.Geographic AreasSee Note 3 to the Consolidated Financial Statements and Management’s Discussion and Analysis of Financial Condition and Resultsof Operations in Item 7 of this Form 10-K for additional financial information by geographic areas.CustomersWe use our reputation, capabilities, service and brand recognition to develop long-standing relationships with our customers. Weprincipally sell products through building materials distributors, who re-sell our products to retailers, builders, contractors, installersand others. In the commercial sector, we also sell to several contractors and to subcontractors’ alliances. In the North American retailchannel, which sells to end-users in the residential and light commercial segments, we have important relationships with nationalhome centers such as The Home Depot, Inc. and Lowe’s Companies, Inc. In the North American residential sector, we have importantrelationships with major home builders and buying groups.Approximately two-thirds of our consolidated net sales are to distributors. Sales to large home centers account for approximately 15%of our consolidated sales. Our remaining sales are to contractors and retailers.No customer accounted for 10% or more of our total consolidated net sales during the last three years.Working CapitalWe produce goods for inventory and sell on credit to our customers. Generally, our distributors carry inventory as needed to meetlocal or rapid delivery requirements. We sell the vast majority of our products to select, pre-approved customers using customary tradeterms that allow for payment in the future. These practices are typical within the industry.CompetitionWe face strong competition in all of our businesses. Principal attributes of competition include product performance, product styling,service and price. Competition in North America comes from both domestic and international manufacturers. Additionally, some ofour products compete with alternative products or finishing solutions. Our resilient, laminate and wood flooring products competewith carpet and ceramic products, and o
Trust (“Asbestos PI Trust”) entered into agreements pursuant to which TPG purchased from the Asbestos PI Trust 7,000,000 shares of AWI common stock and acquired an economic interest in an additional 1,039,777 shares pursuant to a forward sales contract. During the fourth quarter of 2012, the Asbestos PI Trust and TPG together sold 5,980,000 .