Transcription
Mineral Stability DiagramsandChemical Weathering of Feldspars
AlbiteJadeite QuartzdΔG ΔVdP - ΔSdTand G, S, V values for albite, jadeite and quartz to calculate theconditions for which ΔG of the reaction:Ab Jd QΔG 0Table 27-1. Thermodynamic Data at 298K and0.1 MPa from the SUPCRT DatabaseMineralS(J)G (J)V3(cm /mol)Method:Low 44,157-856,648100.0760.0422.688From Helgeson et al. (1978). from G values for each phase at 298K and 0.1 MPa calculate ΔG298, 0.1 for thereaction, do the same for ΔV and ΔS ΔG at equilibrium 0, so we can calculate an isobaric change in T that would berequired to bring ΔG298, 0.1 to 00 - ΔG298, 0.1 -ΔS (Teq - 298)(at constant P) Similarly we could calculate an isothermal change0 - ΔG298, 0.1 -ΔV (Peq - 0.1)(at constant T)
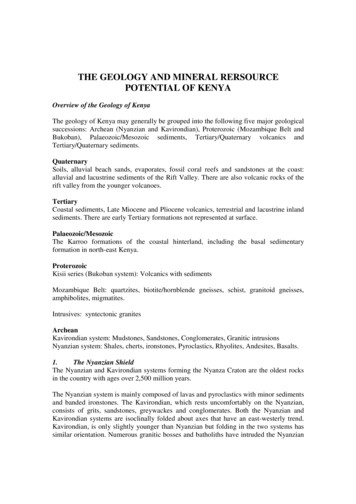
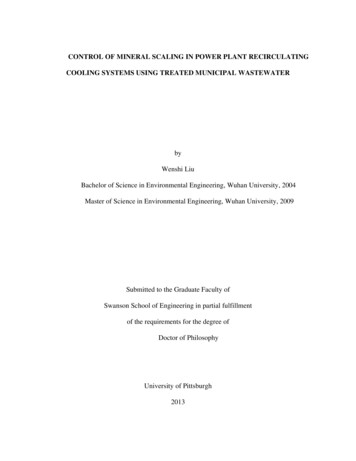
NaAlSi3O8 NaAlSi2O6 SiO2P - T phase diagram of the equilibrium curveHow do you know which side has which phases?Figure 27-1. Temperaturepressure phase diagram for thereaction: Albite Jadeite Quartz calculated using theprogram TWQ of Berman (1988,1990, 1991). Winter (2001) AnIntroduction to Igneous andMetamorphic Petrology. PrenticeHall.
Pick any two points on the equilibrium curvedΔG 0 ΔVdP - ΔSdTdP ΔSThusdT ΔVFigure 27-1. Temperaturepressure phase diagram for thereaction: Albite Jadeite Quartz calculated using theprogram TWQ of Berman (1988,1990, 1991). Winter (2001) AnIntroduction to Igneous andMetamorphic Petrology. PrenticeHall.
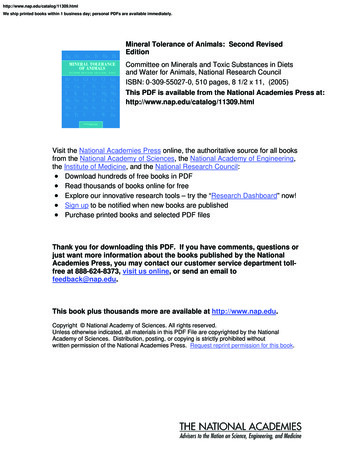
Does the liquid orsolid have the largervolume?High pressure favorslow volume, so whichphase should be stableat high P?Does liquid or solid have ahigher entropy?Figure 5-2. Schematic P-T phase diagram of a melting reaction.Winter (2001) An Introduction to Igneous and MetamorphicPetrology. Prentice Hall.We can thus predict that the slopeof solid-liquid equilibrium shouldbe positive and that increasedpressure raises the melting point .Recall decompression melting?High temperature favorsrandomness, so whichphase should be stable athigher T?
dΔG ΔVdP - ΔSdTDoes the liquid or solidhave the lowest G atpoint A?What about at point B?Figure 5-2. Schematic P-T phase diagram of a melting reaction.Winter (2001) An Introduction to Igneous and MetamorphicPetrology. Prentice Hall.The phase assemblage with the lowest G under a specific set ofconditions is the most stable
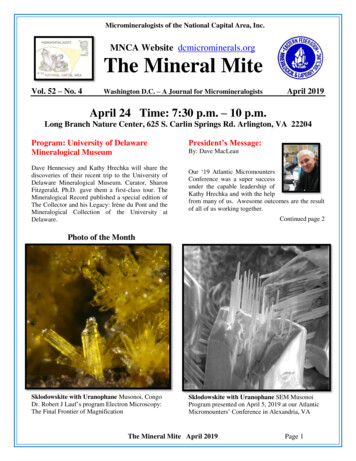
Free Energy vs. TemperaturedG VdP - SdT; at constant pressure: dG/dT -SBecause S must be ( ), G for a phase decreases as T increasesWould the slope for theliquid be steeper orshallower than that forthe solid?Figure 5-3. Relationship between Gibbs free energy andtemperature for a solid at constant pressure. Teq is the equilibriumtemperature. Winter (2001) An Introduction to Igneous andMetamorphic Petrology. Prentice Hall.
Free Energy vs. TemperatureSlope of GLiquid GSolidsince SS SLA: Solid more stable thanliquid (low T)B: Liquid more stable thansolid (high T)– Slope δP/δT -S– Slope S Slope LEquilibrium at Teq– GL GSFigure 5-3. Relationship between Gibbs free energy andtemperature for a solid at constant pressure. Teq is the equilibriumtemperature. Winter (2001) An Introduction to Igneous andMetamorphic Petrology. Prentice Hall.
Now consider a reaction, we can then use the equation:dΔG ΔVdP - ΔSdT(again ignoring ΔX)For a reaction of melting (like ice water) ΔV is the volume change involved in the reaction (Vwater - Vice)– similarly ΔS and ΔG are the entropy and free energy changesdΔG is then the change in ΔG as T and P are varied ΔG is ( ) for S L at point A (GS GL) ΔG is (-) for S L at point B (GS GL) ΔG 0 for S L at point x (GS GL)ΔG for any reaction 0 at equilibrium
Free Energy vs. PressureFigure 5-4. Relationship between Gibbs free energy and pressure forthe solid and liquid forms of a substance at constant temperature.Peq is the equilibrium pressure. Winter (2001) An Introduction toIgneous and Metamorphic Petrology. Prentice Hall.
Which species are in solution when microcline weathers to kaolinite?2KAlSi3O8 9H 2 O H Al2Si 2 O 5 (OH) 4 2K 4H 4SiO 4 This is a chemical weathering process that can occuron Earth’s surface and in groundwater .
2KAlSi3O8 9H 2 O H Al2Si 2 O 5 (OH) 4 2K 4H 4SiO 4STEP 1: calculate ΔGoR (appendix B) [(-906.84) 2(-67.70) 4(-312.66)] - [2(-894.9) 9(-56.687)] 7.103 kcalSTEP 2: calculate KK 10 ΔGRoK 101.364 7.1031.364 10 5.21
STEP 3: set up the equilibrium expression[ H 4 SiO4 ]4 [ K ]2 5.21 10[ H ]2STEP 4: take the log of the equilibrium expression4 log[ H 4 SiO4 ] 2 log[ K ] 2 log[ H ] 5.21STEP 5: collect terms4 log[ H 4 SiO4 ] 2(log[ K ] log[ H ]) 5.21STEP 6: re-arrange and divide by 2[K ]log 2 log[ H 4 SiO4 ] 2.60[H ]Equation of a liney mx b
2KAlSi3O8 9H 2 O H Al2Si 2 O 5 (OH) 4 2K 4H 4SiO 4 [K ]log 2 log[ H 4 SiO4 ] 2.60[H ] Any values off this line are not in equilibrium If log(H4SiO4) equilibrium reaction moves left sokaolinite becomes microcline. Microcline is stable andkaolinite is unstable If log(H4SiO4) required for equilibrium then kaolinite isstable and microcline is unstable
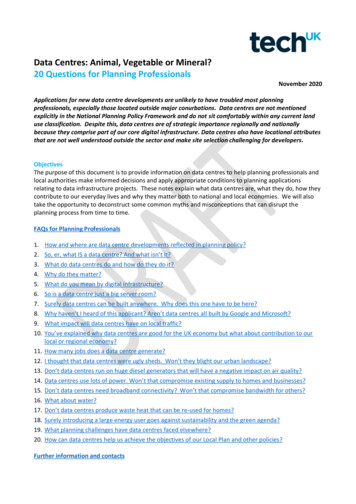
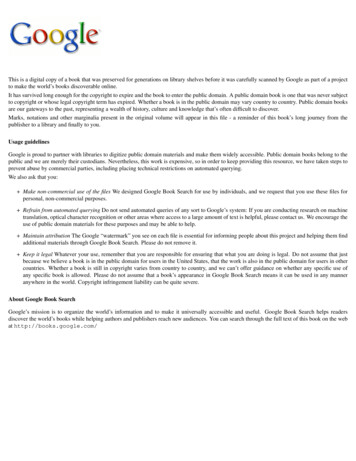
[K ]log vs. log[ H 4 SiO4 ][H ]Faure ch. 12, fig. 12.1, p. 174
What if the system is closed with a very low water:rock ratio?[K ]log and log[ H 4 SiO4 ] May change as reaction proceeds[H ]until equilibrium is reached thenkaolinite and microcline co-existin aqueous solution What if the system is open and the water:rock ratio is high?Then the reaction will have a tough time getting to equilibrium sothe reaction continues until either kaolinite or microcline is used upand the reaction goes to completion
2KAlSi3O8 9H 2 O H Al2Si 2 O 5 (OH) 4 2K 4H 4SiO 4 ΔH R 14.895The reaction is endothermic and the reaction consumesheat in the forward directionAn increase in temperature favors the conversion ofmicrocline to kaolinite and causes the equilibriumconstant to increase
Using the Van’t Hoff Equation:oΔH1 1oRlog K T log K T 2.3025 R T 298.15 Where is the equilibrium line at 35 C?Compare KT to KT:KT 10-5.21Plugging already calculated numbers into the Van’t Hoff eqn:KT 10-4.85Since 10-4.85 10-5.21, equilibrium shifts to the right in favorof kaolinite with increasing T
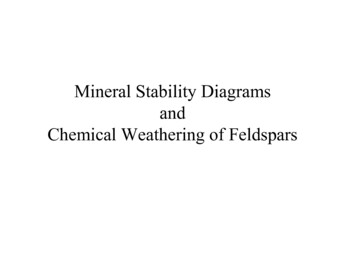
[K ]log vs. log[ H 4 SiO4 ][H ]Faure ch. 12, fig. 12.1, p. 174
[K ]log vs. log[ H 4 SiO4 ][H ]Stabilityfield forseawaterStabilityfield formostnaturalwatersFaure ch. 12, fig. 12.1, p. 174Clay minerals(e.g., kaolinite)deposited inthe ocean tendto take up K and are convertedto illite (musc.)or low-T feldspar(with enough time)
Phases involved in microcline weathering to kaoliniteSiO2 — Al2O3 — K2O — HCl — H2OThe system isn’t just kaolinite and microclineHow do you know which phases are stable during the reaction?You have to be able to identify ALL of the phases present:gibbsite, muscovite, smectite, pyrophyllite, and amorphous silica Understanding Figure 12.1 and log[H4SiO4] Measuring [K ], [H ] and [H4SiO4] allows stability field to beidentified
Complementarymineral stabilitydiagramsAdd in Na andCa2 to look at thestability of albiteand anorthite Ab albiteAn anorthiteC calciteG gibbsiteK kaolinitePa paragonitePy pyrophylliteSi amorphous silica
Solubilities of gibbsite and hematite
from G values for each phase at 298K and 0.1 MPa calculate ΔG 298, 0.1 for the reaction, do the same for ΔV and ΔS ΔG at equilibrium 0, so we can calculate an isobaric change in T that would be required to bring