Transcription
Survey of Network Performance Monitoring ToolsMd Jahangir Alam alam@wustl.eduAbstractThis survey paper focuses on introduction of Network Performance Monitoring tools that have been developedand implemented over the last few years. In this paper, I have made every attempt to list most of the wellknown tools and organize the taxonomy of tools based on some criteria that will help you to decide whetheryou choose such tools or not. In addition to I briefly discuss some tools that can be used in some wide area ofnetwork performance measurement. I hope this paper will enable people working on computer networks tochoose appropriate tools to meet their goals.Back to Prof. Raj Jain'a HomepageTable of Contents1 Introduction2 Monitoring Tools2.1 Tools Developed Between 1996 and 20062.2 Types of Tools3 Overview of Some Popular Tools3.1 BBMonitor3.2 CommView3.3 Advanced HOstMonitor3.4 GFI Network Server MOnitor3.5 Argus3.6 SmokePing3.7 Axence NetVision4 SummaryReferencesList of Acronyms1. IntroductionComputer networks are connecting millions of computers and computer users throughout the world. Thenetwork has become an infrastructure for many applications that affect our daily lives. It is very important thatthe computer network needs to be managed properly. Management of networking requires monitoring.Network monitoring is a set of mechanisms that allows network administrators to know instantaneous stateand long-term trends of a complex computer network [Chiu92]Various network performance monitoring tools have been developed and implemented over the last few years.These tools allow us to test different aspects of network performance and they are developed by individuals,commercial companies, non profit organizations, and government organizations. Some of them are free, opensource, while some of them are not.http://www.cse.wustl.edu/ jain/cse567-06/ftp/net perf monitors2/index.1 of 10
Various network performance monitoring tools have been developed and implemented over the last few years.These tools allow us to test different aspects of network performance and they are developed by individuals,commercial companies, non profit organizations, and government organizations. Some of them are free, opensource, while some of them are not.The rest of the paper is organized as follows. Section 2 lists Monitoring tools developed from 1996 to 2006,from most recent to old tools. Section 3 briefly discusses some selected popular tools. Section 4 concludes thereport.Back to Table of Contents2. Monitoring ToolsIn this section,first I have tried my best to list all available tools used in monitoring network performance.Then I organize the taxonomy of them based on some criteria. So people can find their appropriate tools fromthis list easily and efficiently.2.1 Tools developed between 1996 and 2006The following table lists network performance monitoring tools that have been developed and implementedbetween 1996 and 2006 [Cortell06][Zeadally03].Table 1: Network performance tools developed between 1996 and 2006Year Name of Tools1996 mrtg, NetNow, NetraMet, Network Probe Daemon, InterMapper, Lachesis, Optimal Networks, Digex1997INS Net Perf Mgmt survey, tcpspray, Mapnet, Keynote, prtraceroute clflowd flstats, fping, tcpdpriv,NetMedic Pathchar, CAIDA Measurement Tool Taxonomy, bprobe & cprobe1998 NetOps, Triticom, Maple, PV-Wave, S-Plus, VisualRoute.Cheops, Ganymede, hping2, Iperf, JetMon, MeasureNet, MatLab, MTR, NeoTrace, Netflow,1999 NetLogger, Network health, NextPoint, Nmap, Pchar, Qcheck, SAA, SafeTP, Sniffit, SNMP fromUCSD, Sting, ResponseNetworks, Tcpshow, Tcptrace WinTDS.Analyzer, bbftp, Big Brother, Bronc, Cricket, EdgeScape, Ethereal (now renamed Wireshark),gen send/gen recv, GSIFTP, Gtrace, Holistix, InMon, NcFTP, Natas, NetAlly, NetScout, Network2000Simulator, Ntop, PingGraph, PingPlotter, Pipechar, RRD, Sniffer, Snoop, StatScope, Synack,View2000, VisualPulse, WinPcap, WU-FTPD, WWW performance monitoring, Xplot.AdventNet SNMP API, Alchemy Network Monitor, Anasil analyzer, Argent, Autobuf, Bing, Clink,DSLReports, Firehose, GeoBoy, PacketBoy, Internet Control Portal, Internet Periscope, ISDNwatch,2001Metrica/NPR, Mon, NetPredict, NetTest, Nettimer, Net-One-1, Pathrate, RouteView, sFlow, Shunra,Third Watch, Traceping, Trellian, HighTower, WCAT, What s Up Gold, WS FTP, Zinger.ANL Web100 Network Configuration Tester, Anritsu, aslookup, AlertCenter, Alertra, AlertSite,Analyse-it, bbcp, BestFit, Bro, Chariot, CommView, Crypto-Pan, elkMonitor, DotCom, Easy ServiceMonitor, Etherpeek, Fidelia, Finisar, Fpinger, GDChart, HipLinkXS, ipMonitor, LANExplorer,2002 LinkFerret, LogisoftAR, MGEN, Netarx, NetCrunch, NetDetector, NetGeo, NEPM, NetReality, NISTNet, NLANR AAD, NMIS, OpenNMS PageREnterprise, PastMon, Pathprobe, remstats, RIPmon,RFT, ROMmon, RUDE, Silverback, SmokePing, Snuffle, SysOrb, Telchemy, TCPTune, TCPurify,UDPmon, WebAttack, Zabbix.http://www.cse.wustl.edu/ jain/cse567-06/ftp/net perf monitors2/index.2 of 10
AbwE, ActivXpets, AdventNet Web NMS, Analyse It, Argus, Big Sister, CyberGauge,eGInnovations, Internet Detective, Intellipool Network Monitor, JFF Network Management System,LANsurveyor, LANWatch, LoriotPro, MonitorIT, Nagios, NetIntercept, NetMon, NetStatus, Network2003 Diagnostic Tool, Network Performance Advisor, NimBUS, NPS, Network Probe, NetworksA-OK,Sniff em, Spong, NetStat Live, Open NerveCenter, OPENXTRA, Packeteer, PacketStorm,Packetyzer, PathChirp, Integrien, StableNet PME, TBIT, Tcptraceroute, Tping, Trafd, Trafshow,TrapBlaster, Traceroute-nanog, Ultra Network Sniffer, Vivere Networks.MonitorMagic, N-central, N-vision, Netmeter, CleverEye, CueVision, D-ITG, Network Physics,FastCopy, internetVista, IPCheck Server, OSSMon, H.323 Beacon,Monitor,FREEping,NetMechnica,NetVizor, Observer, Overseer, ZTI Network Monitor, Orca, PRTG Traffic Grapher, QOVIA, Qradar,2004Wombat, Route Explorer, Scriptroute, Server Nanny, SNMP Explorer, Ganglia, GFI NetworkServices Monitor, Little:eye, STAB a Linux tracepath, SolarWinds Orion, Vantage, Vigilix, VitalNet,WatchTower Website Monitoring, WindowsNetworking.com, ServerFiles.com, SNMP Informant,bulk, BWCTL, Caligare Flow Inspector, Cittio, ClearSight, Distinct Network Monitor, EM7, EZMgt,GigaMon, Host Grapher II, HPN-SSH, Javvin Packet Netcool, netdisco, Netflow Monitor, NetQoS,Pathneck, OWAMP, RANCID, SiteMonitor, STC, SwitchMonitor, SysUpTime, TansuTCP, thrulay,2005 Torrus, Tstat, VSS Monitoring, WebWatchBot, WildPackets, ZoneRanger, Advanced HostMonitor,Just-ping, LinkRank, MoSSHe, mturoute, N-able OnDemand, Scamper, SCAMPI, SimpleInfrastructure Capacity Monitor, Spirent, Alvias, Airwave, AppMonitor, BitTorrent, PingER,Analyzer,Cacti, CSchmidt collection, Cymphonix Network Composer, Darkstat, Ey-on Bandwidth,SNM,Etherape, EZ-NOC, IPTraf, Jnettop, Zenoss, Gigamon Uni- versity, LITHIUM,mrtg-ping-probe, NetMRG, NetworkActiv Scanner, Web Server Stress Tool, NimTech, NPAD,2006Nsauditor, Nuttcp, OpenSMART, Plab, WatchMouse, Pandora FMS, PIAFCTM, PolyMon, PSentry,Rider, Sysmon, SpiceWorks,SftpDrive, SpeedTest, TruePath, Unbrowse, Unsniff, Webalizer, RSP,Pktstat2.2 Types of ToolsDifferent types of tools allow us to test different metrics: throughput, packet loss, bandwidth, delay, jitter andso on. This section organizes the taxonomy of tools based on some criteria that surely will help you to makean appropriate decision on which tools you need to pick up to meet your goal. The table 2 shows taxonomy oftools [Zeadally03].Table 2: Taxonomy of Network Performance Monitoring ToolsNameTypePerformanceMetricsOSTest ModeGUI LicenseBBMonitorApplicationMonitoringBandwidth usageand speedWindowsActiveYes etwork traffic andWindowsever's availibilityActiveYes CommercialCommViewAnalyzerInternet and LANactivityActiveYes ications,TCP/IP services and All major OSSNMP devicesActiveYes Commercialhttp://www.cse.wustl.edu/ jain/cse567-06/ftp/net perf monitors2/index.Windows3 of 10
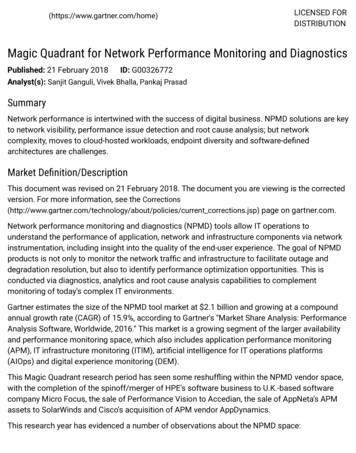
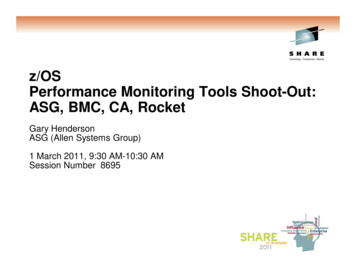
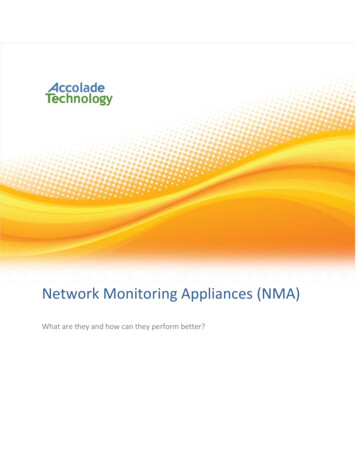
PcharPathCharacterizationBandwidth,throughput, latency, Unix/Linuxpacket lossActive andpassive, UDP, NoICMPChariotApplicationThroughput, jitter,delay, packet ty/ latency Packet losstestsVAX/ VMSActive, ICMP NoFreeSYNACKPathcharacterizationLatencySolaris, LinuxActive, TCPFreeSmokePingPathcharacterizationLatency, packet loss UnixActive, ICMP Yes throughput, latency,Solaris, Linuxpacket lossActive,Yes FreePassive, UDPMGENTraffic generatorPacket loss, delay,jitterLinux/UnixActive, UDPGtraceForward path probeNode name,IPlocation, latencySolaris/Linux/FreeBSDActive, UDP,Yes FreeICMPMTRPatchcharacterizationPacket loss, delay,jitterLinux/UnixActive, ICMP Yes FreeGen send,gen recvTraffic generatorBandwidth, packetlossLinux/UnixActiveNoFreeBBFTPFTPTCP goodputLinux/UnixActiveNoFreeArgusFlow monitoringTrack and reportUnixnetwork transactionActiveYes FreefreeYes CommercialNoYes FreeBack to Table of Contents3. Overview of some popular toolsDue to the space limitation, I will not cover all the tools listed in Table 1. This section presents briefintroduction of the some popular tools used for monitoring network performance.3.1 BBMonitorBBMonitor[BBMonitor06] is a commercial tool for Windows. It monitors bandwidth usage and internetconnection speed test. BBMonitor displays all bandwidth going in and out of the computer, so you can knowthat all the internet usage is done by you and not either harmful software or hacker. It can test bandwidtheasily and efficiently and stores test data into database. You can improve your bandwidth using databaseresult. Also you can create charts using the data in the database. Internet connection behavior can be seen inthe display graph. It will display upload and download speed real in time. Figure 3-1 from [BBMonitor06]shows display graph of BBMonitor.http://www.cse.wustl.edu/ jain/cse567-06/ftp/net perf monitors2/index.4 of 10
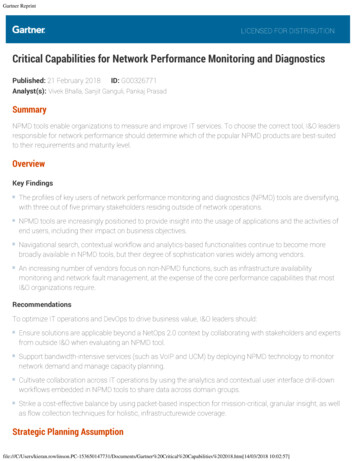
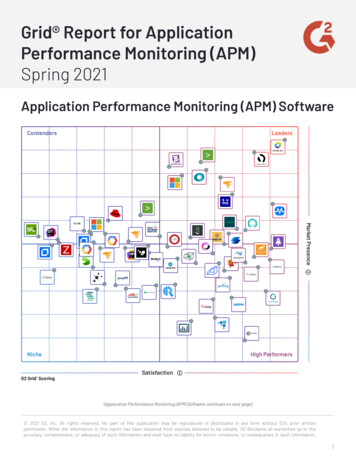
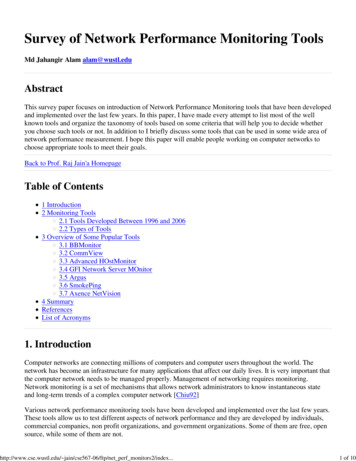
Figure 3-1: Screen shot of BBMonitor3.2 CommViewCommView [CommView02] is a commercial tool that runs on any Windows. It monitors Internet and LocalArea network activity and captures and analyzes network packet. It collects information about data thatpassing through the dial-up connection or Ethernet and decodes them. It lists all network connections, local IPand remote IP and examines all individual packets. Figure 3-2 shows result produced CommiView program.http://www.cse.wustl.edu/ jain/cse567-06/ftp/net perf monitors2/index.5 of 10
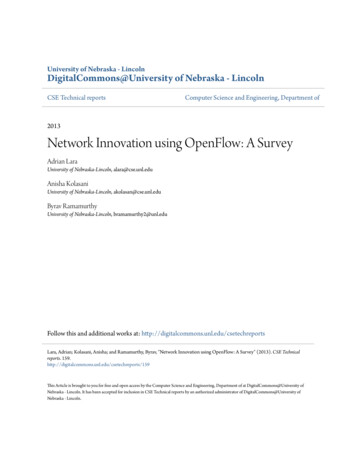
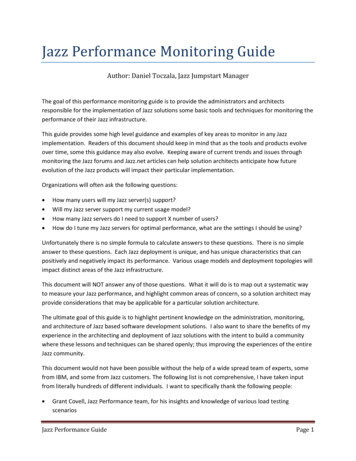
Figure 3-2: Result of CommView3.3 Advanced HostMonitorHostMonitor [HostMonitor05]is anetwork administrator software. It monitors network traffic, Web, FTP,Mail, DNS servers, and file/folder size. It also checks TCP services, disk space, CPU usage, SQL servers andmany other things. It put test result in log files and reports. Figure 3-3 shows a result produced byHostMonitor.http://www.cse.wustl.edu/ jain/cse567-06/ftp/net perf monitors2/index.6 of 10
Figure 3-3: Screen shorts of HostMonitor3.4 GFI Network Server MonitorGFI Network Server Monitor[GFI04] monitors network for failures or irregularities. It maximizes networkavailability by monitoring all aspects of Windows and Linux servers, workstations and devices such asrouters. When it detects a failure, GFI Network Server Monitor can send alerts via SMS, pager, email or anetwork message. GFI Network Server Monitor consists of a network monitoring service and a separatemanagement interface. No agent software needs to be installed on the machines you wish to monitor. TheNetwork Monitor Engine is multi-threaded and can run 40 checks at a time. This software architecture allowsfor high reliability and scalability to monitor both large and small networks.GFI Network Server Monitor can check the status of a terminal server by actually performing a complete loginand checking if the session is established correctly. GFI Network Server Monitor can check the availability ofall leading database applications. GFI Network Server Monitor includes extensive checks for monitoringLinux servers. All CPU usage, printer availability, file existence, process running, folder size, file size, usersand groups membership, disk partition check and disk space can be monitored by GFI Network Serve.GFI Network Server Monitor allows you to store monitoring data to either an SQL Server or MS Accessdatabase backend. SQL Server is more appropriate for users with higher monitoring level requirements as wellas those who need to centralize the monitoring results of multiple GFI Network Server Monitor installations inone place, such as backups, remote accessing as well as report generation by third party tools such as CrystalReports or MS Reporting Services.You can check rule status from any location using GFI Network Server Monitor's remote web monitor. Youcan check critical processes and services on local and remote computers using GFI Network Server Monitor.You can also monitor the CPU usage of a machine.3.5 Argushttp://www.cse.wustl.edu/ jain/cse567-06/ftp/net perf monitors2/index.7 of 10
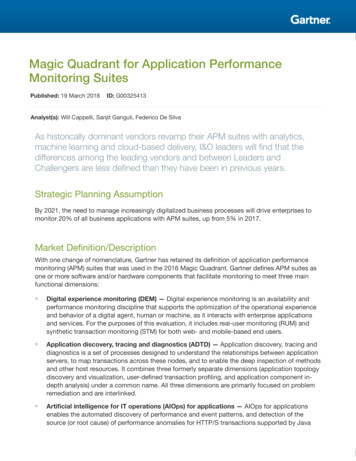
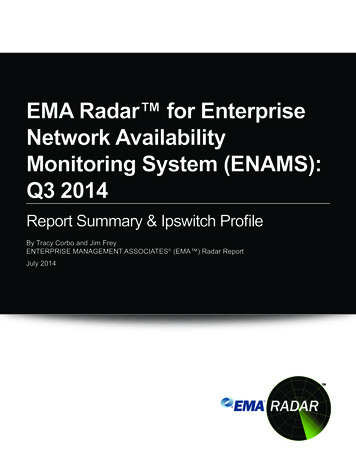
Argus is a fixed-model Real Time Flow Monitor designed to track and report the status and performance of allnetwork transactions seen in a data network traffic stream [Argus03]. Argus runs on Linux, Solaris, FreeBSD,OpenBSD, NetBSD, and MAC OS X and its client programs have also been ported to Cygwin. Argus providesa common data format for reporting flow metrics such as connectivity, capacity, demand, loss, delay, and jitteron a per transaction basis. The record format that Argus uses is flexible and extensible, supporting genericflow identifiers and metrics, as well as application/protocol specific information.Argus can analyze and report on the contents of packet capture files and it can run as a continuous monitor,examining data from a live interface, generating an audit log of all the network activity seen in the packetstream, providing both push pull data handling models and allowing flexible strategies for collecting networkaudit data. Argus can be used to monitor individual end-systems, or an entire enterprises network activity.Argus data clients support a range of operations, such as sorting, aggregation, archival and reporting. Thenetwork transaction audit data that Argus generates has been used for a wide range of tasks including SecurityManagement, Network Billing and Accounting, Network Operations Management and Performance Analysis.3.6 SmokePingSmokePing [SmokePing02]is a free-open source tool that works on all Unix platforms. It s measures, storesand displays latency, latency distribution and packet loss. It support dynamic IP. Using RRDtool it maintains along term data-store and presents them into graphs, so we can easily get information of each networkconnection. SmokePing has a smart alarm system. We can define latency or loss pattern. This pattern willtrigger alarms. Figure 3-4 [SmokePing 02] shows graph created by SmokePing.Figure 3-4 (Open source tools): Graph of SmokePing3.7 Axence NetVisionNetVision [NetVision06] is a commercial tool developed in 2006. It is supported on all operating systems. Itmonitors servers, applications, TCP/IP services and SNMP devices. Once it runs, in a minute it automaticallydetects all hosts in the entire network and scans services on them. It present hosts on interactive maps whichdisplay all critical information such as service response time, services and host down time, alerts and so on. Soproblems can be detected and focused easily. It also provides alerts and report about when hosts go down.Figure 3-5 shows an interactive map of NetVision.http://www.cse.wustl.edu/ jain/cse567-06/ftp/net perf monitors2/index.8 of 10
Figure 3-5: Interactive map of NetVisionBack to Table of Contents4 SummaryIn This paper, I have made every attempt to include most of well known network performance monitoringtools. Since different tools are utilized to collect different metrics, I present taxonomy of network performancetools according to their application. Finally this paper overviews some popular tools. I hope this survey paperwill help you to guide what tools you should select according to your goals.Back to Table of ContentsReferences1. [Cotrell06] J Les Cotrell, SLAC, Network Monitoring Tools, October 29, tools.html2. [Zeadally03] S. Zeadally, E. Yaprak, Y. Li, and X. Che (USA), "A Survey of Network PerformanceTools for Computer Networking Classes", Computers and Advanced Technology in Education - 2003.3. [Chiu92] Dha Ming Chiu and Ram Sudama, "Network Monitoring Explained Design and Application",Ellis Horwood 1992.4. [BBMonitor06] http://www.absolutefuturity.com/BBMonitor.htm Network. Monitoring Tool developedin tp://www.cse.wustl.edu/ jain/cse567-06/ftp/net perf monitors2/index.9 of 10
5. [CommView02] http://www.tamos.com/products/commview/ .Network Monitoring Tools developed in2002http://www.tamos.com/products/commview/6. [SmokePing02] .ch/smokeping/7. [Netvision06] http://www.axencesoftware.com. Network Monitoring Tools Developed in 2006http://www.axencesoftware.com8. [Argus03 ] m/argus/9. [HostMonitoring05] http://www.ks-soft.net/hostmon.eng/index.htm .Network Monitoring Toolsdeveloped in . [SmokePing 2002] .ch/smokeping/11. [GFI 2004] fi.com/nsm/nsmfeatures.htmBack to Table of ContentsList of AcronymsStructure Query LanguageSQLAutonomous SystemASLocal Area NetworkLANWide Area NetworkWANDomain Name SystemDNSTransmission Control Protocol / Internet ProtocolTCP/IPUser Datagram ProtocolUDPOperating SystemOSFile Transfer ProtocolFTPBack to Table of ContentsThis report is available on-line at http://www.cse.wustl.edu/ jain/cse567-06/net perf monitors2.htmList of other reports in this seriesBack to Raj Jain's home pagehttp://www.cse.wustl.edu/ jain/cse567-06/ftp/net perf monitors2/index.10 of 10
It maximizes network availability by monitoring all aspects of Windows and Linux servers, workstations and devices such as routers. When it detects a failure, GFI Network Server Monitor can send alerts via SMS, pager, email or a network message. GFI Network Server Monitor consists of a networ