Transcription
Designing Ad hoc ReportVersion: 7.3
Copyright 2015 Intellicus TechnologiesThis document and its content is copyrighted material of Intellicus Technologies.The content may not be copied or derived from, through any means, in parts or in whole, without a priorwritten permission from Intellicus Technologies. All other product names are believed to be registeredtrademarks of the respective companies.Dated: August 2015AcknowledgementsIntellicus acknowledges using of third-party libraries to extend support to the functionalities that theyprovide.For details, visit: http://www.intellicus.com/acknowledgements.htm2
Contents1 Ad hoc Wizard4General settings5Display Fields8Applying Filters10Applying Grouping14Applying Totals16Applying Sorting18Highlighting19Creating Matrix22Creating Chart25Creating GIS Maps312 Ad hoc Report Toolbar353
1 Ad hoc WizardAd hoc Wizard is a tool for non-technical, business end users to design or modify reports. Report design hassimple steps - selecting a data source and fields, applying grouping and filtering. You can view the reportimmediately after it is designed.Ad hoc report may have tabular data arrangement, a matrix as well as a chart. On Ad hoc Wizard, you canalso: Sort the data to re-arrange it in order of your choiceGet totals / summariesHighlights selective records (when a condition is met)When you run an ad hoc report in HTML output format, the viewer provides Power Viewer that helps alteringthe report on the viewer itself.Figure 1: Ad hoc WizardInformation: Ad hoc Wizard is configurable for many options that it provides. Youradministrator may further simplify your experience in creating or editing byremoving some options on the Wizard.This document mentions all the options on the WizardThe Ad hoc Wizard is divided into sections, which appear as tabs. Each section’s functionality goes asfollows:4
General settingsGeneral settings appear on top of all tabs.General settings properties:ItemValuesCommentsTemplateSelect from the listA template defines the layout part of the ad hoc report.This generally applies to coloring, fonts and page sizeof the report.Some templates could be specifically designed forcertain reports – such as wide report etc.Report FormatSelect from the list:HTMLHTML Default format. Opens report in HTML ReportViewer with navigation optionsACROBAT PDF Opens report in PDF viewerACROBAT PDFMS EXCEL Downloads report in XLS formatCOMMA SEPARATED Downloads report in CSV formatMS EXCELTEXT Downloads report in TXT formatMS WORD Downloads report in DOC formatCOMMA SEPARATEDiHTML Opens report in single page HTML with Gridand Interactive ChartsJVISTA Opens report in Intellicus Applet ViewerTEXTMS WORDXML Downloads report in XML formatRAW TEXT Downloads large reports in zipped CSVformat, with no formattingiHTMLJVISTA5
XMLRAW TEXTReport TitleType yourselfData SourceSelect from Query ObjectType the title of the reportSelectorOpen the Query Object Selector, Navigate tocontaining folder and select the data source QueryObject for this report.Selecting a Query Object populates its fields in all thesections of the Ad hoc WizardQuery EditorOpen Query EditorIf you are a Data Administrator you can edit theselected Query ObjectReport ContentsDetailedDetailed Shows detail section, hence showing thelowest level detail of the reportSummarized Hides detail section, hence showing thelowest group level summary of the report.SummarizedSummarized Report shows useful data only whengroups and summaries are appliedView Options:View Options are format specific settings for the report:View e to downloadable formats.ZippedMultipageCheck Zip the file and downloadCheck/UncheckCheck Break report into pages according to sizementioned in templateUncheck Merge all pages into single page6
(Note: Single page reports will be slower to downloadand also viewers carry their limitations in openingthese files)PaginationSingle(Alternateproperty toMultipage )Single Merge all pages into single pageMultiple Break report into pages according to sizeMultiplementioned in templateHorizontal Breaks Break report only on the lengthpart and keeps the width to actual size required at runHorizontal Breakstime.(This breaking is required for reports with large numberof fields or matrix fields when you don’t want pages tosplit vertically)MS EXCEL ViewOptionsRemove BlankCheck/UncheckRows, ColumnsRepeat PageCheck Compact the Excel Report by removing blankrows and columnsCheck/UncheckCheck Repeat column headers on each pageHeader andFooterUncheck Merge all detail data under a single instanceof column headersCOMMASEPARATED andRAWTEXT ViewOptionsSeparatorSelect (under Predefined)Select the separator character to be inserted betweenor Type yourself (undercolumns in the CSV/RAW TEXT outputCustom)EnclosureSelect (under Predefined)Select the enclosure character to be used to encloseor Type yourself (undereach column value in the CSV/RAW TEXT outputCustom)7
Action Buttons:ButtonCommentsRunRun the report with full data in desired format.This loads the respective report viewerPreviewRun the report with initial partial data.This will also run the report with data that was cached in previous preview of thesame report in same sessionSaveSave the settings of this report – data source, fields, groupings etc. A save dialog willprompt for report name and folder locationSave AsSave the settings of this report with a different name. A save dialog will prompt forreport name and folder locationOpenOpen previously saved ad hoc report for editing. An Open dialog will prompt forselecting the folder and reportDisplay FieldsUnder the DataSource tab, you can select the fields to be displayed on the report.Figure 2: Selecting Display fields8
Selecting fieldsTo select a field, check the checkbox displayed before each field from Available Fields and clickbring the fields in Selected Fields. To select all the fields, clickbutton tobutton.To select a group, check the checkbox displayed before the group and clickbutton.When selecting display fields through dual list, fields may be arranged in tree view. To select all the fieldswithin branches, select top branch. To deselect a field, highlight it from Selected Fields and clickTo deselect a group, highlight the group-name from Selected Fields and clickbutton. Clickbutton.button todeselect all the fields.Display Field PropertiesItemValuesCommentsWidth0-NNumber of characters of this field to show on thereport. Field data may wrap beyond this widthRender AsApplies to Number Data type fields(Default)Blank option (Default) render numbers as numbersDataBarDataBar render numbers as a horizontal bar whosesize is in ratio to its valueDataBar Base0-N (in case Custom optionCustom Choose your base number for Data bar. Rowsis checked)with value equal to base value will show zero widthdata bar. All greater numbers will be green barstowards right and lower to base will be red bar towardsleft.AvgAvg Average of the group becomes base of data bar.All values below average will be red bars and all valuesabove average will be green barsMinMin Minimum of the group becomes base of data barMax Maximum of the group becomes base of data barMax9
Rendering data barsFigure 3: Field Selection PageIn case Update Query Object is set TRUE and you have added a new field in the database file, you would seethe new field when Add New Fields At Runtime is checked here. In case this is unchecked, then you can addnew fields from PowerViewer.Applying FiltersFilter is an ad hoc condition, which you can choose to apply on your report. The data of the report will filterin based on this condition. You can apply multiple conditions including AND/OR combination.Filter Section propertiesItemValuesCommentsMax. Rows0-NMaximum number of rows to be fetched for this report.When you are using a data set that returns too manyrows or when you are not sure of number of rows, thisis the tool to restrict the size of the report.(Note: Reports generated with Max. rows set maycontain incomplete information of your business data)SuppressDuplicatesCheck/UncheckYes Removes consecutive duplicate records from thereport.(Note: Distant duplicate rows may still exist in thereport)(Note: Make sure that the report is sorted on all thereport fields)10
Ad hoc FiltersItemValuesCommentsFieldSelect from listSelect the field on which you wish to apply filterUse FieldCheck/UncheckCheck When Use Field is checked, Value getspopulated with Field values for comparisonCriteriaSelect from listSelect the operator to be used in the filter. These arecomparison operators based on the data type of theselected field.The between operator prompts for two valuesValueRelationType yourself or selectBased on the configuration of this field in the metafrom listlayer, the value list appearsANDAND The next condition is applied with combinedconjunction of this conditionOROpen/Close(((OR The next condition is applied in alternateconjunction of this conditionBraces to group a set of conditions for applyingappropriate AND/OR combination(((((((((((()))))))))))))))11
ActionsItemCommentsAdd FilterAdd a new filter condition rowRemove FilterRemove current filter condition rowSelecting values from Lists and Multi-Select ListThe value select list may behave differently for different fields based on how they have been configured byyour data administrator for best performance. You can configure Lookup Values for fields while designingthe Query Object.List behaviorCriteriaList behaviorCommentsIn ListPre-populated List is loadedThis field generally has less number of values, it isas soon as the field isalways faster to pre-fetch the values before loadingselectedthe Ad hoc WizardList populates when you pullThis field generally has medium number of values, itthe drop downis better to fetch values only when you try to use thisfield for filteringList shows a hint “Search.”This field generally has a large number of values. Youwith a search drop down iconstart typing in first few characters and a shortlist willautomatically appear for selectionEntering values for Network ID formatted fields IP: It needs to be specified as a set of 4 numbers (decimal) separated by dots. Each of the numberneeds to be between 0 and 255. Example: 90.233.245.162.MAC Address: It needs to be specified as a set of 6 numbers (hexa) separated by colon. Each of thenumber needs to be between x00 (00) and xFF (FF). Example: 15:FF:01:F1:01:B4.TIP: While specifying MAC address, putting a colon between the hexa digits is not necessary. Theapplication will automatically insert colon after every second 'digit' (starting from right side).Example: number entered is FF101B4; Number changed to is 00:00:0F:F1:01:B4.12
Linked FiltersA Field could be linked to one or more other fields for fetching available values for filtering.This is to handle situations like short listing states when a country is selected.You may need to select parent field, apply filter before selecting a child field to apply filter.Figure 4: Filters as Link LookupSelecting dynamic DatesWhen you select a date field to apply filter, you have an option to specify a dynamic date variable – today, inlast 5 days etc.This helps to re-run saved reports without having to change the date value to get then current date rangeapplied.For example, Date of hire is in last 10 days from today (report generation date).Date of sales transaction is in this Quarter.Transaction Date is in last month.Date of retirement is in next month.For criteria, you may select any of the following: is in lastin thisis in nextIf in this is selected as Criteria, the Value drop down box has following options to choose from: YearQuarterMonthWeekDayHourMinuteIf is in last or is in next is selected in Criteria, specify the number of Day(s), Week(s), Month(s), Quarter(s) oryears (as the case may be) in Value entry box. Explanation for each of the option is given below:13
Year(s): The number of years from the date of report generation.Quarter(s): The number of quarters from the date of report generation. A quarter is January toMarch, April to June, July to September and October to December.Month(s): The number of months from the date of report generation.Week(s): The number of weeks from the date of report generation. A week is considered fromSunday to Saturday.Day(s): The number of days from the date of report generation.Hour (s): The number of hours from the date of report generation.Minute (s): The number of minutes from the date of report generation.Applying GroupingGrouping brings together the related data of a report based on the grouping key.Group key can be arranged in ascending or descending order, based on group key value or a detail field’ssummary value.For example, if you group population details by region, you can arrange regions by name or by highest tolowest population.Ad hoc reports support multi-level grouping, for example, you can group the report data by country; withincountry by states and within states by cities.Figure 5: Selecting GroupingSelect grouping optionsIf not already open, click Grouping tab header to open the tab.14
Group propertiesItemValuesCommentsFieldSelect from listGroup By field is the highest priority field selected forgrouping.It specifies top level grouping.Then by field specifies fields of next priority and levelfor groupingOrderAscendingSelect the order of groupingDescendingRanking FieldSelect from listSelect the field to apply ranking function to decide theorder of appearance of groupsRankingFunctionSum,AvgSelect the function to apply on the ranking field andfind n,PopStdDeviationandDistinct functionsShow WhenSpecify the criteriaShow When button helps to specify condition to be metin order to show that group15
ActionsItemCommentsAdd GroupAdd a new groupRemove GroupRemove current groupDate fields groupingIf you select date type field in Field dropdown, you can also group dates by: Minute: Number of the minute indicating the minute of an hourHour: Number of the hour indicating the hour of the dayDay: Day of the monthWeek: Week number of the monthMonth: Month numberQuarter: Quarter numberYear: Number indicating the yearFigure 6: Selecting GroupingApplying TotalsApplying totals summarizes detail rows. The summaries can be applied at group level (in case grouping isapplied), page level or report (grand total) level.Figure 7: Selecting Totals (summary)16
ItemValuesCommentsFieldSelect from listSelect the field on which the summary needs to beappliedFunctionSelect from listSelect the function to apply on the summary Deviation,PopStdDeviationandDistinct functionsLevelGroupGroup Apply and display total at each group levelPage Apply and display total once per page for allPagedetail rows appearing in that pageReport Apply and display grand total at report levelReportOn a summarized report (Report Content Summarized), only the group Keys and these summaries appear,hiding the detail rows.In an iHTML grid report you can collapse group keys to show only summary and hide details. You can alsoexpand the group keys to show detail rows.Note: If total is applied on field that is not in display fields, it will beautomatically added in the Display Fields list.17
Custom-Defined FunctionsYou can also use custom-defined summary functions for summarizing data values in reports.These summary functions can be defined in a class implementing IScriptFunction interface. The .jar file ofthis class should be placed in ReportEngine lib folder.There should also be an .xml file containing all the entries of .jar file and placed in ReportEngine configfolder.Restart Intellicus Report Server and then Web Server to be able to see these summary functions as any otherfunction in the list. The .xml file would look like: SUMMARYPROVIDERS !-- Summary Provider. Provider name is just a user friendly name toidentify provider class.Class file is fully qualified java class name of the class containingsummary functions.A summary provider may have as many summary functions as desired -- SUMMARYPROVIDER PROVIDERNAME "PACKAGECAPTION"CLASSFILE "com.client.summaryfunctions.MathAlternate" SUMMARYFUNCTIONS !-- Summary function that contain logic for applyingbusiness logic on the selected field. Name is just a user friendly name that isdisplayed in the dropdown. Id is a unique number that must be unique and separatefrom IDs of in-built summary functions.Recommended: Start IDs from 1001. APPLYONDATATYPES is acomma-separated list of data types on which this summary function is applicable.Possible values are CHAR NUMBER DATE. Rest all areignored -- SUMMARYFUNCTION NAME "AlternateSum" ID "1001"APPLYONDATATYPES "CHAR,NUMBER,DATE" /SUMMARYFUNCTION SUMMARYFUNCTION NAME "ReverseString" ID "1002"APPLYONDATATYPES "CHAR" /SUMMARYFUNCTION SUMMARYFUNCTION NAME "ModTen" ID "1003"APPLYONDATATYPES "NUMBER" /SUMMARYFUNCTION SUMMARYFUNCTION NAME "FutureDate" ID "1004"APPLYONDATATYPES "DATE" /SUMMARYFUNCTION /SUMMARYFUNCTIONS /SUMMARYPROVIDER /SUMMARYPROVIDERS Applying SortingYou can sort the report to get the report data in a pre-determined (ascending or descending) order.Note: If you have setup grouping for a report, you need not set sorting for it.This is because data is already sorted to make groups.18
Application supports multiple level of sorting. For example, you can Sort By "Country"; then within"Country", sort by "State" and within "State" sort by "City".If not already expanded, click Sorting tab header to expand it. The number of sort levels you have selectedis displayed on right side of the header.Figure 8: Specifying Sort OrderIn Sort By row, select the Field on which sorting is to be applied. After selecting the Field, select the sortorder from Criteria dropdown menu. You can set sort on more than one field.To apply sorting on one field specify field in Sort By row. To set sorting on another field select the field fromThen By field.You can choose to alter given sorting settings at the run time from Power Viewer.HighlightingHighlight is a visual indication on an ad hoc report. It catches user's attention to specific records or groupswhile viewing the report output. Each highlight is configured along with an ad hoc condition or multipleconditions related by AND/OR operators.When report extends to multiple pages and you browse through pages, you may not notice a highlightvisually. Setting alert for a highlight creates a special TOC for highlighted records.You can set multiple highlights on a report; a record falling into multiple highlights will be highlighted incombination style.A highlight can be set at Detail level or Report level. If the report is grouped, highlight can be set at grouplevel too.Figure 9: Setting highlighting19
Highlighting propertiesItemValuesHighlightSelect from list:(Entire Row)Comments(Entire Row) Apply below mentioned highlightingstyle to entire row of detail.Group- Field Name(EntireRow)Field NameGroup- Field Name(Entire Row) Apply style to entirerow of field under group headerField Name Apply style to individual field valueUsing StyleSelect from listSelect the style to apply on highlighting itemAlertCheck/UncheckCheck In addition to applying style on the reportitem, the report tool bar also shows an alert icon, if ahighlight condition occurs. When this report is saved,users can subscribe to this alert from notificationscreenUncheck visual style applying onlyOpen(((Braces to group more than one conditions usingAND/OR((((((((((((FieldSelect field from listLevelSelect field from list:DetailField to apply condition onDetail field’s value to be compared at row level20
Report field’s value to be aggregated at report levelReportand then comparedGroup field’s value to be aggregated at mentionedgroup level and then comparedGroupFunctionSelect from listAggregation function, used in case of field level isReport or Deviation,PopStdDeviationandDistinct functionsCriteriaSelect from listOperators to compareUse FieldCheck/UncheckCheck The value box turns into a field selector. Helpsin comparing one field with another for the conditionUncheck The value box shows text box, select list orcalendar to manually enter or select valuesValueEnter orselect valueClose)))Shows text box, select list or calendar to manuallyenter or select valuesBraces to group more than one conditions usingAND/OR21
))))))))))))RelationANDAND The next line condition relates to this conditionwith an AND operator. This is default behavior whenblank is selectedOR The next line condition relates to this conditionORwith an OR operatorCreating MatrixUse matrix to summarize your report data in the form of cross-section of fields in rows and columns. Forexample, product-groups and products in columns; zone and area in rows. A cross section of group, productand zone, area will display sales of that product in that area.Under Select Display Fields tab, select the data source.To get only matrix on the report, don't select any display fields on Select Display Fields tab. If you selectdisplay fields, matrix will be placed below the tabular data.If not already open, click Matrix tab header to open the Matrix tab.Figure 10: Creating a matrix22
To place a field as matrix row, drag it from Available Fields list and drop it in Row Fields (or, select a field andclickbutton). To place a field as matrix column, drag it from Available Fields list and drop it in ColumnFields (or, select a field and clickbutton).You can group a Date type or Numeric type field placed in Row Fields, or Column Fields box.Last column of the matrix contains total of all the summary cells in a row. Last row of matrix contains totalof all the summary cells in that column.To place a field on summary (intersection of row and column), drag a field from Available Fields list anddrop it in Summary Fields (or clickbutton).These fields will be calculated for summary/totals. Functions listed in Function dropdown box will dependon data type of the Summary Field.You can drop multiple fields in Row Fields, Column Fields and Summary Fields box. Fields appear higher insequence in Row Fields and Column Fields will appear on outer side on matrix. Fields are placed left toright in Summary Fields. To move a field up or down, clickorbutton.First field dropped in Row Fields and Column Fields will have Totals checkbox checked. To get totals forother fields, select Totals checkbox of the field.Show When opens up filtering criteria to apply on column and row fields. The column/row that meets thecondition shows up on the matrix when you run the report.You can highlight a Cell, Cell Family, or an Entire Row or Column of a matrix based on a condition. Thematrix highlights using the specified Style.Grouping values of Numeric fieldsYou can make range of values by specifying grouping. For example, to have groups of 0-9, 10-19,. specify10 in Group By box of respective row in Row Fields or Column Fields box.Grouping values of Date type fieldsYou can group a date by Minute, Hour, Day, Week (Sunday to Saturday), Month, Quarter (Jan-Mar, Apr - Jun,Jul - Sep, Oct - Dec), Year. Select an option from Group By box of respective row in Row Fields or ColumnFields box.After making a matrix if you think that is not something you wanted to make, click Clear Matrix link to clearmatrix to start all over again.You may choose to have a matrix on your report since it presents a summary of data. Make sure that theright query object is selected (under Select Display Fields).23
Figure 11: Link Matrix and ChartDesigners/Users can link Matrix and Charts so that any changes made in one component gets reflectedautomatically in the other. Linking can be done in both ways--Matrix to Chart and vice versa.If Designer has not linked the chart and matrix then user has an option to link them at runtime (in Powerviewer).At Runtime if user wants to add a new field (Target Sales) to visualize the comparative performance of thesalesman then he just need to use power viewer and choose to add the new field in matrix.24
Creating ChartChart is used for graphical representation of data. To address your charting needs ad hoc report supportsmost of the popular chart types like bar, line, pie and radar.You can create multiple charts on an Ad hoc report.Chart section provides button to add more charts and specify the chart details in the new chart tab.In the Ad hoc template you can control the number of charts displayed by the size. More charts flow to nextrow.Figure 12: Creating ChartChart propertiesItemValuesCommentsChart TypeSelect from listSelect the base charttypeLinkSelect from list:25
Report FieldsReport Fields Takereport grouping fieldsas chart groupingfields and numberfields from detail orsummary section aschart series fields atrun timeMatrixMatrix Take row andcolumn group fieldsas chart group fieldsand cell value fieldsas chart series fieldsValue FieldsValue FieldsDrag from available fieldsY axis on chart seriesField (Y Axis)Value FieldsEach field becomes aSelect from listFunctionValue Fields will beaggregated on chartusing this functionSum, Avg, Count, Min, Max and othersValue FieldsAxisTabsYCreate new tab using for secondary Y axis.Y1Y2Drag fields onrespective Y Axis tabY3 26
Axis StackingSelect from options:NormalNormal No stackingStackedStacked Stack allseries of this Y axis100% Stacked100% Stack 100%stack all series of thisY axisValue FieldsSelect from listSelect series levelchart type.Series ChartType(Parent) No serieslevel chart typeapplied, use basechart typeValue FieldsSet Trend optionsOpens trend dialogTrend27
Value FieldsCheck/UncheckCheck Adds a trendline to this series.Show TrendTrend line will be aLineline type chartirrespective of basechart type and serieschart typeUncheck Switch offtrend line for thisseriesValue FieldsAutomaticTrend TypeAutomatic The toolselects one of thetrending algorithmsautomatically basedon the dataManual You canchoose one of thealgorithms forManualdrawing trend line:Exponential, Linear,Logarithmic,Polynomial, Power,Moving Average28
Value Fields0–5Trend ManualDefines the order ofpolynomial trend line.PolynomialThe order of theOrderpolynomialdetermines by thenumber offluctuations in thecurveValue Fields0-NTrend Manualnumber of datapoints to average andMovinguse as average valueAverageForecastDetermines thefor trendingForwardBackwardSpecify trend line forfuture or back periodof timeGroup FieldsGroup FieldsDrag fields from available fieldsaxis on a chart series(X Axis)Group FieldsGroup ByEach field becomes XSelect from listYEARApplicable for Datedata type fieldsQUARTERMONTHWEEKDAYHOURMINUTEGroup FieldsDisplay FieldSelect a field from listOn X axis data label,show the selected29
fields’ values insteadof group field valueGroup FieldsCheck/UncheckCheck Convert intoseries. All the valuesPivotfrom this fieldbecome series atruntimeChartSettingsShow TitleCheck/UncheckSwitch On or Off titleShowCheck/UncheckSwitch On or OffLegendsShow PointlegendsCheck/UncheckLabelsAlignSwitch On or Off Datapoint labelsSelect from listPosition of chartwhen report hasdetailed dataTopTop Show the chartat the top of reportBottomBottom Show thechart at the bottom ofthe reportLevelSelect from listLevel of data toaggregate for chartReportReport All of reportdata will beaggregated in to onechart per reportPagePage Data renderedin one page of detailsection will be30
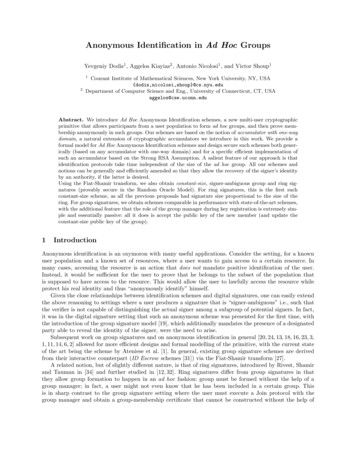
aggregated into achart per pageSort OrderSelect field from listFieldThe X Axis values willbe sorted based onthe value of selectedfieldSort OrderOrderAscendingOrder of sortingDescendingShow (N)Select from list(All)Restrict number of Xaxis values to givennumber1-50Clear ChartActionRemoves all chartsettingsCreating GIS MapsCreate GIS maps on ad hoc reports and achieve the following:1.2.3.Heat mapAttributes on balloonDrill down31
Figure 13: Creating MapGIS section propertieItemValuesCommentsMapSelect Map Data:This list populates according to map dataavailable on your system.Select the map name for initial loading ofdata.For example, if you want to depict USstates heat map then select “USA –Regions”. If you want World countries heatmap then select “World - Countries” map32
Area FieldSelect field from listThis list populates GIS enabled fields fromyour selected data set.Select appropriate field for grouping ofdata.For example: the field that contains statename, country name etc.Area AttributesOpens Attributes dialog(See image below this table)Area AttributesArea attributes dialog helps you design thecontent of the balloon that opens whenuser clicks an area on the mapType yourselfPrefix caption value for the fieldSelect field from listValue of the fieldSelect summary functionSelect the aggregation summary functionPrefixArea AttributesFieldArea AttributesFunctionArea Attributesapplied on the fieldType yourselfAppend suffix caption for the fieldCheck/UncheckCheck This line appears on the title bar ofSuffixArea Attributesthe balloonAs TitleUncheck This line appears on the canvasarea of the balloonArea AttributesThe balloon content formation isPreviewpreviewed hereHeatmapThis section helps you design the heat mapPropertieson the GIS mapValue FieldSelect field from listSelect the value field using which the heatmap is calculated33
FunctionSelect summary functionSelect the aggregation summary functionapplied on the fieldStart ColorSelect color from paletteSelect the lowest value colorEnd ColorSelect color from paletteSelect the highest value color.All the in-between values will be assignedrespective colors automatically by an evendistributionAttributes DialogFigure 14: Attributes Dialog34
2 Ad hoc Report ToolbarWhen you run
1 Ad hoc Wizard Ad hoc Wizard is a tool for non-technical, business end users to design or modify reports. Report design has simple steps - selecting a data source and fields, applying grouping and filtering. You can view the report immediately after it is designed. Ad hoc report may have tabular data arrangement, a matrix as well as a chart.