Transcription
Workforce SolutionsCapital Area Healthcare Industry AnalysisREPORT 1: WORKFORCE SUPPLY AND DEMAND ANALYSISJUNE 2018
TABLE OFCONTENTSAbout the Capital Area Healthcare Industry AnalysisAbout the Analysis . . .2Geographic Parameters . . .3Report Structure . . .4Consulting Team and Partners . . .5Workforce Supply and Demand AnalysisDemand Analysis . . .6Supply Analysis . . .10Gap Analysis . . 14Summary of Findings . .241
ABOUT THECAPITALAREAHEALTHCAREINDUSTRYANALYSISTravis County lies at the heart of one of the country’s best performing economies. During the past fiveyears, employment in Travis County and the broader Austin metro region has increased at twice thenational rate of growth. Since 2012, employers in the Austin metro region have added nearly 170,000jobs, more than 70% of which have been located within Travis County. During this period, the Healthcareindustry grew by 16,000 workers and was one of the largest job creators in the region.The Workforce Solutions Capital Area Workforce Board (the “Board”) serves as the leadership andgoverning body for the Austin/Travis County workforce system. The Board produced a Master CommunityWorkforce Plan, the overarching vision of which is a more demand-driven workforce system thateffectively engages employers, community-based organizations, and educational institutions, andsuccessfully prepares economically disadvantaged residents for good jobs in high-demand, middle-skilloccupations. Middle-skill jobs require more than a high school diploma but less than a bachelor’s degree.Given the expected strong demand for Healthcare workers, especially among middle-skill jobs, it iscrucial that the region possess a pipeline capable of producing the talent necessary for growth. TheBoard has collaborated with several regional healthcare workforce development stakeholders to launch anew workforce initiative known as the Central Texas Healthcare Partnership (the “Partnership”). Thisnascent group of healthcare employers has committed to working together to advance two goals:1. Identifying shared middle-skill workforce needs that are common among Central Texas healthcarebusinesses; and2. Identifying and implementing joint solutions.In support of these goals and with funding from the Texas Workforce Commission’s Texas IndustryPartnership program, the Board commissioned a Healthcare Industry Analysis to better understand thelabor market landscape and discover potential strategies to increase alignment between regional supplyand demand for middle-skill healthcare careers.Report 1 focuses on better understanding the supply and demand dynamics related to high-demand,middle-skill healthcare careers. Report 2 provides a framework of strategic recommendations to addressgaps and challenges.2
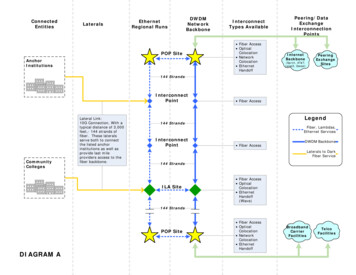
GEOGRAPHYAlthough Travis County is the ultimate focus of the Board, the community’s labor force extends beyondits borders. According to the US Census Bureau, for example, approximately 45% of all workers inTravis County live elsewhere. College students display a similar level of geographic fluidity, with manygraduates from schools outside of Travis County eventually becoming part of the local workforce. Toensure that the analysis reflects this reality, the Healthcare Industry Analysis is conducted for the entireAustin metropolitan area, consisting of Travis County, Williamson County, Bastrop County, CaldwellCounty, and Fayette County.Austin MetroTravis CountyCity of Austin3
REPORTSTRUCTUREThe Master Community Workforce Plan and early convenings of the Central Texas Healthcare Partnershipfound that middle-skill healthcare occupations are of particular concern in the Austin metro region. TheHealthcare Industry Analysis provides quantitative validation of those findings by determining themakeup of the metro region’s labor force and identifying the occupations that are thriving and those thatare undersupplied.The report begins with a Workforce Demand Analysis that places the recent and projected performanceof the metro’s Healthcare industry within a broader context. The Demand Analysis also includesinformation on healthcare job posting trends - information that can help identify if local employers arehaving more difficulty securing talent than in years past.Next, the Workforce Supply Analysis examines the pipeline of workers currently being produced bycolleges and universities within the region. The Analysis explores the number of locally-producedgraduates by program discipline, as well as the recent growth patterns and overall concentration ofdegree clusters relative to the national average.The Workforce Demand and Supply Gap Analysis integrates information from the Demand Analysis andthe Workforce Supply Analysis and identifies occupations in which existing and emerging talent shortagesmay limit the area employers’ ability to find the workers they need to thrive.Please see the separate Data Appendix report for detailed methodology, occupational and degreecluster information used throughout the report, and additional supporting analyses.4
ABOUT THEPROJECTCONSULTINGTEAMThe Council for Adult and Experiential Learning (CAEL) is a national non-profit organization whosemission is to expand learning opportunities for adults. CAEL works to remove policy andorganizational barriers to learning opportunities, identifies and disseminates effective practices,and delivers value-added services.Avalanche Consulting’s mission and passion is to help communities become more vibrant andprosperous. We are a leading national consultancy specializing in strategic planning, workforceanalyses, and customized research for economic and workforce development organizations.5
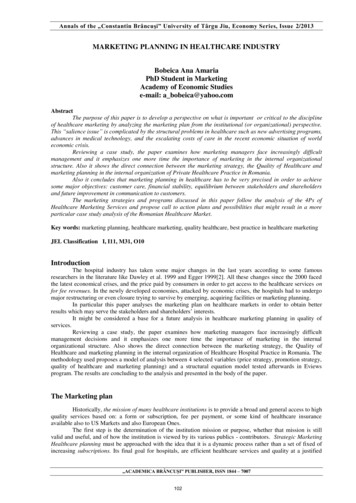
WORKFORCEDEMANDThe first step to determiningthe needs of the Austinmetro’s healthcare industry isto examine its currentworkforce. In this section,we examine characteristicssuch as industry employmentgrowth, and theperformance of middle-skillhealthcare occupations.Healthcare is one of the largest industry clusters in both Travis County and the Austin metro. In 2017,healthcare employment in the Austin metro was nearly 70,000 with Travis County representing nearly75% of all healthcare jobs in the region. In Travis County alone, healthcare employment grew by nearly6,700 jobs between 2012 and 2017.Demand for individual occupations can be measured using several metrics, including Job growth – How many new jobs are being created each year? Job openings – How many positions become available due to retirements or people changing careers?In the following analysis, we first show the current employment statistics for middle-skill healthcareoccupations. We then calculate a 5-year average of new occupational openings due to new job creation(i.e. job growth) and replacement needs due to workers retiring or permanently changing their career (i.e.job openings). Nationally, these openings account for 12% of all jobs and must be filled by new workers- either through post-secondary graduates or through on-the-job training for workers changing careersinto the occupation. Locally, these openings must be filled by new workers or an out-sized share ofexperienced workers flowing into the region.HEALTHCARE OCCUPATION EMPLOYMENT2012 – 201775,00069,29658,40151,39550,000 44,72725,000Travis CountyAustin Metro02012 2013 2014 2015 2016 20176
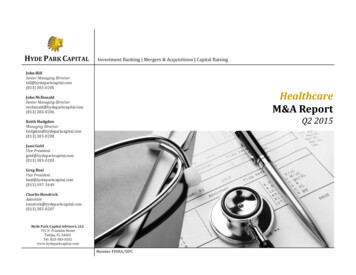
Middle-Skill Healthcare Occupation Employment VolumeThe Austin metro is home to nearly 50,000 middle-skill healthcare positions. Unsurprisingly, Registered Nurses represent the single-largestmiddle-skill healthcare occupation by a significant margin, with nearly 14,000 Registered Nurses, representing 28% of all middle-skillhealthcare occupations. Licensed Practical and Vocational Nurses and Nursing Assistants account for another 9,500 workers. MedicalAssistants total nearly 4,000 workers and Home Health Aides number 3,600.AUSTIN METRO HEALTHCARE EMPLOYMENT BY MIDDLE-SKILL OCCUPATION2017Registered Nurses*Nursing Assistants5,768Medical Assistants3,812Licensed Practical and Licensed Vocational Nurses3,733Home Health Aides3,572Pharmacy Technicians2,297Dental Assistants2,207Medical Records and Health Information Technicians1,403Dental Hygienists1,289Emergency Medical Technicians and Paramedics1,220Psychiatric Aides1,187Radiologic Technologists1,039Medical and Clinical Laboratory Technicians913Phlebotomists*792Surgical Technologists696Respiratory Therapists579Diagnostic Medical Sonographers443Psychiatric Technicians394Physical Therapist Assistants360Medical Equipment Preparers345Cardiovascular Technologists and Technicians296Ophthalmic Medical Technicians281Physical Therapist Aides247Orderlies232Medical : AVALANCHE CONSULTING / JOBSEQNote: The above graphic represents the top middle-skill healthcare occupations by 2017 employment volume. See separate Data Appendix for a full list of middle-skill occupations in the region.*Data on Registered Nurses include both middle-skill and more advanced positions.**Phlebotomists, along with EKG techs (not shown above), are increasingly being absorbed into other healthcare occupations. For example, many Medical Assistant education programs requirestudents also obtain Phlebotomy and EKG certifications.7
Workforce Supply and Demand MethodologyBelow is a table showing the projected annual job opportunities for middle-skill healthcare occupations in the Austin metro, along withtheir components – net new jobs created and ”job openings”. Nurses (RN, LPN) and Nursing Support (Nursing Assistants, Home HealthAides, Medical Assistants) show the largest numbers of new jobs and job openings, showing an increase in demand for positions along adirect patient care career pathway. Allied Health positions, including dental support and a range of technologist/technician jobs (e.g.Pharmacy, EMT, Medical Records) show large growth in 31-101531-9093PROJECTED OCCUPATIONAL OPENINGS AUSTIN METRO2017-2022 ANNUAL AVERAGEOccupation NameRegistered Nurses*Nursing AssistantsHome Health AidesMedical AssistantsLicensed Practical and Licensed Vocational NursesDental AssistantsPsychiatric AidesPharmacy TechniciansMedical Records and Health Information TechniciansDental HygienistsEmergency Medical Technicians and ParamedicsPhlebotomists**Radiologic TechnologistsSurgical TechnologistsMedical and Clinical Laboratory TechniciansPhysical Therapy AssistantsRespiratory TherapistsDiagnostic Medical SonographersOrderliesMedical Equipment PreparersNew b 25819016615813898929170646262SOURCE: AVALANCHE CONSULTING / JOBSEQNote: Totals may not equal 100% due to rounding*Data on Registered Nurses include both middle-skill and more advanced positions.**Phlebotomists, along with EKG techs (not shown above), are increasingly being absorbed into other healthcare occupations. For example, many Medical Assistant educationprograms require students also obtain Phlebotomy and EKG certifications.8
Workforce Supply and Demand MethodologyThe below table is continued from the previous page showing the projected annual job opportunities for additional middle-skillhealthcare occupations in the Austin metro, along with their components – net new jobs created and ”job openings”. Jobs showing growthin smaller volumes (below 60 positions a year, on average) include many of the more specialized technologist/technician occupations(Ophthalmic, Cardiovascular, MRI and Nuclear Medicine). These occupations, while still growing, account for smaller shares of themiddle-skill healthcare 03329-112431-201229-209229-2054PROJECTED OCCUPATIONAL OPENINGS AUSTIN METRO2017-2022 ANNUAL AVERAGEOccupation NamePsychiatric TechniciansPhysical Therapy AidesOccupational Therapy AssistantsOphthalmic Medical TechniciansMedical TranscriptionistsCardiovascular Technologists and TechniciansPharmacy AidesOccupational Health and Safety TechniciansDietary TechniciansMagnetic Resonance Imaging TechnologistsNuclear Medicine TechnologistsRadiation TherapistsOccupational Therapy AidesHearing Aid SpecialistsRespiratory Therapy TechniciansNew Jobs11128105824562321-3Job 332623211111972SOURCE: AVALANCHE CONSULTING / JOBSEQNote: Totals may not equal 100% due to rounding9
WORKFORCESUPPLYTravis County and thebroader Austin metro havenumerous colleges anduniversities, but are thesestudents pursuing degreesaligned with the needs ofhealthcare employers,particularly for middle skillpositions? Our analysisexamines growth trends ofdegree clusters, includingtheir overall size, growthtrajectories, and looks at theavailable programcompletion numbers formiddle-skill healthcareeducation and trainingprograms within the Austinmetro region.In 2016, the Austin metro produced over 5,200* graduates from post-secondary healthcare programs atall credential levels. Certificates (for-credit and non-credit at ACC, Goodwill, and Skillpoint Alliance)account for nearly 40% of all graduates and are likely larger when considering other non-creditprograms in the region. Associate degrees account for another 13% of all programs.HEALTHCARE GRADUATES BY AWARD LEVELAUSTIN METRO, 704Master's 05001,000 1,500 2,000 2,500In addition to examining postsecondary education institutions, we surveyed local Independent SchoolDistricts (ISDs) to determine healthcare program offerings at the postsecondary education level. All five ofthe ISDs that responded to the survey reported that at least one school in their district offers healthcareeducation programming. All five offer Career and Technical Education (CTE) programming, and most (4out of 5) offer career exploration and advising. 4 of the 5 institutions offer industry credentials in at leastone of the following: Nursing Assistance, Pharmacy Tech, and Medical Assistance. Many of the ISDsreported that more than 1 school offers healthcare programming available to over 100 high schoolstudents.SOURCE: AVALANCHE CONSULTING / US DEPT OF EDUCATION / NON-CREDIT PROVIDERS*Data includes 732 graduates from non-credit programs at ACC, Goodwill, and Skillpoint Alliance in 2017. Historical data is not available, sogrowth calculations only include for-credit graduates.10
Institutions in the Austin Metro – Healthcare GraduatesWhile nearly two dozen educational institutions report healthcare graduates within the Austin metro, talent production is highlyconcentrated. The Austin Community College (ACC) is responsible for nearly 40% of all sub-baccalaureate healthcare graduates (forwhich we have data in the region), and nearly 80% of Associate’s degrees. Awards at the certificate level are more distributed. Threeleading non-credit certificate providers are ACC, Goodwill, and Skillpoint Alliance.HEALTHCARE SUB-BACCALAUREATE GRADUATES FROM POSTSECONDARY EDUCATION INSTITUTIONS IN THE AUSTIN METRO2016InstitutionAustin Community CollegeGoodwillEverest Institute-Austin (Closed)The College of Health Care Professions-AustinVirginia College-AustinSouthern Careers Institute-AustinCyberTex Institute of TechnologySkillpoint AllianceSouth University-AustinNational American University-AustinNational American University-GeorgetownNational American University-Austin SouthTexas State UniversityCentral Texas Nurse Network2016 Total953607226192181140936612882****Non-Credit Certificate*285381For-Credit 112761SOURCE: AVALANCHE CONSULTING / US DEPT OF EDUCATION / NON-CREDIT PROVIDERSNote: Many Non-Credit programs do not report their statistics to the US Dept. of Education. The above includes select non-credit programs for which data were available.*Data for non-credit is 2017**May offer sub-baccalaureate programs for which no data is available11
Institutions in the Austin Metro – Program OfferingsHEALTHCARE CREDENTIAL OFFERINGS FROM POSTSECONDARY EDUCATION INSTITUTIONS IN THE AUSTIN METRONC Non-Credit TrainingC1 Certificate, 1 YearACCC2 Certificate, 1 2 YearsA AssociatesRNANursing Aides/AssistantsNCHome Health AidesMedical AssistantsNCLPN/LVNC2Dental AssistantsNCPsychiatric AidesA, C2Pharmacy Technicians/AidesC2Medical Records and HealthA, C2, NCInformation TechniciansDental HygienistsAEMT/ ParamedicA, C2PhlebotomyNCRadiologic/Nuclear TechnologistsA, C2, C1& Therapists (MRI)Surgical TechnologistsA, C2Medical and Clinical LaboratoryA, C2, C1TechniciansPhysical Therapist AssistantsARespiratory Technicians &TherapistsDiagnostic Medical SonographersA, C1Occupational Therapy AssistantsAOphthalmic Medical TechniciansNCCardiovascular Technologists andTechniciansPhysical Therapist AidesMedical TranscriptionistMedical ed)College ofHealth tuteCyberTex C2C2C2C2NCC2C2C2C2C1NC*NationalCentral TXSkillpoint SouthTexasAmericanNurseAlliance UniversityState**University*Network**NCNC**A- 12ANC**NC**C2C1ANC**C2C2A, C2NC**NC**ANCNC**C2AC1AA, PAAAANC**NC**C2ASOURCE: AVALANCHE CONSULTING / US DEPT OF EDUCATION / NON-CREDIT PROVIDERS/ CAEL ANALYSISNote: Many Non-Credit programs do not report their statistics to the US Dept. of Education. The above includes select non-credit programs for which data were available.*Austin, South Austin, and Georgetown campuses**May offer sub-baccalaureate programs for which no data is available12
Workforce Supply ChallengesEducation and training provider in the region report many successes in healthcare programming, such as significant student interest inhealthcare careers and successful employer engagement, but have also identified several key challenges to growing and sustaining thesupply of a locally trained healthcare workforce.Training providers report that access to, and making programmatic decisions on, labor market information is commonplace acrosshealthcare programs. More than other industries in the region, Healthcare employers engage with training providers through formal andinformal partnerships, CEO and healthcare leadership involvement, and advisory committees to help develop and tailor programofferings towards what occupations that employers currently and will need in the future. Training providers also gain real-time labormarket feedback through current students enrolled in clinical and internship programs. Obtaining access to and gathering feedback fromalumni of healthcare training programs appears to be a larger challenge.Training providers characterize enrollment in healthcare programs as strong due to an “infinite supply” of people wanting to work inhealthcare. Programs across providers like ACC, Skillpoint Alliance, and Goodwill are at capacity, creating fierce competition for themost popular programs at the larger training providers. Prospective students of programs at capacity are often provided with careerexploration services and encouraged to enroll in other healthcare programs, however it is critical to improve processes that identifystudents’ appropriate career pathways early to increase chances of completion and employment placement, and create more space inat-capacity programs. Providers report ongoing barriers to program completion that many students struggle with are common issuessuch as transportation, dependent care, and managing school around work schedules. Some providers partner with community-basedorganizations to fill that gap and provide semi-wraparound services to students.Barriers to program capacity and scale are driven by program placement in clinical space, particularly in nursing programs. The Austinmetro region is unique among larger metropolitans in its shortage of hospital systems available for placement. Training providers reportthat managing this task is becoming increasingly complex, particularly as the local four-year institutions increase enrollment in bachelor’sdegree programs in nursing and other healthcare specialties, which in some cases may take precedent for placement availability. Subbaccalaureate institutions report addressing this issue through various methods, such as expanding simulation labs in programming.However, this limits students’ exposure to work experience and connection to employers. Another common issue, if secondary relative toplacement capacity, is the availability and supply of qualified faculty – specifically in the “bottleneck” courses such as anatomy andphysiology.13
WORKFORCESUPPLYDEMANDGAPS:VOLUMERegional talent ecosystems thrive when local skills production is aligned with the labor demand. TheWorkforce Supply and Demand Analysis examines the current ability of local post-secondary institutionswithin the Austin metro Region to meet the needs of local employers. In this analysis we identifyoccupations expected to fuel local employment gains in the years ahead as well as the number of locallyawarded post-secondary degrees in aligned fields and identify occupations with potential futureshortages—or at least those where the supply of local graduates is insufficient to meet projecteddemand.This analysis views the gaps between available workforce through two dimensions: Volume and SupplyRatio. Volume measures the number of job openings minus the number of graduates from local trainingprograms. The largest volume gaps in the region are Nursing Aides, Registered Nurses, andLPN/LVNs.GAPS BETWEEN SUPPLY AND DEMANDMIDDLE-SKILL HEALTHCARE OCCUPATIONS*Largest GapsModerateGapsSmallest GapsOversupply Nursing Aide, Orderlies & Attendants Registered Nurses Ophthalmic Medical Technicians Medical Records & Health InformationTechnicians PhlebotomistsLPN/LVNMedical AssistantsDental AssistantsPharmacy Technicians/AidesDental Hygienists Physical Therapist Assistants Surgical Technologists Radiologic/Nuclear Technologists &Therapists Medical & Clinical LaboratoryTechnicians Cardiovascular Technologists &Technicians** Occupational Therapy Assistants Magnetic Resonance ImagingTechnologists** Respiratory Technicians & Therapists Diagnostic Medical Sonographers* Occupations for which there was insufficient data not listed** Small gap, but severely undersupplied14
Taking these two measures into consideration allows an understanding of both the occupations with thelargest gaps and those with the most severe undersupply ratio, without discounting occupations that maybe a smaller, but still critical field within healthcare. Below, these two measures are combined. Boldedoccupations indicate that the gap between supply and demand is at least 50 jobs annually. Within thefive ratio groups, occupations are sorted according to the volume gap.SEVERESHORTAGEDental HygienistsOphthalmic Medical Technicians Cardiovascular Technologists & TechniciansMagnetic Resonance Imaging TechnologistsSHORTAGE Nursing Aide, Orderlies & AttendantsRegistered NursesLicensed Practical/Vocational NursesDental Assistants Pharmacy Technicians/AidesPhlebotomistsPhysical Therapist AssistantsOccupational Therapy Assistants Radiologic/Nuclear Technologists & TherapistsMedical & Clinical Laboratory TechniciansRespiratory Technicians & Therapists Medical AssistantsMedical Records & Health InformationTechniciansSurgical Technologists Diagnostic Sonographers Home Health AidesPsychiatric AidesEmergency Medical Technicians & Paramedics Psychiatric TechniciansMedical TranscriptionistsOccupational Therapy AidesUNKNOWNSURPLUS MODERATESHORTAGEThe following pages provide more detailed information on each of the below occupations.OVER/UNDERSUPPLY RATIOWORKFORCESUPPLYDEMANDGAPS:SUPPLY RATIO The Ratio measures the number of graduates versus the demand for jobs. The most severelyundersupplied as a share of demand (less than 20%) are Ophthalmic Medical Technicians, DentalHygienists, Cardiovascular Technologists and Technicians, and Magnetic Resonance ImagingTechnologists.Note: Severe Shortage 20%; Shortage 20-50%; Moderate Shortage 50-100%; Sup“Unknown” indicates that available data is insufficient to calculate a rati15in the case of non-credit training.
Workforce Supply-Demand Conditions TablesWhile some degrees are precisely designed for a single occupation, matching other disciplines is less straightforward. In addition, thedegree’s award level will affect its match with an occupation. For example, a certificate or two-year Associate’s degree in computerscience may only qualify someone for a computer support position, while a Bachelor’s degree in computer science is preparation for acomputer programmer position. Specific to health care, a Psychology graduate with a Bachelor’s degree is not qualified to practice(without additional education). Unlike other supply-demand taxonomies in use today, this taxonomy extends to matching degrees andoccupations at each education level (certificates, Associate’s, Bachelor’s, Master’s and Doctorate).BalanceThe colored bar in the chart measures the supply-demand “gap.” The gap isthe ratio of college graduates versus average job demand. A higherpercentage indicates more college graduates per job.Severe ShortageGap2ShortageOccupation GroupPhysical Therapist AssistantsModerate ShortageEducationLevelAssociate'sDegreeLocal degree outputcorresponding to theoccupation group. Degreeclassifications typically include2-5 degree codes by awardlevel.SurplusAnnual JobOpenings136Local OutputCompletionsGap% of Jobs498736%Occupation GroupA classificationtypically consisting of2-3 occupationsDegree LevelRequired for Jobs(Certificate,Associate’s, Bachelor’s,etc.)JobsDemand forecast is the annual average “New& Replacement Jobs” each year from 20172022. “New & Replacement” jobs include thenet new jobs forecast for that occupation plusthe average replacement jobs created due toretirements and persons exiting the field.GapThe absolute difference involume between collegesgradates and available jobs. Anegative number indicates thatthere are more available jobsthan college graduates16
Supply-Demand Conditions- AllOccupation GroupNursing Aide, Orderlies & AttendantsRegistered NursesLicensed Practical and Licensed Vocational NursesMedical AssistantsDental AssistantsPharmacy Technicians/AidesDental HygienistsOphthalmic Medical TechniciansMedical Records and Health Information TechniciansPhlebotomistsPhysical Therapist AssistantsSurgical TechnologistsRadiologic/Nuclear Technologists & TherapistsMedical and Clinical Laboratory TechniciansCardiovascular Technologists and TechniciansOccupational Therapy AssistantsMagnetic Resonance Imaging TechnologistsRespiratory Technicians & TherapistsDiagnostic Medical SonographersHome Health AidesPsychiatric AidesEmergency Medical Technicians and ParamedicsPsychiatric TechniciansMedical TranscriptionistsOccupational Therapy AidesSevere Shortage 20%Shortage20 50%Edu. Level Annual Job OpeningsCertificate1,631Assoc 35142514950113474143578028023000Gap 5-161,08531614354389% of 14%79%126%3%0%14%0%0%0%Moderate ShortageSurplusUnknown50-100% 100%Insufficient Data17
Supply-Demand Conditions – Severe Shortage by RatioSevere Shortage: local graduates comprise 20% to 50% of job openings Dental Hygienists and Ophthalmic Medical Technicians both have severe shortages with gaps of more than 100 jobs. DentalHygienists in particular were identified by education and training providers as an in-demand program area with limited capacity. Cardiovascular Technologists and Technicians are seeing severe shortages by ratio but their demand and gap volumes are relativelylow. This occupation was identified as a high workforce challenge area by Partnership employers, indicating that the demand for thisjob may be increasing or there are other elements besides volume making it a challenge to hire MRI technologists indicate severe shortages but their volume indicates these challenges are less significant in the field.WORKFORCE SUPPLY- DEMAND CONDITIONS TABLE- SEVERE SHORTAGE OCCUPATIONSGapOccupation GroupDental HygienistsOphthalmic Medical TechniciansCardiovascular Technologists and TechniciansMagnetic Resonance Imaging TechnologistsSevere Shortage 20%Shortage20 50%Edu. nnual JobOpenings1901413721Completions13543Gap #1771363318% of Jobs7%4%11%14%Moderate ShortageSurplusUnknown50-100% 100%Insufficient Data18
Supply-Demand Conditions – Severe Shortage by RatioDental Hygienists and Ophthalmic Technicians show large gaps in both ratio and volume of supply compared to demand, but have alsoseen wages decline over the last five years. Education and training providers, however, report significant interest from students andpotential students for Dental Hygienist programming. Similarly, Cardiovascular Technologists were reported to be difficult to hire by thePartnership but entry level wages over the 2012-2017 time period decreased by 25%.SUPPLY / DEMAND GAP CONDITIONSPROJECTED ANNUAL OPENINGS VS. GRADUATESAUSTIN METRO COUNTY MEDICAL OCCUPATION GROUPS2012 – 2017 GROWTH21%190Dental HygienistsDental Hygienists13-2%-1%166Ophthalmic Medical Techni
Healthcare is one of the largest industry clusters in both Travis County and the Austin metro. In 2017, healthcare employment in the Austin metro was nearly 70,000 with Travis County representing nearly 75% of all healthcare jobs in the region. In Travis County alone, healthcare employment grew by nearly 6,700 jobs between 2012 and 2017.