Transcription
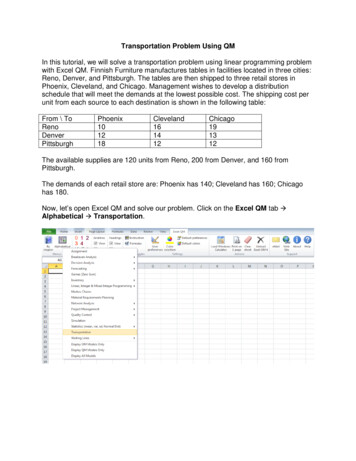
Transportation Problem Using QMIn this tutorial, we will solve a transportation problem using linear programming problemwith Excel QM. Finnish Furniture manufactures tables in facilities located in three cities:Reno, Denver, and Pittsburgh. The tables are then shipped to three retail stores inPhoenix, Cleveland, and Chicago. Management wishes to develop a distributionschedule that will meet the demands at the lowest possible cost. The shipping cost perunit from each source to each destination is shown in the following table:From \ Chicago191312The available supplies are 120 units from Reno, 200 from Denver, and 160 fromPittsburgh.The demands of each retail store are: Phoenix has 140; Cleveland has 160; Chicagohas 180.Now, let’s open Excel QM and solve our problem. Click on the Excel QM tab Alphabetical Transportation.
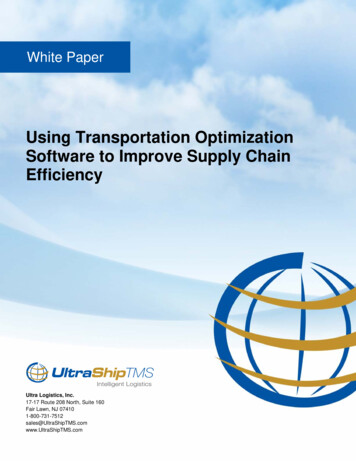
In the Spreadsheet Initialization window, be sure to identify that we have three originsand three destinations and we want to minimize our costs.Click OK. A spreadsheet will display.
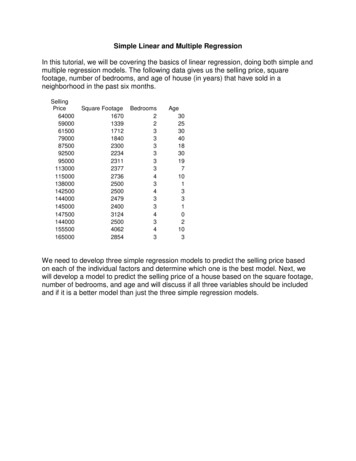
Enter the data shown above into the spreadsheet table.Once you have the data entered correctly, click the Data tab and then Solver.
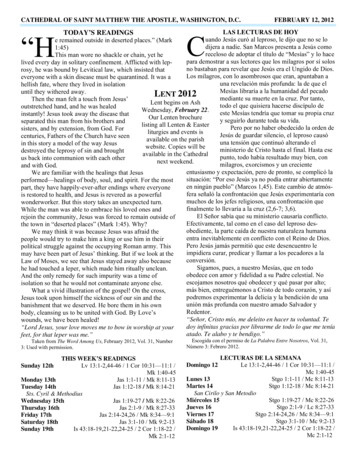
A Solver Parameters window will appear.Click Solve and then OK in the Solver Results window. Our results are shown on thenext page.
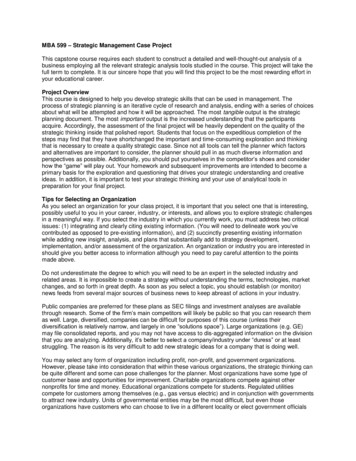
DataCOSTSRenoDenverPittsburghDemandPhoenix Cleveland Chicago Supply101619120121413200181212160480 \140160180 480ShipmentsRowShipments Phoenix Cleveland Chicago Column480 \Total140160180 480Total Cost5700The optimal solution found using computer software for the transportation algorithm is toship 120 from Reno to Phoenix, 20 from Denver to Phoenix, 160 from Pittsburgh toCleveland, and 180 from Denver to Chicago. The total cost is 5,700. Click here todownload the completed spreadsheet table so you can compare it to yours.This concludes our tutorial on solving a transportation problem using linearprogramming problem with Excel QM.
with Excel QM. Finnish Furniture manufactures tables in facilities located in three cities: Reno, Denver, and Pittsburgh. The tables are then shipped to three retail stores in Phoenix, Cleveland, and Chicago. Management wishes to develop a distribution schedule that will meet the demands at the lowest possible cost. The shipping cost per unit from each source to each destination is shown in .