Transcription
WMS TutorialsIntroduction to WMSv. 10.1WMS 10.1 TutorialIntroduction to WMSBecome familiar with the WMS interfaceObjectivesImport files into WMS and change modules and display options to become familiar with the WMSinterface.Prerequisite Tutorials NoneRequired Components DataMapPage 1 of 19Time 30–35 minutes Aquaveo 2016
WMS TutorialsIntroduction to WMS123Introduction . 2Getting Started . 2The WMS Screen . 33.1Main Graphics Window . 33.2The Project Explorer . 33.3The Properties Window. 44Macros . 54.1Menu Bar and Macro Toolbar . 55Opening Files . 56Changing the Display . 76.1Adjusting Image Transparency . 76.2Changing Display Options . 87Static Tools. 97.1Pan and Zoom . 97.2Rotating a DEM . 108Modules and Dynamic Tools . 128.1Modules . 128.2Dynamic Tools . 129Using the Map Module. 159.1Creating a New Coverage . 159.2Using the Drainage Coverage and Map Tools . 1510 The Hydrologic Modeling Module . 1611 Using Annotations . 1712 Saving a Project . 1813 Conclusion. 191IntroductionThis tutorial discusses and demonstrates the WMS interface and help system. Feel free toexplore the different menus, modules and tools to become familiar with the interface.The following will be covered here:1. Modules, menus, tools, display options, and the help system in WMS.2. Importing a digital elevation map (DEM) and a background image.Tutorial files needed for these tutorials are found in the WMS Learning Center on theAquaveo web site.12Getting StartedStarting WMS new at the beginning of each tutorial is recommended. This resets the data,display options, and other WMS settings to their defaults. To do this:1. If necessary, launch WMS.2. If WMS is already running, press Ctrl-N or select File New to ensure that theprogram settings are restored to their default state.3. A dialog may appear asking to save changes. Click No to clear all -tutorialsPage 2 of 19 Aquaveo 2016
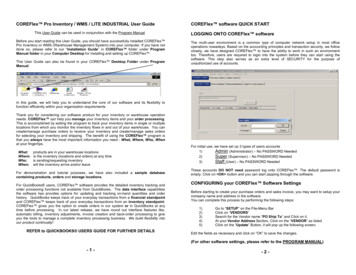
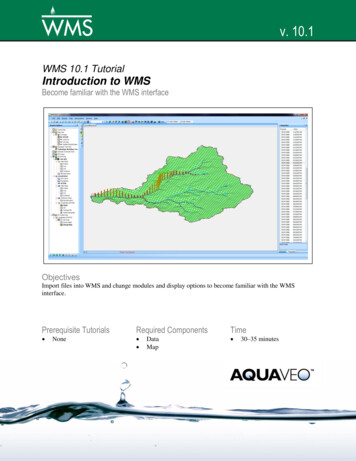
WMS TutorialIntroduction to WMSThe graphics window of WMS should refresh to show an empty space.3The WMS ScreenThe WMS screen is divided into several main sections: the Main Graphics Window, theProject Explorer (this may also be referred to as the Tree Window), the Modules, theMenu Bar, the Properties Window, the Toolbars, the Get Data and Units sections, theCursor Coordinates and Selection Info bar, and the Help Strip (Figure 1). The MainGraphics Window generally fills the majority of the screen.Figure 13.1WMS interface layoutMain Graphics WindowThe Main Graphics Window—or just Graphics Window—is generally the biggest part ofthe WMS screen. Most of the data manipulation is done in this window. DEMS or otherdownloaded images appear in this window.3.2The Project ExplorerThe Project Explorer window (Figure 2) allows viewing of all the data that makes up aproject. It contains a hierarchical representation of the data. It appears by default on theleft side of the screen, but can be docked on either side, or viewed as a separate window.The main function of the Project Explorer window is to manage data. It can do so inmultiple ways, including creation of new data objects, deletion of data objects, andcontrol of what appears in the Graphics Window.Turning visibility on and off for an individual entry in the Project Explorer is done byclicking on the check box to the left of each item.Page 3 of 19 Aquaveo 2016
WMS TutorialIntroduction to WMSFigure 23.3Project Explorer windowThe Properties WindowThe Properties window (Figure 3) defaults to the right side of the WMS window. It iscomprised of edit and information fields. The edit fields can be used to edit thecoordinates of selected objects (e.g., points, nodes, vertices). Like the Project Explorer,this window can be docked on either side of the WMS window or viewed as a separatewindow.Figure 3Properties windowPage 4 of 19 Aquaveo 2016
WMS Tutorial4Introduction to WMSMacros4.1Menu Bar and Macro ToolbarThe Menu Bar contains menus with data manipulation commands. The menus shown inthe Menu Bar depend on the active module. The WMS wiki2 has more detailedinformation on the basic elements of the WMS graphical user interface (GUI). To accessthe WMS wiki, select Help WMS Help and the WMS wiki will open in an internetbrowser.The macros appear in a toolbar directly below the menu bar as a set of icons at the top ofthe tool palette. They are shortcuts to frequently used menu commands.5 New Open Save– Saves the current project. Print– Prints the visible contents of the Graphics Window. Perspective View– Displays the data in the Graphics Window in a 3Dperspective (also called “Oblique View”). Plan View– Displays data in the Graphics Window from a top-downperspective, like a blueprint. Frame– Centers the entire project within the Graphics Window with allextents visible. Display Options– Brings up the Display Options dialog. Used to changehow the project is displayed in the Graphics Window, including which elementsare displayed, colors, and other settings. Contour Options– Brings up the Contour Options dialog. Used to setoptions for how contours appear. Properties– Brings up the Dataset Info dialog. Used to adjust the propertiesof the selected object. Refresh Help Delete– Deletes any selected objects. The Delete and Backspace keys can beused for this same purpose.– Creates a new project.– Opens an existing project or other file.– Redraws the contents of the Graphics Window.– Accesses the WMS Help website.Opening FilesTo open a file, do the following:1. Select File Open to bring up the Open dialog.2http://www.xmswiki.com/wiki/WMS:WMSPage 5 of 19 Aquaveo 2016
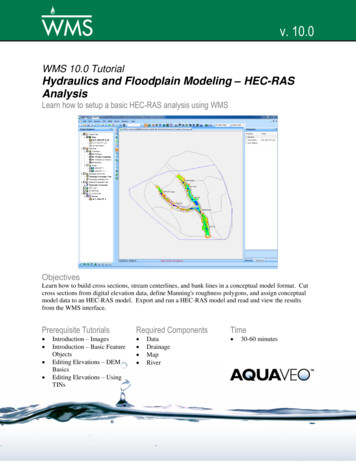
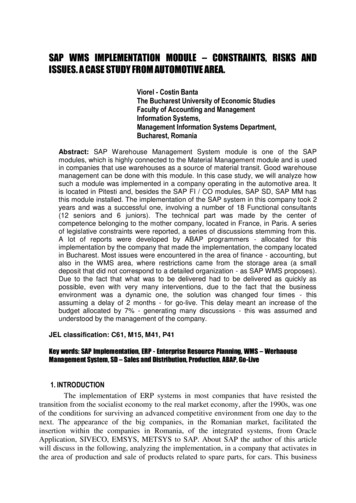
WMS TutorialIntroduction to WMS2. Browse to the demedit\demedit\ directory and select “trailmount.dem”.3. Click Open to exit the Open dialog and open the Importing USGS DEMs dialog.4. In the Files section, select “Trail Mountain” from the list.5. Click OK to accept the defaults and close the Importing USGS DEMs dialog.The DEM data should appear in the main graphics window (Figure 4). Notice the item“ trailmount” is now under “ Terrain Data” in the Project Explorer.Figure 4Opened DEM fileNow import a topographic map in TIFF format:1. Select Opento bring up the Open dialog.Using the macro is the same as using the command in the File menu.2. Select “trailmountain.TIF” and click Open to import the file and exit the Opendialog.3. If a dialog appears asking to convert the TIFF to a JPEG, click No to close thedialog.4. If a dialog appears asking to build image pyramids, click No to close the dialog.Image pyramids are sets of images that are resampled at different resolutions using theoriginal image to make the image look better for on-screen display.Notice that “ trailmountain.TIF” has appeared under “ GIS Data” in the ProjectExplorer. The image should appear underneath the DEM contour data (Figure 5).Page 6 of 19 Aquaveo 2016
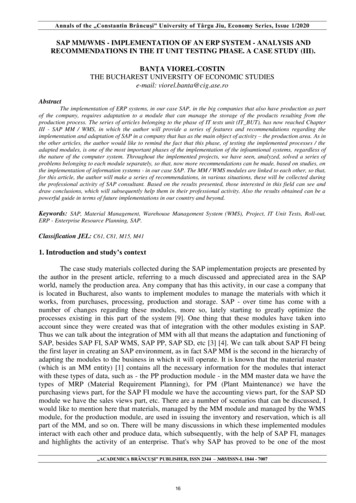
WMS TutorialIntroduction to WMSFigure 56TIFF image with DEM overlayChanging the DisplayIn later projects, it will be necessary to adjust the display of data in the graphics window.WMS contains many tools for visualizing data.6.1Adjusting Image TransparencyThe imported image makes the DEM data difficult to see. Adjusting the imagetransparency will make the DEM more visible.To do this:1. Right-click on “ traimountain.TIF” and select Set Transparency to bringup the Image Transparency dialog.2. Use the slider to change the transparency to “75%”.3. Click OK to set the new transparency level and close the Image Transparencydialog.Notice that the image is now faded out and the DEM data contours are more prominent(Figure 6). Adjusting the image transparency is commonly done when creating featureobjects in the map module.Page 7 of 19 Aquaveo 2016
WMS TutorialIntroduction to WMSFigure 66.2DEM over a TIFF image with a set transparencyChanging Display OptionsMost of the options for controlling how data is displayed in the Graphics Window are inthe Display Options dialog.1. In the Project Explorer, turn off “the Graphics Window.2. Select “trailmount” under the “3. Click Display Optionstrailmountain.TIF” so it no longer appears inTerrain Data” folder to make it active.to bring up the Display Options dialog.4. Select “DEM Data” from the list on the left.5. On the DEM tab, turn on DEM Contours.6. Click Options to bring up the Contour Options dialog.The dialog can also be reached by clicking on the Contoursmacro.7. In the Contour Method section, select “Color Fill” from the first drop-down.8. Click OK to close the trailmount Contour Options dialog.9. Click OK to close the Display Options dialog.The DEM in the Graphics Window should appear as inPage 8 of 19Figure 7. Aquaveo 2016
WMS TutorialIntroduction to WMSFigure 77DEM with the color fill contour optionStatic ToolsStatic Tools are used for manipulating the display, such as zooming, panning, and 3Drotation. The toolbar is shown below, and a description of each of the static tools followsbelow that.7.1 Pan Zoom Rotate– Use to rotate the image on the X and Z axes to allow for viewingfrom different angles. View Previous– Redraws the contents of the Graphics Window to the stateprior to the most recent viewing command (zoom, rotate, pan). View Next– Redraws the contents of the Graphics Window to the state afterto the most recent viewing command. Can only be used after View Previous hasbeen used.– Use to move the contents of the Graphics Window in any direction.– Use to zoom in on the contents of the Graphics Window.Pan and ZoomTo practice using the Panand Zoomtools, follow the steps below:1. Select the Zoomtool and click on the center of the DEM in the GraphicsWindow to zoom in.Page 9 of 19 Aquaveo 2016
WMS TutorialIntroduction to WMS2. Hold down the Shift key and click on the DEM again to zoom out.3. Select the Pancenter it.4. Select the Zoomtool then click and drag the DEM in the graphics window totool again. Click and drag over the area in Figure 8.Note that if a mouse with a scroll wheel is available, the display can be panned byholding down the scroll while moving the mouse. The display can also be zoomed in andout by scrolling up and down with the scroll wheel.Figure 8Zoom area5. To finish, click on the FrameGraphics Window.7.2macro to resize and center the DEM in theRotating a DEMThe DEM can be rotated to different angles using a variety of tools:1. Select Display View Oblique View from the top menu in WMS.This command updates the display to show data at an oblique view. The DEM shouldnow resemble Figure 9.Page 10 of 19 Aquaveo 2016
WMS TutorialIntroduction to WMSFigure 9Oblique view2. Select Display View Side View from the top menu.This shows the side elevation of the DEM data.3. Click the View Previousbutton to return to the oblique view.Not that the View Nextbutton appears once the View Previousbutton has beenclicked. Now exaggerate the elevation values and make them more visible:4. Click Display Optionsto bring up the Display Options dialog.5. At the lower left, turn off Auto z-mag and enter “5” as the Z magnification.6. Click OK to close the Display Options dialog.The DEM data should now look like Figure 10.Figure 10Z magnification7. Select the Rotatetool, then click and drag in the main graphics windowseveral times. Notice how the view rotates.8. Click on the Plan Viewmacro to return to an overhead view of the data.Page 11 of 19 Aquaveo 2016
WMS Tutorial8Introduction to WMSModules and Dynamic Tools8.1Modul
The WMS screen is divided into several main sections: the Main Graphics Window, the Project Explorer (this may also be referred to as the Tree Window), the Modules, the Menu Bar, the Properties Window, the Toolbars, the Get Data and Units sections, the Cursor Coordinates and Selection Info bar, and the Help Strip (Figure 1). The Main Graphics Window generally fills the majority of the screen .