Transcription
National Diabetes Statistics Report2020Estimates of Diabetes and Its Burden in the United StatesThis document is intended to provide up-to-date scientific dataand statistics on diabetes and its burden in the United States.Formerly known as the National Diabetes Fact Sheet, thisconsensus document is written primarily for a scientific audience.CS 314227-A
National Diabetes Statistics Report, 2020CONTENTSIntroduction. . . . . . . . . . . . . . . . . . . . . . . . . . . . . . . . . . . . . . . . . . . . . . . . . . . . . . . . . . . . . . . . . . . . . . . . . . . . . . . . . . . 1Methods . . . . . . . . . . . . . . . . . . . . . . . . . . . . . . . . . . . . . . . . . . . . . . . . . . . . . . . . . . . . . . . . . . . . . . . . . . . . . . . . . . . . . . 1Results. . . . . . . . . . . . . . . . . . . . . . . . . . . . . . . . . . . . . . . . . . . . . . . . . . . . . . . . . . . . . . . . . . . . . . . . . . . . . . . . . . . . . . . . 2Prevalence of Diabetes (Diagnosed and Undiagnosed) . . . . . . . . . . . . . . . . . . . . . . . . . . . . . . . . . . . . . . . . . . . . 2Prevalence of Diagnosed Diabetes . . . . . . . . . . . . . . . . . . . . . . . . . . . . . . . . . . . . . . . . . . . . . . . . . . . . . . . . . . . . . . . 4Incidence of Diagnosed Diabetes (Newly Diagnosed Diabetes) . . . . . . . . . . . . . . . . . . . . . . . . . . . . . . . . . . . . . 5Prevalence of Prediabetes Among Adults . . . . . . . . . . . . . . . . . . . . . . . . . . . . . . . . . . . . . . . . . . . . . . . . . . . . . . . . . 8Risk Factors for Diabetes-Related Complications . . . . . . . . . . . . . . . . . . . . . . . . . . . . . . . . . . . . . . . . . . . . . . . . . . 9Preventing Diabetes-Related Complications. . . . . . . . . . . . . . . . . . . . . . . . . . . . . . . . . . . . . . . . . . . . . . . . . . . . . . 10Coexisting Conditions and Complications. . . . . . . . . . . . . . . . . . . . . . . . . . . . . . . . . . . . . . . . . . . . . . . . . . . . . . . . 11Acknowledgments. . . . . . . . . . . . . . . . . . . . . . . . . . . . . . . . . . . . . . . . . . . . . . . . . . . . . . . . . . . . . . . . . . . . . . . . . . . . 14References . . . . . . . . . . . . . . . . . . . . . . . . . . . . . . . . . . . . . . . . . . . . . . . . . . . . . . . . . . . . . . . . . . . . . . . . . . . . . . . . . . . 14Suggested Citation . . . . . . . . . . . . . . . . . . . . . . . . . . . . . . . . . . . . . . . . . . . . . . . . . . . . . . . . . . . . . . . . . . . . . . . . . . . 14Appendix A: Detailed Tables . . . . . . . . . . . . . . . . . . . . . . . . . . . . . . . . . . . . . . . . . . . . . . . . . . . . . . . . . . . . . . . . . . . 15Appendix B: Detailed Methods and Data Sources. . . . . . . . . . . . . . . . . . . . . . . . . . . . . . . . . . . . . . . . . . . . . . . . 21ii
National Diabetes Statistics Report, 2020INTRODUCTIONThe National Diabetes Statistics Report, a periodic publication of the Centers for Disease Control andPrevention (CDC), provides information on the prevalence and incidence of diabetes and prediabetes,risk factors for complications, acute and long-term complications, deaths, and costs. These data can helpfocus efforts to prevent and control diabetes across the United States. This document is an update of the2017 National Diabetes Statistics Report and is intended for a scientific audience.METHODSNew in 2020, this National Diabetes Statistics Report features trends in prevalence and incidenceestimates over time.The estimates in this document (unless otherwise noted) were derived from various data systems ofCDC, Indian Health Service (IHS), Agency for Healthcare Research and Quality (AHRQ), and US CensusBureau, and from published research studies. Estimated percentages and total number of people withdiabetes and prediabetes were derived from the National Health and Nutrition Examination Survey(NHANES), National Health Interview Survey (NHIS), IHS National Data Warehouse (NDW), Behavioral RiskFactor Surveillance System (BRFSS), United States Diabetes Surveillance System (USDSS), and US residentpopulation estimates.Diagnosed diabetes status was determined from self-reported information provided by surveyrespondents; for American Indians and Alaska Natives who accessed IHS or tribal health facilities thatsubmitted medical records data to the IHS NDW, clinical diagnostic codes were also used. Undiagnoseddiabetes was determined by measured fasting plasma glucose or A1C levels. Numbers and rates foracute and long-term complications of diabetes were derived from the National Inpatient Sample (NIS)and National Emergency Department Sample (NEDS), as well as NHIS.For some measures, estimates were not available for certain racial and ethnic subgroups due to smallsample sizes.An alpha level of 0.05 was used when determining statistically significant differences between groups.Age-adjusted estimates were calculated among adults aged 18 years or older by the direct method tothe 2000 US Census standard population, using age groups 18–44, 45–64, and 65 years or older. Mostestimates of diabetes in this report do not differentiate between type 1 and type 2 diabetes. However,as type 2 diabetes accounts for 90% to 95% of all diabetes cases, the data presented here are more likelyto be characteristic of type 2 diabetes, except as noted.More information about the data sources, methods, and references is available in the Detailed Methodsand Data Sources section.1
National Diabetes Statistics Report, 2020RESULTSPrevalence of Diabetes (Diagnosed and Undiagnosed)(See Detailed Methods)Among the US population overall, crude estimates for 2018 were: 34.2 million people of all ages—or 10.5% of the US population—had diabetes. 34.1 million adults aged 18 years or older—or 13.0% of all US adults—had diabetes (Table 1a; Table 1b). 7.3 million adults aged 18 years or older who met laboratory criteria for diabetes were not aware of ordid not report having diabetes (undiagnosed diabetes, Table 1b). This number represents 2.8% of all USadults (Table 1a) and 21.4% of all US adults with diabetes. The percentage of adults with diabetes increased with age, reaching 26.8% among those aged 65 yearsor older (Table 1a).Table 1a. Estimated crude prevalence of diagnosed diabetes, undiagnosed diabetes, and total diabetes amongadults aged 18 years or older, United States, 2013–2016Diagnosed diabetesPercentage(95% CI)Undiagnosed diabetesPercentage(95% CI)Total diabetesPercentage(95% CI)10.2 (9.3–11.2)2.8 (2.4–3.3)13.0 (12.0–14.1)18–443.0 (2.6–3.6)1.1 (0.7–1.8)4.2 (3.4–5.0)45–6413.8 (12.2–15.6)3.6 (2.8–4.8)17.5 (15.7–19.4) 6521.4 (18.7–24.2)5.4 (4.1–7.1)26.8 (23.7–30.1)Men11.0 (9.7–12.4)3.1 (2.3–4.2)14.0 (12.3–15.5)Women9.5 (8.5–10.6)2.5 (2.0–3.2)12.0 (11.0–13.2)White, non-Hispanic9.4 (8.4–10.5)2.5 (1.9–3.3)11.9 (10.9–13.0)Black, non-Hispanic13.3 (11.9–14.9)3.0 (2.0–4.5)16.4 (14.7–18.2)Asian, non-Hispanic11.2 (9.5–13.3)4.6 (2.8–7.2)14.9 (12.0–18.2)Hispanic10.3 (8.1–13.1)3.5 (2.5–4.8)14.7 (12.5–17.3)CharacteristicTotalAge in yearsSexRace/ethnicityNotes: CI confidence interval. Diagnosed diabetes was based on self-report. Undiagnosed diabetes was based on fasting plasma glucose and A1C levelsamong people self-reporting no diabetes. Numbers for subgroups may not add up to the total because of rounding. Age-adjusted estimates are presentedin Appendix Table 1.Data source: 2013–2016 National Health and Nutrition Examination Survey.2
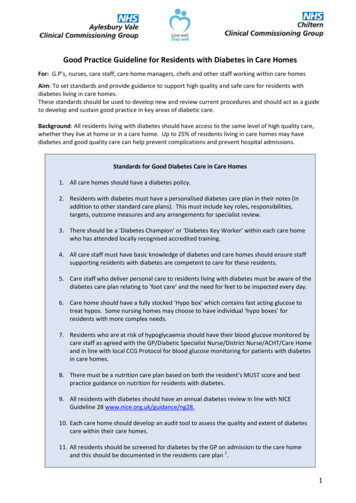
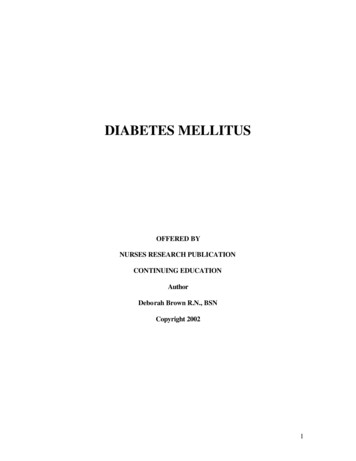
National Diabetes Statistics Report, 2020Table 1b. Estimated number of adults aged 18 years or older with diagnosed diabetes, undiagnosed diabetes,and total diabetes, United States, 2018Diagnosed diabetesNumber in Millions(95% CI)Undiagnosed diabetesNumber in Millions(95% CI)Total diabetesNumber in Millions(95% CI)26.8 (24.4–29.1)7.3 (6.3–8.4)34.1 (31.6–36.6)18–443.6 (3.0–4.1)1.4 (0.8–1.9)4.9 (4.0–5.8)45–6411.7 (10.3–13.1)3.1 (2.3–3.9)14.8 (13.4–16.3) 6511.5 (10.1–12.8)2.9 (2.1–3.6)14.3 (12.7–15.9)Men14.0 (12.4–15.6)3.9 (2.8–5.0)17.9 (16.2–19.6)Women12.8 (11.4–14.1)3.4 (2.7–4.1)16.2 (14.8–17.6)CharacteristicTotalAge in yearsSexRace/ethnicityWhite, non-Hispanic15.4 (13.8–17.0)4.1 (3.1–5.2)19.5 (17.9–21.2)Black, non-Hispanic4.2 (3.8–4.7)0.9 (0.6–1.3)5.2 (4.7–5.7)Asian, non-Hispanic1.6 (1.3–2.0)0.7 (0.4–1.0)2.3 (1.9–2.8)Hispanic4.9 (4.1–5.6)1.5 (1.0–1.9)6.4 (5.4–7.3)Notes: CI confidence interval. Estimated numbers for 2018 were derived from percentages for 2013–2016 applied to July 1, 2018 US resident population estimatesfrom the US Census Bureau (See Detailed Methods). Diagnosed diabetes was based on self-report. Undiagnosed diabetes was based on fasting plasma glucose andA1C levels among people self-reporting no diabetes. Numbers for subgroups may not add up to the total because of rounding.Data sources: 2013–2016 National Health and Nutrition Examination Survey; 2018 US Census Bureau data.Trends in Prevalence of Diagnosed Diabetes, Undiagnosed Diabetes, and Total Diabetes During 1999–2016, the age-adjusted prevalence of total diabetes significantly increased among adultsaged 18 years or older (Figure 1). Prevalence estimates were 9.5% in 1999–2002 and 12.0% in 2013–2016 (Appendix Table 2). During this period, the age-adjusted prevalence significantly increased for diagnosed diabetes. Nosignificant change in undiagnosed diabetes prevalence was detected (Figure 1; Appendix Table 2).Figure 1. Trends inage-adjusted prevalenceof diagnosed diabetes,undiagnosed diabetes,and total diabetes amongadults aged 18 yearsor older, United States,1999–2016.Age-adjustedPercentage14Total Diabetes1210Diagnosed Diabetes86Notes: Diagnosed diabetes wasbased on self-report. Undiagnoseddiabetes was based on fasting plasmaglucose and A1C levels among peopleself-reporting no diabetes.Data source: 1999–2016 National Healthand Nutrition Examination Surveys.Undiagnosed �20062007–2008Time Period32009–20102011–20122013–2014 2015–2016
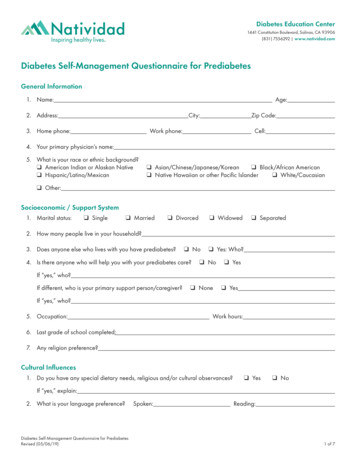
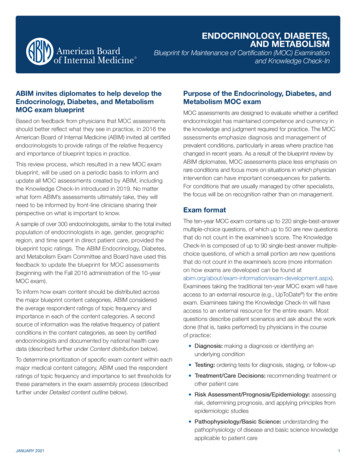
National Diabetes Statistics Report, 2020Prevalence of Diagnosed Diabetes(See Detailed Methods)Among the US population overall, crude estimates for 2018 were: 26.9 million people of all ages—or 8.2% of the US population—had diagnosed diabetes. 210,000 children and adolescents younger than age 20 years—or 25 per 10,000 US youths—had diagnosed diabetes. This includes 187,000 with type 1 diabetes. 1.4 million adults aged 20 years or older—or 5.2% of all US adults with diagnosed diabetes—reportedboth having type 1 diabetes and using insulin. 2.9 million adults aged 20 years or older—or 10.9% of all US adults with diagnosed diabetes—startedusing insulin within a year of their diagnosis.Among US adults aged 18 years or older, age-adjusted data for 2017–2018 indicated the following: Prevalence of diagnosed diabetes was highest among American Indians/Alaska Natives (14.7%),people of Hispanic origin (12.5%), and non-Hispanic blacks (11.7%), followed by non-Hispanic Asians(9.2%) and non-Hispanic whites (7.5%) (Appendix Table 3). American Indians/Alaska Natives had the highest prevalence of diagnosed diabetes for women (14.8%)(Figure 2; Appendix Table 3). American Indian/Alaska Native men had a significantly higher prevalence of diagnosed diabetes(14.5%) than non-Hispanic black (11.4%), non-Hispanic Asian (10.0%), and non-Hispanic white(8.6%) men (Figure 2; Appendix Table 3). Among adults of Hispanic origin, Mexicans (14.4%) and Puerto Ricans (12.4%) had the highestprevalences, followed by Central/South Americans (8.3%) and Cubans (6.5%) (Appendix Table 3). Among non-Hispanic Asians, Asian Indians (12.6%) and Filipinos (10.4%) had the highest prevalences,followed by Chinese (5.6%). Other Asian groups had a prevalence of 9.9% (Appendix Table 3). Among adults, prevalence varied significantly by education level, which is an indicator ofsocioeconomic status. Specifically, 13.3% of adults with less than a high school education haddiagnosed diabetes versus 9.7% of those with a high school education and 7.5% of those with morethan a high school education (Appendix Table 3).Figure 2. Age-adjustedestimated prevalenceof diagnosed diabetesby race/ethnicity groupand sex for adults aged18 years or older, UnitedStates, Note: Error bars represent upperand lower bounds of the 95%confidence interval.6Data sources: 2017–2018 NationalHealth Interview Survey; 2017Indian Health Service National DataWarehouse (for American Indian/Alaska Native group only).240American Indian/Alaska NativeAsian, Non-HispanicBlack, Non-HispanicRace/Ethnicity4HispanicWhite, Non-Hispanic
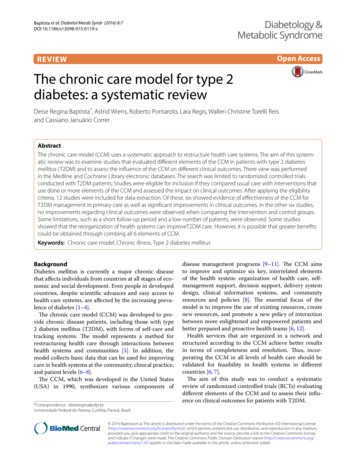
National Diabetes Statistics Report, 2020County-Level Prevalence Among Adults (See Detailed Methods)Among US adults aged 20 years or older, age-adjusted, county-level data indicated: In 2016, estimates of diagnosed diabetes prevalence varied across US counties, ranging from1.5% to 33.0% (Figure 3). Median county-level prevalence of diagnosed diabetes increased from 7.8% in 2004 to 13.1%in 2016.Figure 3. Age-adjusted, county-level prevalence of diagnosed diabetes among adults aged 20 years or older,United States, 2004, 2008, and 12.112.2–33.0Note: Data were unavailable for some US territories.Data sources: US Diabetes Surveillance System; Behavioral Risk Factor Surveillance System.Incidence of Diagnosed Diabetes (Newly Diagnosed Diabetes)Incidence Amon
National Diabetes Statistics Report, 2020. 2. RESULTS. Prevalence of Diabetes (Diagnosed and Undiagnosed) (See . Detailed Methods) Among the US population overall, crude estimates for 2018 were: