Transcription
WP/08/173Determinants of Foreign CurrencyBorrowing in the New Member Statesof the EUChristoph B. Rosenberg andMarcel Tirpák
1
2008 International Monetary FundWP/08/173IMF Working PaperEuropean DepartmentDeterminants of Foreign Currency Borrowing in the New Member States of the EUPrepared by Christoph B. Rosenberg and Marcel Tirpák1Authorized for distribution by Christoph B. RosenbergJuly 2008AbstractThis Working Paper should not be reported as representing the views of the IMF.The views expressed in this Working Paper are those of the author(s) and do not necessarily representthose of the IMF or IMF policy. Working Papers describe research in progress by the author(s) and arepublished to elicit comments and to further debate.The paper investigates the determinants of foreign currency borrowing by the private sectorin the new member states of the European Union. We find that striking differences in patternsof foreign currency borrowing between countries are explained by the loan-to-deposit ratios,openness, and the interest rate differential. Joining the EU appears to have played animportant role, by providing direct access to foreign funding, offering hedging opportunitiesthrough greater openness, lending credibility to exchange rate regimes, and raisingexpectations of imminent euro adoption. The empirical evidence suggests that regulatorypolicies to slow foreign currency borrowing have had only limited success.JEL Classification Numbers: E44, G21Keywords: Foreign currency borrowing, new EU member states, Central and Eastern EuropeAuthor’s E-Mail Address: crosenberg@imf.org , mtirpak@imf.org1The authors would like to thank Ajai Chopra, Peter Backé, Zoltan Walko, Gavin Gray, Sònia Muñoz, Bikas Joshi,Albert Jaeger, Gustavo Canavire, Andrzej Raczko, Cezary Wójcik, and participants at a research seminar at theNational Bank of Poland for their comments, and Agata Kariozen for excellent research assistance.
2ContentsPageI. Introduction . 3II. Stylized Facts . 4III. Reasons for Foreign Currency Borrowing—Some Hypotheses . 7IV. Empirical Estimation . 11A. Model Structure and Data . 11B. Estimation Results. 13V. Conclusions. 18VI. References. 19APPENDIX I. Data Sources and Transformations . 21APPENDIX II. Model Specification and Robustness Tests . 23
3I. INTRODUCTIONGrowing private sector borrowing in foreign currencies has become a familiar feature ofthe catching-up process in Central and Eastern Europe. This “dollarization”– in fact a“euroization” or “swissfrancization”– process2, which appears closely linked to the rapid growthof private sector credit, has drawn warnings from the IMF and other observers3 regardingborrowers’ vulnerability to sudden shifts in exchange rates. Some countries have takenregulatory measures to discourage foreign currency borrowing or have conducted monetarypolicy with an eye on the associated balance sheet risks.Meanwhile, a full understanding of what drives foreign currency borrowing and whatexplains striking differences between countries in the region is still elusive. While there isagreement that the convergence-related demand for capital, largely satisfied by foreign parentbanks, plays a key role, it is not fully clear how this interacts with a number of other factorssuch as individual countries’ monetary policy, the effect of EU and ERM2 membership andregulatory policies. Only very recently has there been research examining these issues in thenew member states of the EU (NMS).This paper examines the drivers of foreign currency borrowing during the run-up to euroadoption using a multivariate approach. Specifically, we expand recent work by Basso,Calvo-Gonzales and Jurgilas (2007) and Brzoza-Brzezina, Chmielewski and Niedźwiedzińska(2007) by using a new dataset and some additional policy-related variables. Note that the paperdoes not examine credit growth in the NMS per se – a phenomenon that has been widelyresearched in recent years4 – but rather the change of composition in private sector credit fromdomestic to foreign currency.The paper is organized as follows. Chapter II presents some stylized facts that highlightrecent trends and differences among countries. Chapter III goes through some of the commonlyoffered hypotheses for foreign currency borrowing in the region. Chapter IV presents regressionresults from a model that includes a variety of variables and draws on a set of panel data for theNMS. Chapter V offers some tentative conclusions.2Although somewhat of a misnomer, in line with the literature we use the term ‘dollarization’ to describedenomination or indexation of loans and deposits in currencies other than the domestic legal tender. In the region,the euro is the most commonly used foreign currency, but Swiss franc-denominated loans are also popular in somecountries (e.g., Hungary, Poland).34IMF (2007a), p. 90; IMF (2007b), p. 41; Bokor and Pellenyi (2005).See for example, Cottarelli, Dell’Ariccia and Vladkova-Hollar (2003); Kiss, Nagy and Vonnak (2006); Égert,Backé and Žumer (2006); Backé and Wójcik (2007).
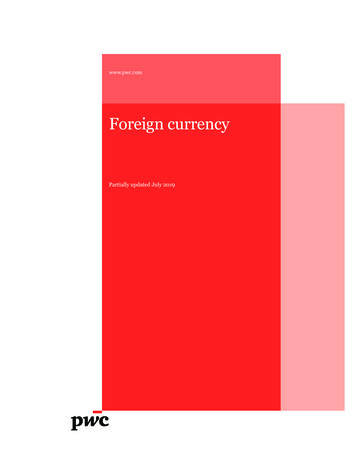
4II. STYLIZED FACTSRapid credit growth and a growing share of loans in foreign currency have become ahallmark of the convergence process in many NMS. In the region, the ratio of the privatesector’s credit from banks to GDP has increased steeply over the last decade, with the share ofloans denominated in or indexed to foreign currency increasing from 4 to 15 percent5 (Figure 1).This trend appears to have accelerated over the last few years. While familiar in other emergingmarket regions, notably Latin America, dollarization is particularly strong in the NMS,suggesting that it is related to their accession to the EU (Figure 2).Figure 1. NMS: Credit to the private sector (% of GDP)454045Local currencyForeign currencyFigure 2. Emerging Markets: Foreign exchange borrowing(2005, as % of total loans to the private sector)4035353030252520201515101055NMSRussia, Ukraine, and MoldovaLatin America0199719981999200020012002200320042005Note: The indicator is calculated as total credit to the private sector divided by GDP for the NMS (excl. Slovenia).All figures were previously transformed to euros.Source: national authorities, Eurostat, IMF staf calculations.200602007Western BalkansNote: Regional figures are calculated as medians forrespective countries in the region.Source: Tamirisa and others, 2007, pp. 30; national authorities,and IMF staff calculations.East Asia0510152025303540455055The dollarization process has been asymmetric between loans and deposits. While foreigncurrency borrowing expanded in many countries, foreign currency deposits remained broadlystable across the region6. In Figure 3 this can be seen by a shift of the gravity of financialdollarization away from the 45-degree line, indicating a growing exposure of private sector’sbalance sheets to currency risk. This trend is having potentially significant implications for thefinancial stability.56Legal restrictions on foreign currency borrowing were lifted in most countries in the mid-1990s.This may suggest that demand side factors are increasingly playing a role in foreign exchnage borrowing, a pointthat is further investigated in sections 3 and 4 below.
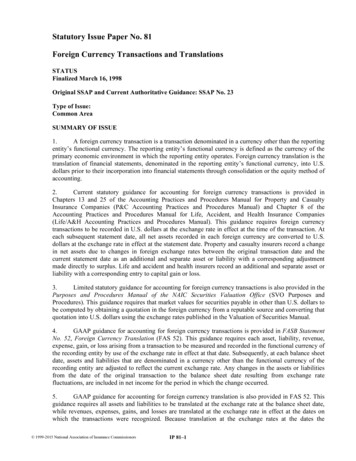
5Figure 3. Financial dollarization in the NMS*Year 1997Year 20071.01.0LVAHRV0.8EST0.6FX credits as of totalFX credits as of 0.0CZE0.00.0BGR0.4HUNCZE0.2ROUHUN0.20.40.60.81.0FX deposits as of total0.00.20.40.60.81.0FX deposits as of total*Country sample: Bulgaria (BGR), Croatia (HRV), the Czech Republic (CZE), Estonia (EST), Hungary (HUN),Latvia (LVA), Lithuania (LTU), Poland (POL), Romania (ROU), and Slovakia (SVK).Source: national authorities and IMF staff calculations.Foreign currency credit-to-GDPThere are striking differences between individual NMS. The composition of credit to theprivate sector is highly biased towards foreign currency in two Baltic countries--Estonia andLatvia (Group A in Figure 4)--while borrowers in Central Europe--the Czech Republic, Polandand Slovakia (Group B)-- prefer domestic currency.There is an intermediate groupFigure 4. Local currency vs foreign currency credit-to-GDP ratioof countries (Group C), where(in %, 2007)80.080.0the share of local currency andLatviaGroup AEstoniaforeign currency credits has70.070.0remained roughly equal.60.060.0Sometimes this phenomenon50.050.0is explained by nationalCroatia**characteristics (Czechs areSlovenia*40.040.0Group Csupposedly moreBulgariaLithuania30.030.0“conservative” thanHungaryRomaniaEstonians). The purpose of20.020.0Group Bthis paper is to investigatePoland*2006, **3q2007Slovakia10.010.0*2006,Source: National authoritiesand**3q2007IMFwhether underlying theseSource: national authorities andstaffIMF staffcalculations.Czech Republiccalculations0.00.0stereotypes are ves and countryLocal currency credit-to-GDPspecific characteristics.45'The dynamics and sectoral distribution of foreign-currency borrowing differ betweenNMS. In Figure 5, countries that saw an increase in the share of their foreign currencyborrowing since the beginning of this decade are located to the North-East of the origin. Thefigure also highlights differences in borrowing behavior between households and non-financialcorporations. If a country is positioned along the 45-degrees line, both sectors have increased
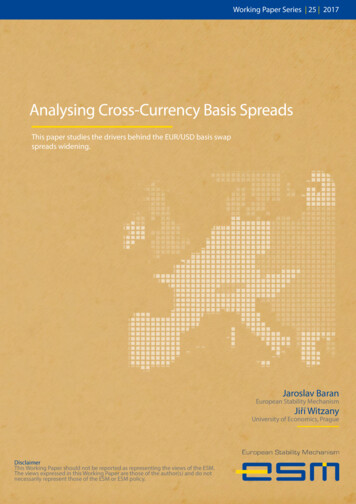
6their currency exposure at about the same rate. A location below the 45-degree line indicatesthat households have increased their currency exposure more than corporates. The dynamics offoreign exchange borrowing, as depicted in this figure, is affected by the initial share of foreigncurrency loans. Nevertheless, some country cases seem noteworthy. Households in Hungary increased the share of their foreign currency borrowing ( 50p.p.) more than in any other NMS, while non-financial corporations increased theirforeign currency exposure only modestly ( 10 p.p.). In Poland and Romania, on the other hand, households behaved opposite to nonfinancial corporations: they increased their share of loans denominated in foreigncurrency, while corporates slightly lowered their exposure. There are notable differences in borrowing behavior among the Baltic countries, a subregion that is often portrayed as homogenous. Latvia experienced strong growth inforeign currency borrowing, while in Estonia and Lithuania the increase was much less.In all three countries, however, households are more inclined to take on foreign currencyexposure than corporates. Conversely, Bulgaria and Slovakia are the only two countries where corporates are moreinclined to borrow in foreign currency than households. This may be related to theirlarge inflows of foreign direct investment over the last years. The Czech Republic is the only country where there has been no increase in foreigncurrency borrowing at all.Unfortunately, data limitations do not allow further examination of differences in borrowingbehavior between households and non-financial corporations. The remainder of the paper willtherefore focus on foreign currency borrowing by the private sector as a whole.Figure 5. Foreign exchange loans as a share of total loans by sector(change in ratio between 2000 and 2007, in p.p.)60.060.050.050.0non-financial Slovenia*SlovakiaHungary10.010.0Czech ce:Nationalauthoritiesand IMFstaffstaffcalculations.nationalauthoritiesand .060.0
7III. REASONS FOR FOREIGN CURRENCY BORROWING—SOME HYPOTHESESDollarization is not a new phenomenon. Borrowing in foreign currencies has been a commonfeature in many emerging market countries in Latin America and Asia. The “original sin”literature (Eichengreen and Hausmann, 1999), which developed following the financial crises ofthe late 1990s and originally focused on sovereign borrowing, attributed dollarization mostly tothe lack of monetary policy credibility. But borrowing in foreign currencies has also beenpopular in the private sector and in some industrial countries in Europe, such as Italy and theNordic countries in the early 1990s (Drees and Pazarbaşioğlu, 1998). The fact that dollarizationled to painful balance sheet effects following sudden exchange rate depreciation has contributedto the view that it constitutes a vulnerability.Overall credit growth and borrowing in foreign currencies are closely related. Duringtransition, consumption smoothing is an important channel for credit expansion (Backé andWójcik, 2007). Figure 6 illustrates that foreign currency borrowing has contributed to much ofthe overall credit growth, especially in countries where the private sector’s indebtednessincreased very rapidly in recent years.Figure 6. Contribution to real credit growth (percent)1998-20022002-2007600600Local currency contributionForeign currency contribution500500Real credit growth to the private tions.calculations.Source:One reason for this may be that access to foreign currency loans, usually at lower rates than fordomestic currency loans, not only affects the choice of currencies but also real interest rate asperceived by borrowers. When making a decision to borrow, they will often use expecteddomestic inflation or wage growth to deflate the nominal foreign currency interest rate,especially if they consider exchange rate risk to be low. As Figure 7 shows7, this can yieldhighly negative real interest rates, thus greatly increasing the overall demand for credit. Sincethis paper is concerned with the currency composition of borrowing rather than overall creditgrowth, we will not pursue this linkage further.7Expected inflation and wage growth is proxied by actual inflation and wage growth.
84.0Figure 7. Eurozone nominal interest rate (3M money market rate)deflated by domestic inflation and wage growth (in %, Source: Bloomberg, Eurostat, and IMF staff est rate differentials between local and foreign currency are believed to drive thechoice between borrowing in domestic versus. foreign currency. Several recent empiricalstudies examining foreign currency borrowing in the NMS (Basso, Calvo-Gonzales andJurgilas, 2007; Brown, Ongena and Yeşin, 2008) assume that uncovered interest rate parity doesnot necessarily hold and use nominal interest rate differences to explain dollarization. Figure 8may at first glance seem counter-intuitive as it suggests that this difference is particularly largein countries where foreign-exchange borrowing has not been particularly high, such as Poland.Note, however that the significance of interest rate differentials depends on the credibility of theunderlying currency regime and expectations regarding exchange rate movements and inflationdifferentials. In a country withFigure 8. Interest rate* differential vis-à-vis euroa highly credible peg, only a(in p.p., nominal interest rates, average 4q1998 - 4q2007)small interest rate differential8.08.0can induce a shift in lendingFlexible ERRigid ER7.07.0patterns, while in a flexibleexchange rate regime a larger6.06.0differential may be necessary5.05.0to induce a similar shift. The4.04.0rationale behind this is3.03.0developed by Jeanne (2003),who built a theoretical model2.02.0describing the determinants of1.01.0liability dollarization from the0.00.0perspective of borrowers.BGLTEELVCRCZSKPLHU* 3-month money market rate, quarterly data. Data for BG, CR, LT, and SK are of shorter time span.Source: Bloomberg and IMF staff calculations.At first glance, a country’s currency regime appears to play a role as well. Backé andWójcik (2007) suggest that perceived exchange rate risk is smaller in countries with exchangerate pegs, especially currency board regimes. This hypothesis seems to be confirmed by Figure4 above: borrowers in countries with de facto rigid exchange rate regimes (Group A) are more
9willing to take foreign exchange risk than those with flexible exchange rate regimes (Group B).But the figure also highlights that the explanation cannot lie in the currency regime alone, asboth Lithuania and Bulgaria have operated currency boards for many years, but have a muchlower share of credit denominated in foreign currency. Moreover, a blunt classification intopegged and non-pegged exchange rate regimes is not warranted because in several cases (Latviain 2005, Lithuania in 2002) the anchor currency was changed and in some other countries(Croatia, Hungary, Romania, and Slovenia) the exchange rate has been a de facto considerationin monetary policy making. When determining whether borrowers assess currency risk based onthe expected stability of the exchange rate it would therefore seem useful to look at its actualpast variability.Group AGroup CGroup BThe availability of foreign funds that are fueling the credit expansion in NMS may alsoinfluence the currency composition of credit. AsTable 1. Asset share of foreign-owned banks (in %)credit expands beyond the level of domestically20002006available resources, banks attract capital fromEstonia97.499.1abroad. This is often done through existingSlovakia42.797.0Lithuania54.791.8financial links to parent banks residing in the EU.Croatia84.190.8Since domestic bank regulations often restrictRomania46.787.9open currency positions, banks pass foreignCzech Republic65.484.7funded loans to their customers in foreignHungary67.482.9currency. This also allows them to transferBulgaria75.380.1Poland72.674.3currency risk directly to borrowers (however, theyLatvia74.462.9still bear the credit risk). Apart from Slovenia,Slovenia15.329.5foreign-owned banks clearly dominate domesticSource: EBRD.banking sector in NMS and their presence hasstrengthened further during thelast decade (Table 1, above).Figure 9. Loan-to-deposit ratio in the NMSFigure 9 shows that countriesCZ20002007experiencing a strong increaseSKin loan-to-deposit ratio, drivenPLby credit expansion (e.g., theBGBaltics), are also thoseborrowing in a foreignROcurrency (from Figure 4HUabove). Basso, Calvo-GonzalesCRand Jurgilas (2007) develop aLTtheoretical and empirical modelEEthat shows how the presence ofLVforeign banks in the NMS0.000.501.001.502.002.50increases liability dollarization.Source: national authorities and IMF staff calculations.Source: National authorities and IMF staff calculations.Imminent euro adoption is expected to be a factor in financial dollarization, as for examplesuggested by Levy Yeyati (2006). One would expect borrowers to increase their borrowing in(cheaper) foreign currencies, if they think that currency risk will soon disappear. Foreignexchange borrowing did initially accelerate in the Baltics when they entered ERM2—the
10“antechamber to the euro”—soon after joining the EUEstoniaLatviaLithuaniaSlovakia (rhs)(Figure 10). In Slovenia the0.850.60share of foreign currency loans0.550.80to the private sector rapidly0.500.75expanded during its successful0.450.70run-up to the eurozone and a0.40similar trend was observed0.650.35earlier in Austria – although0.600.30this may have also been related0.550.25to the liberalization of rules0.500.20regarding foreign currency* as*asof oftotalloans, banksNote: Shaded area refers to the time of entry to the ERM 2 by the respective country. Time unit is one quarter.0.45borrowing at the time (Figure0.15Note:Shaded area refers to the time of entry to the ERM 2 by the respective country. Time unit is one quarter.Source: National authorities and IMF staff calculations.Source: national authorities and IMF staff calculations.11). In Slovakia, on the other0.100.40t-8t-7t-6t-5t-4t-3t-2t-1tt 1t 2t 3t 4t 5t 6t 7t 8hand, imminent euro adoptionappears to have had no effecton foreign currency borrowing. While the evidence is therefore mixed, events like EUmembership and ERM 2 participation are usually thought to have some positive influence onthe dollarization of credits in the NMS.Figure 10. NMS: Share of foreign exchange loans* and ERM 2 entryFigure 11. Share of the foreign exchange loansin the run-up to euro adoption (in %)1670AustriaSlovenia (RHS)1460125010408306204210Note: t quarter of euro adoptionSource: National authorities, IMF staff -3t-2t-1Finally, a country’s economic policies surely have a bearing on foreign currencyborrowing. The most obvious channel is through monetary policy which will directly affect theinterest rate differential discussed above, as well as the volatility of the exchange rate. Taxesand subsidies can also influence borrowing behavior; for example, the tightening of eligibilitycriteria for housing subsidies in Hungary in 2004 is believed to have induced consumers toswitch to cheap foreign currency loans (Bokor and Pellenyi, 2005). Conversely, recognizingrisks associated with foreign currency loans, financial supervisors throughout the region haverecently taken various regulatory measures to slow down such borrowing (Table 2). Aninteresting question, examined below, is whether these actions have had the intended effect.
11Table 2. Policies to discourage foreign currency borrowing2004Q4CZMonitor fx riskEEHUXLVLTPLSKSIBGROCRXDisclose fx risks to customersTighten eligibility criteria for fx borrowingHigher risk weights, provisioning, reserverequirements depending on banks' fx exposureXCeiling on banks' fx exposure2007Q4CZMonitor fx riskXDisclose fx risks to customersEEHULVXXXLTPLSKSIBGROCRXXXXXTighten eligibility criteria for fx borrowingXHigher risk weights, provisioning, reserverequirements depending on banks' fx exposureXXCeiling on banks' fx exposureSource: IMF staff reports.IV. EMPIRICAL ESTIMATIONA. Model Structure and DataThe various hypotheses laid out above can be examined in a panel regression model (eq. 1).For the dependent variable we use the share of loans denominated in (and indexed to) foreigncurrency in total domestic bank loans to the non-financial private sector. An alternativespecification of the dependent variable also includes the private sector’s direct borrowing fromabroad, all of which is assumed to be in foreign currency.8 Our preferred model contains thefollowing key independent variables:8 the difference of nominal interest rates between local and foreign currency; the loan-to-deposit ratio to capture the degree to which funding for the non-financialprivate sector comes from abroad; the openness of the economy, andThese loans are often granted to subsidiaries of foreign corporates operating in the NMS from banks that alsoprovide financial services to their parent companies in the home country.
12 the severity of regulatory measures aimed at discouraging foreign currency borrowing.Consequently, the model can be written as follows:fxloansi ,t α β1irdiff i ,t β 2 loantodepi ,t β 3opennessi ,t β 4 restricti ,t X i ,t ε i ,t (1),with the first four independent variables as described above and a vector Xi,t, consisting of anumber of additional variables that were also tested but not included in the our preferred model(e.g., GDP per capita, asset share of foreign banks, size of the economy, EBRD index ofbanking sector reform, actual exchange rate volatility, and dummies for ERM2 and EUmembership). The exact specification and empirical validity of all variables is discussed below.The regression draws on quarterly data for the NMS. The sample of countries includes thenew EU member states from Central and Eastern Europe that have not yet adopted the euro-the Czech Republic, Estonia, Hungary, Latvia, Lithuania, Poland, and Slovakia (which joinedthe EU in May 2004)9, Bulgaria and Romania (which joined in January 2007), as well as Croatia(EU candidate since 2004)10. We considered including a few non-NMS countries for which datawere available (Portugal, Austria, Sweden, Denmark), but in the end decided to not pursue thesebecause conditions in their preparatory phase for euro adoption were in important respectsdifferent from the NMS11. Hence, the panel includes 10 countries and quarterly data for theperiod 1999-2007. Data for loans and deposits in domestic and foreign currencies were derivedfrom national sources, while most other data used for the independent variables were collectedfrom Eurostat, IMF, EBRD and BIS databases. The index of policies to influence foreignexchange borrowing was constructed using information from IMF staff reports and aquestionnaire among country desks. Data sources and transformations are described inAppendix I.The preferred model specification is estimated by OLS with country fixed effects andappears robust. The relatively high correlation between our dependent variable and the loanto-deposit ratio suggested possible endogeneity problems, so we ran our baseline model withlagged loan-to-deposit ratio variables (up to 3 lags of the variable). In order to test for therobustness of the model, we included time dummies and also restricted our sample excludingoutliers (Estonia, Latvia). In the latter specification the openness variable turned non9Slovenia was excluded because the available time series of data were much shorter than in the other countries.Data for Macedonia, another EU candidate country, were not compatible with those used for the other countries.10Croatia represents an outlier, with much higher initial level of liability dollarization level than in the othercountries.11For example, in the old member states many restrictions on foreign currency borrowing were eliminated duringthe run-up to euro adoption, while many new member states had already abolished such restrictions by the end1990s, prior to their entry to the European Union.
13significant, otherwise the results were unaffected. Alternative specifications and robustness testare discussed in Appendix II.B. Estimation ResultsAs expected, the interest rate differential is an important driver of foreign currencyborrowing. This variable12 has the expected positive sign and is highly significant (Table 3,column A). In line with both the theoretical and the empirical literature, a higher interest ratedifferential leads to higher dollarization of liabilities in a country.Table 3. Estimated coefficients from our preferred modelDomestic banks onlyIncl. cross-border loansInterest rate differentialA0.00113***B0.00179***Loan-to-deposit *-0.01377**OpennessFX restriction index (lagged)Note:**; ***refersreferssignificanceat 10%,5%,andrespectively.1% level respectively.Note:*;*;**;***to tosignificanceat 10%,5%, 1%levelFor a discussionon modelthe modelspecification,isseeII. Timeare included.Discussionon thespecificationin Appendixthe AppendixII. dummiesTime dummiesare included.Source: Authors’ calculations.Source: Authors' calculations.The correlation can be nicely traced in Lithuania (Figure 12), where the share of foreigncurrency denominated new mortgages declined in 2005-06, when the interest rate differentialshrank from some 150 basisFigure 12. Lithuania: Share of foreign currency loans (in EUR)points to around zero; but theon housing loans and interest rate differentialprocess reversed when the100New housing loans, in% (LHS)difference subsequently increasedTotal housing loans, in % (LHS)Interest rate spread over EUR loans, in p.p. (RHS)again. In our model, an increase80of the interest rate differential by100 basis points would increase60the share of foreign exchangeloans by some 0.1-0.2 percentage40points. This effect may appearsmall compared to the exampleshown in Figure 12. Recall,20however, that our dependent2.01.51.00.50.0-0.5Source: Bank of Lithuania and IMF staff calculations.120Oct-04 Jan-05 Apr-05-1.0Jul-05Oct-05 Jan-06 Apr-06Jul-06Oct-06 Jan-07 Apr-07 Jul-07Oct-07 Jan-08Because of data limitations, we use the 3-month money market rate differential of local currency vis-à-vis theeuro (i - i*). While this ignores the fact that in some countries foreign currency loans are often denominated inSwiss franc, these interest rates are highly correlated with Euro interest rates (factor 0.96). Using thisapproximation also implies that risk premium and fees for the median borrower in a country are constant in onepoint in time for both local currency loans and foreign currency loans. Anecdotal evidence confirms that, at leastuntil recently, banks did not include the currency risk in their calculations.
14variable is defined as a stock variable covering all private sector loans.The loan-to-deposit ratio is also highly significant and has the expected sign. (Table 3,column A). This suggests that as countries during convergence draw on capital inflows to funddomestic borrowing for consumption smoothing purposes, they tend to rely relatively more onforeign currency loans. Unli
The paper investigates the determinants of foreign currency borrowing by the private sector in the new member states of the European Union. We find that striking differences in patterns of foreign currency borrowing between countries are explained by the loan-to-deposit ratios, openness, and the interest rate differential.