Transcription
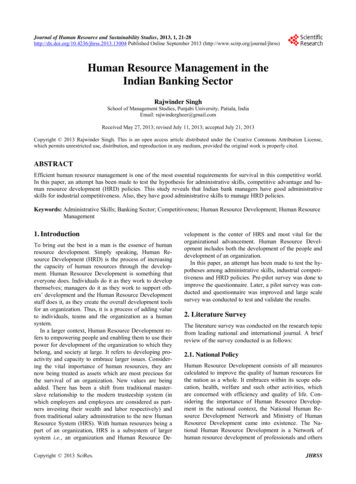
ECONOMICS UPDATEThe Government SectorDpocket. The plan is expected to cost the federal government at least 30.5 billion in 2006.States Gain Temporary Relief After several yearsof budget deficits, 42 states will end FY2006 with budget surpluses as a result of increased revenues fromtaxes on energy, sales, personal income, and corporateincome. Many states have also boosted revenuesthrough a variety of new measures, including lotteriesand increased cigarette taxes. Some states with budgetsurpluses plan to spend the extra money on education,transportation, pensions, and other projects. Others intend to cut taxes or establish “rainy-day funds” toguard against future shortfalls.These funds may be needed within the next several years, when increases in state spending for programs such as education, corrections, and especiallyMedicaid—which is now the single largest item instate budgets—are projected to outpace increases inrevenue. If spending and collections increase at current rates, 10 states will run deficits in FY2007, and 19will be over budget by FY2008. Moreover, cuts in federal funding could cost states as much as 11 billionover the next five years. The states of the Gulf Coastregion, in particular, face a possible budget squeezeresulting from the costs of rebuilding and the loss oftax revenues.eficit Drops Somewhat In fiscal year 2005(FY2005, October 2004–September 2005), thefederal budget deficit fell from 413 billion to 318billion. Most of this drop came from an increase intax revenues, especially from businesses. The deficitfor FY2006 is expected to fall further to about 282 billion, down from the original forecast of 423billion, on continued strength in tax revenues.However, this will be offset by increased expensesas the government funds the new Medicare drugbenefit, pays for military operations in Afghanistanand Iraq, and rebuilds the Gulf Coast after last year’shurricanes.If economic growth continues, the deficit may fallagain in FY2007. However, rising energy costs and acooling housing market could slow growth and reduce tax revenues. A series of tax cuts passed byCongress in 2005 will further reduce revenues. Overthe course of the next five years, the cuts are expectedto decrease tax receipts by more than 94 billion.Medicare Drug Plan Takes Effect By May 2006,37 million of the 42 million eligible seniors signed upfor the new Medicare prescription drug benefit. Severalproblems arose as the program began. Many seniorswere confused by the wide array of plans available.Moreover, a computer glitch initially kept many beneficiaries from receiving the coverage they were entitledto, and many pharmacies were not being reimbursedfully or promptly for the drugs they dispensed toMedicare patients. Some seniors expressed concernabout the gap in coverage for all expenses between 2,250 and 5,100, which they must now pay out ofThink About It1. How is the economic growth of the past yearrelated to the drop in the federal budget deficit?2. How could current state budget surpluses turninto budget deficits?Federal Government Outlays, 1995Other 22%Education,Training,Employment,and SocialServices 4%Health 8%Medicare 11%Social Security22%Federal Government Outlays, 2005Other 19%Education,Training,Employment,and SocialServices 4%National Defense18%Income Security15%Total Outlays 1,515.9 billionSource: U.S. Office of Management and Budget, Historical Tables, annual6 ECONOMICS UPDATEHealth 10%Medicare 12%Social Security21%National Defense20%Income Security14%Total Outlays 2,472.2 billionCopyright by The McGraw-Hill Companies, Inc.13. Changing Budget Priorities, 1995 and 2005
14. National Defense Spending,1975–2005 (in billions of dollars)15. Federal Social and IncomeSecurity Spending, 1980–200560 37550 30040 22530 1502010 75 01975Billions 450198019851990Year1995200002005 90090 85085 80080 75075 70070 65065 60060 55055 50050 45045 40040 35035 30030 25025 20020 1501519802000200517. Federal Medicare and HealthSpending, 1980–2005(in billions of dollars)(in billions of dollars)80 560Billions40 2802003Annual PaymentsNumber of BeneficiariesSource: Statistical Abstract of the United States: 2006302004 60055 55050 50045 45040 40035 35030 30025 25020 20015 15010 1005 50’80Percentage of Federal Budget50 350Millions of People60 420Billions70 490Copyright by The McGraw-Hill Companies, Inc.1995Source: U.S. Office of Management and Budget, Historical Tables, annual16. Social Security Beneficiaries andAnnual Payments, 1999–20042001 2002Year1990Federal Social and Income Security SpendingSpending as Percentage of BudgetSource: U.S. Office of Management and Budget,Historical Tables, annual20001985YearNational Defense SpendingSpending as Percentage of Budget 2101999Percentage of Federal Budget70Percentage of Federal BudgetBillions(in billions of dollars) 5250’85’90’95’00’05YearFederal Medicare and Health SpendingSpending as Percentage of BudgetSource: U.S. Office of Management and Budget,Historical Tables, annualECONOMICS UPDATE 7
19. National Health Expenditures,1970–2003 (in billions of dollars)18. Benefits to People with LimitedIncome, 200341,100 277,800Food Stamps21,300 21,400TemporaryAssistancefor NeedyFamilies (TANF)4,900SupplementalSecurityIncome6,900School LunchProgram 26,300 1,92555 1,75050 1,57545 1,40040 1,22535 1,05030 87525 70020 52515 35010 1755 34,70028,400 0’70 6,300’75’80’85’90Year’95Percentage of GDPMedicaidBillionsRecipients(in thousands)TotalExpenditures(in millions ofdollars)0’00 ’03National Health ExpendituresPercentage of GDPSource: Statistical Abstract of the United States: 2006Source: Statistical Abstract of the United States: 200621. Federal Budget Revenues,Expenditures, and Deficit,1980–2005 (in billions of dollars)20. Medicare Enrollees andExpenditures, 1996–2004 32555 30050 27545 25040 22535 20030 17525 15020 12515 10010 50’965’97’98’99’00 ’01Year’02’03Medicare ExpendituresMedicare EnrolleesSource: Statistical Abstract of the United States: 20068 ECONOMICS UPDATE0’04 2,200AnnualSurplus 2,000Billions 1,800 1,600Copyright by The McGraw-Hill Companies, Inc. 75 2,400Millions of PeopleBillions 2,600AnnualDeficitExpenditures 1,400 1,200 1,000Revenues 800 600 400’80’85’90’95Year’00’05Source: Dept. of Commerce, Bureau of Economic Analysis
22. Net Interest as a Share of Federal Outlays, 1970–20051968–98 (in 51990Fiscal Year199520052000Source: U.S. Office of Management and Budget, Historical Tables, annual23. Total Gross Federal Debt,1995–2006 (in trillions of dollars)24. Gross Federal Debt asPercentage of GDP, 1988–200680 970Percentage of GDP 7TrillionsCopyright by The McGraw-Hill Companies, Inc. 8 66050 540 4’95 ’96 ’97 ’98 ’99 ’00 ’01 ’02 ’03 ’04 ’05 ’06YearNote: 2006 figure is estimated.Source: U.S. Office of Management and Budget,Historical Tables, �04 ’06YearNote: 2006 figure is estimated.Source: U.S. Office of Management and Budget,Historical Tables, annualECONOMICS UPDATE 9
25. Federal Government Revenue,2005 (in billions of dollars)Total: 2,153.826. Federal Government Expenditures,2005 (in billions of dollars)Total: 2,472.2Social Security 523.3Individual IncomeTaxes 927.2National Defense 495.3Income Security 345.8Social Insurance andRetirement Receipts 794.1Medicare 298.6Health 250.6Net Interest 184.0Education, Training,Employment, andSocial Services 97.5Excise Taxes 73.1Veterans’ Benefitsand Services 70.2Transportation 67.9Other 81.1Other 141.8Source: U.S. Office of Management and Budget, Historical Tables, annual10 ECONOMICS UPDATENote: Individual figures do not add up to total due to rounding.Source: U.S. Office of Management and Budget, Historical Tables, annualCopyright by The McGraw-Hill Companies, Inc.Corporate IncomeTaxes 278.3
27. State Government Receipts, 2002 (in billions of dollars)IntergovernmentalRevenue 335.4Sales andGross Receipts 262.427.8%21.8%InsuranceTrust 19.3IndividualIncome Taxes 185.7Other 362.530.0%1.6%15.4%2.1%1.3%CorporateIncome Taxes 25.1Total Borrowing andRevenue: 1,206.0 billionLicenses(Motor Vehicle) 15.6Source: Statistical Abstract of the United States: 2006Note: Not to scale28. State Government Expenditures, 2002 (in billions of dollars)Education 389.4CorrectionalFacilities 38.96.6%21.5%Copyright by The McGraw-Hill Companies, Inc.29.2%Health andHospitals 87.7Public Welfare 287.0Other 355.826.7%2.9%6.9%Total Expenditure and DebtRedemption: 1,335.0 billionSource: Statistical Abstract of the United States: 2006EmployeeRetirement 92.06.3%Highways 84.2Note: Not to scale; individualpercentages do not add upto 100% due to rounding.ECONOMICS UPDATE 11
29. State and Local Government Revenues, 2002 (in millions of dollars)N.H.WASH.MONTANAN. DAK.MAINEVT.MINN.OREGONMASS.IDAHOWIS.S. DAK.N.Y Z.N. .S.C.ARK.ALA.TEXASPA.R.I.CONN.N.J.GA.MISS.KEY:LA. 10,000FLA. 10,000– 19,999ALASKA 20,000– 49,999 50,000– 74,999 75,000– 100,000HAWAII 100,000Source: Statistical Abstract of the United States: 200630. Federal Aid to State and Local Governments, 1980–2005Program19801990200020042005, est.Grant-in-Aid Shared ,75843,890124,843189,883203,253Income Security18,49535,18963,20085,98389,317Education, Employment, Training, Social on13,02219,17432,22241,47143,870Community and Regional Development6,4864,9658,66512,60414,941Natural Resources and 8932412N.A.N.A.EnergyNational DefenseSource: Statistical Abstract of the United States: 200612 ECONOMICS UPDATE*Includes items not shown separatelyN.A. Not AvailableCopyright by The McGraw-Hill Companies, Inc.(in millions of dollars)
Health 8% Health 10% Other 19% Education, Training, Employment, and Social Services 4% D eficit Drops SomewhatIn fiscal year 2005 (FY2005, October 2004–September 2005), the federal budget deficit fell from 413 billion to 318 billion. Most of this drop came from an increase in tax revenues, especially from businesses. The deficit for FY2006 is expected to fall further to about 282 billion .