Transcription
Supply Chain Management: Logistics NetworkDesignDonglei Du(ddu@unb.edu)Faculty of Business Administration, University of New Brunswick, NB Canada FrederictonE3B 9Y2Donglei Du (UNB)SCM1 / 67
Table of contents I1IntroductionThe Logistics NetworkMajor Steps in Network Design2A Facility Location Problem3Optimial Distribution and outsourcing4Maximum flow problem5Network synthesis problemOffline versionOnline versionDonglei Du (UNB)SCM2 / 67
Section 1IntroductionDonglei Du (UNB)SCM3 / 67
Subsection 1The Logistics NetworkDonglei Du (UNB)SCM4 / 67
The Logistics Network IThe objective of this chapter is to present some issues involvedin the design and configuration of the logistics network.Obviously these are strategic decisions because they have along-standing effect on the firm.The Logistics Network consists of:Facilities:Plants/Vendors PortsWarehouseRetailers/Distribution CentersCustomersRaw materials and finished products that flow between thefacilities.Donglei Du (UNB)SCM5 / 67
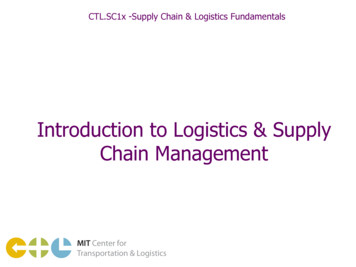
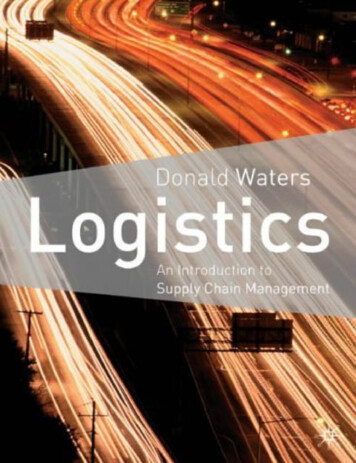
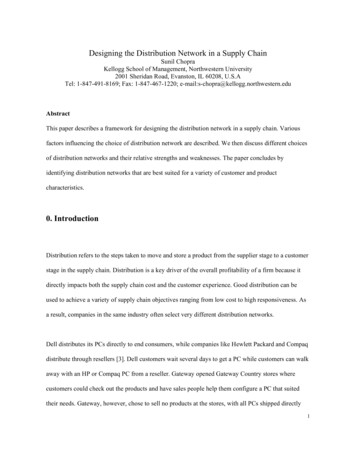
The Logistics Network IITypical Logistics ConfigurationplantsProduction/purchasecostsDonglei Du tInventory tomersInventory &warehousingcosts6 / 67
Key Strategic Decisions in the Logistics Network IAssuming that plants and retailer locations are fixed, weconcentrate on the following strategic decisions in terms ofwarehouses.Pick the optimal number, location, and size of warehousesDetermine optimal sourcing strategyWhich plant/vendor should produce which productDetermine best distribution channelsWhich warehouses should service which retailersThe objective is to design or reconfigure the logistics network soas to minimize annual system-wide costs, includingProduction/ purchasing costsInventory carrying costs, and facility costs (handling and fixedcosts)Transportation costsDonglei Du (UNB)SCM7 / 67
Key Strategic Decisions in the Logistics Network IIThat is, we would like to find a minimal-annual-costconfiguration of the distribution network that satisfies productdemands at specified customer service levels.Donglei Du (UNB)SCM8 / 67
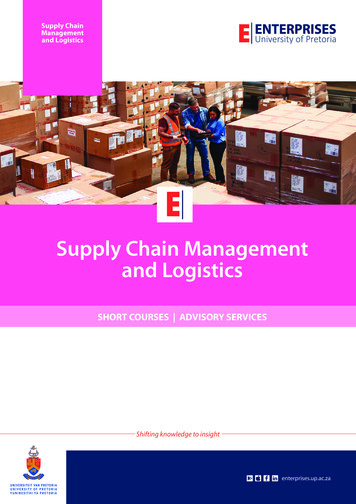
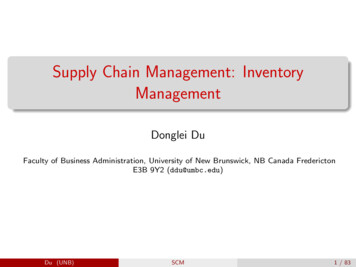
The trade-off in this problem IIncreasing the number of warehouses yieldsAn improvement in service level due to the reduction in averagetravel time to the customers.An increase in inventory costs due to increased safety stocksrequired to protect each warehouse against uncertainties incustomer demands.An increase in overhead and setup costsA reduction in outbound transportation costs: transportationcosts from the warehouse to the customers.An increase in inbound transportation costs: transportationcosts from the suppliers and/or manufacturers to the warehouse.In essence, the firm must balance the costs of opening newwarehouses with the advantages of being close to the customer.Donglei Du (UNB)SCM9 / 67
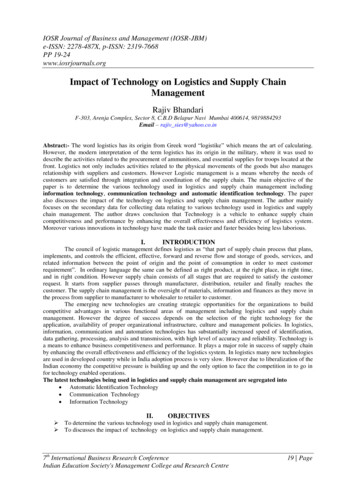
The trade-off in this problem IIThus warehouse location decisions are crucial determinants ofwhether the supply chain is an efficient channel for thedistribution of products.OptimalNumberof Warehouses 90Cost (millions ) 80 70 60Total CostTransportation CostFixed CostInventory Cost 50 40 30 20 10 -0246810Number of WarehousesDonglei Du (UNB)SCM10 / 67
Subsection 2Major Steps in Network DesignDonglei Du (UNB)SCM11 / 67
Major Steps in Network DesignStepStepStepStep1.2.3.4.Data CollectionData AggregationData Validation and ModelOptimizationDonglei Du (UNB)SCM12 / 67
Step 1. Data Collection IA typical network configuration problem involves large amount ofdata, including information on1Location of customers, stocking points and sources—locationtheory2A listing of all products3Demand for each product by customer location–forecasttechnique4Transportation rates by mode—information system, like ratingengine5Mileage estimation—GIS6Warehousing costs (handling and fixed)—inventory management7Service level requirement—probabilistic technique8Shipment sizes by productDonglei Du (UNB)SCM13 / 67
Step 1. Data Collection II9Order patterns by frequency, size, season, content10Order processing costs11Customer service goalsDonglei Du (UNB)SCM14 / 67
Transportation Cost ITransportation costs Transportation rate Distance1. Transportation rate: the cost per mile per SKU. An importantcharacteristic of a class of rates for truck, rail, UPS andother trucking companies is that the rates are quitelinear with the distance but not with volume. Usuallythere are two kinds of transportation rates:Internal fleet (company-owned): It can be easilycalculated from information like annual costs pertruck, annual mileage per truck, annual amountdelivered, and truck’s effective capacity.Donglei Du (UNB)SCM15 / 67
Transportation Cost IIExternal fleet (third-part): More complexcalculation is needed: There are rating enginesavailable, such as the SMC3RateWare—www.smc3.com.2. Mileage estimation: Once we know the transportation rates, whichusually depends on the distance, we need to estimatethe mileage between any two locations. Depending onyour situation, you may wantExact estimation: this usually can be obtainedusing GIS system, but the drawback is cost andspeed—you may need to install GIS receiver andslow down the operation of a Decision-SupportSystem (See Chapter 12 for more information)Donglei Du (UNB)SCM16 / 67
Transportation Cost IIIApproximate estimation: For most of theapplications, this will be sufficient.Donglei Du (UNB)SCM17 / 67
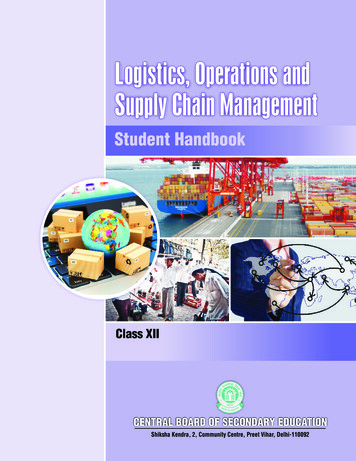
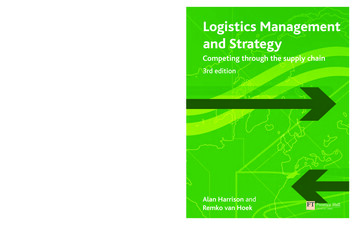
Warehousing costs (handling, and fixed costs) IHandling cost: proportional to the amount of material the flowsthrough the warehouseFixed Cost: All costs that are not proportional to the amount ofmaterial the flows through the warehouse. It is typicallyproportional to warehouse space size (or warehouse capacity)but in a nonlinear ,000100,000WarehousecapacityDonglei Du (UNB)SCM18 / 67
Warehousing costs (handling, and fixed costs) II12So we need to estimate warehouse capacity. Obviously thecapacity is proportional to the peak inventory, not the averageinventory or annual flow.We introduce the concept of inventory turnover ratio, given byinventory turnover ratio 3annual flowaverage inventory levelThe warehouse capacity is given byWarehouse Capacity 3 (2 average inventory level)annual flow 6 inventory turnover ratioDonglei Du (UNB)SCM19 / 67
Step 2. Data AggregationAggregate and clean the data because123456the data collected in Step 1 is usually overwhelming,the cost of obtaining and processing the real data is huge,the form in which data is available must be streamlined,the size of the resulting location model is huge, andthe accuracy of forecast demand is improved.Of course, data aggregation only approximates the real data, sothe impact on model’s effectiveness must be addressed.Donglei Du (UNB)SCM20 / 67
The impact of aggregate demand:pσ1 σ2 σ12 σ22 IConsider the following example with two customers: Please do ityourself in class.Given historical demands for customers 1 and 2 in the followingtable:YearCustomer 1Customer 2Total 2Donglei Du 8621997218971465336550199819854249874484121 / 67
The impact of aggregate demand:pσ1 σ2 σ12 σ22 IIHere is the summary of the historical data, we can see theaverage demand for the aggregated customer is the sum of thetwo averages. However, the variability, measured by standarddeviation and coefficient of variation is smaller.StatisticsCustomer 1Customer 2Total 2Donglei Du (UNB)Average242372090545142standard deviation468534276757SCMcoefficient of variation0.1920.1730.15022 / 67
A heuristic to aggregate data ICustomer-based Clustering: Customers located in closeproximity are aggregated using a grid network or clusteringtechniques. All customers within a single cell or a single clusterare replaced by a single customer located at the centroid of thecell or cluster. We refer to a cell or a cluster as a customer zone.Product type-based clustering: Place all SKU’s into asource-group. A source group is a group of SKU’s all sourcedfrom the same place(s). Within each of the source-groups,aggregate the SKU’s by similar logistics characteristics (Weight,Volume, Holding Cost).A rule of thumb for aggregate customers and product types isgive byAggregate 150-200 customers or 20-50 product types points foreach zone.Donglei Du (UNB)SCM23 / 67
A heuristic to aggregate data IIMake sure each zone has an approximate equal amount of totaldemandPlace the aggregated point at the center of the zone.In this case, the error is typically no more than 1%Donglei Du (UNB)SCM24 / 67
Step 3. Data Validation and ModelOnce the data are collected and cleaned, we need to ensure thatthe data and model accurately reflect the network designproblem.This is typically done by reconstructing the existing networkconfiguration using the model and collected data, and comparingthe output of the model to existing data. The purpose is toanswer the following questions:Does the model make sense?Are the data consistent?Can the model results be fully explained?Did you perform sensitivity analysis?Donglei Du (UNB)SCM25 / 67
Step 4. OptimizationOnce the data are collected, cleaned, and verified, the next stepis to optimize the configuration of the logistics networks. Inpractice, two techniques are employed:Mathematical optimization techniques, includingExact algorithms: find optimal solutionsHeuristics: find ”good” solutions, not necessarily optimalSimulation models that provide a mechanism to evaluatespecified design alternatives created by the designer.Donglei Du (UNB)SCM26 / 67
Section 2A Facility Location ProblemDonglei Du (UNB)SCM27 / 67
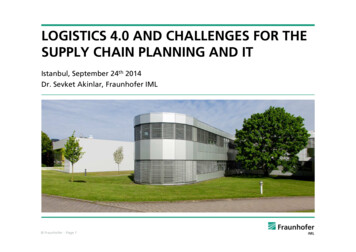
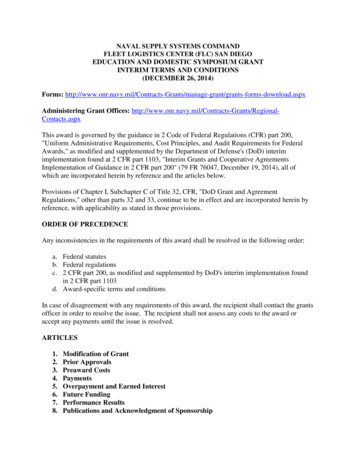
A Facility Location Problem ILet J {1, 2, 3} be a set of three potential sites for establishingnew warehouses and I {1, 2, 3, 4} be a set of four clients(distribution centers or retailers). There is an open cost fj forestablishing a warehouse at site j J. There is a transportationcost cij of warehouse j serving client i. These data aresummarized in the following graph.warehousesclientscij connection cost12I34Donglei Du (UNB)f1 37521040022 f 2 10 JSCM3f3 6f j open cost28 / 67
A Facility Location Problem IIAssume we assign clients according to the closest-site rule, i.e.,assign a client to the open warehouse which has the minimalconnection cost. The objective is to decidethe number of warehouses that should be established and theirlocations, so as to minimize the total cost, including connectionand open costs.Donglei Du (UNB)SCM29 / 67
Solution—Enumeration approach IThere are 23 1 different combinations for open and closedwarehouses (excluding the case where no warehouse isestablished at all).Open warehouses1231,21,32,31,2,3Donglei Du (UNB)Open cost31063 103 610 63 10 6SCMConnection cost 11955Total cost 2418212430 / 67
Solution—Enumeration approach IIThe optimal solution is given in the following graph.171f1 33f3 6203402Total cost (3 6) (7 0 0 2) 18Donglei Du (UNB)SCM31 / 67
Three steps in formulating (Integer) LinearProgramStep 1. Define the decision variablesStep 2. Write the objective in terms of theses decision variablesStep 3. Write the constraints in terms of theses decisionvariablesDonglei Du (UNB)SCM32 / 67
Solution—Integer Linear Programming approach IDefine variable for i 1, 2, 3, 4, j 1, 2, 3. 1, If warehouse j serves client ixij 0, Otherwise yj Donglei Du (UNB)1,0,If warehouse j is establishedOtherwiseSCM33 / 67
Solution—Integer Linear Programming approach IIThe ILP is given bymin3Pfj y j j 13P4 P3Pcij xiji 1 j 1xij 1, i 1, 2, 3, 4j 1xij yj , i 1, 2, 3, 4, j 1, 2, 3xij 1, 0, i 1, 2, 3, 4, j 1, 2, 3yj 1, 0, j 1, 2, 3Solving ILP, we get the same optimal solution as in the previousgraph.Donglei Du (UNB)SCM34 / 67
Section 3Optimial Distribution and outsourcingDonglei Du (UNB)SCM35 / 67
An Example of Optimizing Distribution andoutsourcing Channels ISingle product.Twp plants, referred to p1 and p2 .Plant p2 has an annual capacity of 60,000 units, while p1 has anunlimited capacity.The two plants have the same production costs.Two existing warehouses, referred to w1 and w2 , have identicalwarehouse handling costs.Three market areas, c1 c2 and c3 , with demands of 50,000,100,000, and 50,000, respectively.Donglei Du (UNB)SCM36 / 67
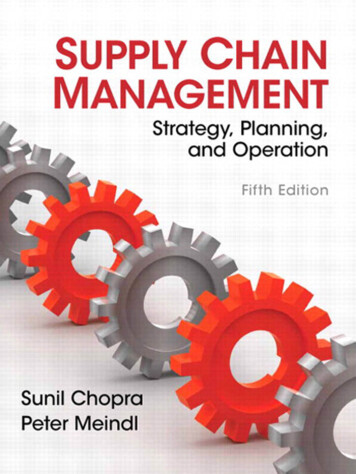
An Example of Optimizing Distribution andoutsourcing Channels IIThe following table provides distribution cost per unit.p 1 p 1 c1 c2 c30 4 3 4 55 2 2 1 2w1w1xw1c1fx p1w1p1x p2 w160,000Donglei Du (UNB)p2w1045x p2 w22w2SCM50,000c2100,0003 xw2c12xw1c24xw2c21x p1w2c1xw cxw1c3 5 1 32c350,00037 / 67
An Example of Optimizing Distribution andoutsourcing Channels IIIOur objective is to find a distribution strategy that specifies theflow of products from the suppliers through the warehouses tothe market areas without violating the plant p2 productioncapacity constraint, that satisfies market area demands, and thatminimizes the total distribution costs.Donglei Du (UNB)SCM38 / 67
Analysis and Solution IWe formulate this problem as a linear programming:Define the following variablesxpi wj be the flow from plant pi (i 1, 2) to warehouse wj(j 1, 2).xwj ck be the flow from warehouse wj (i 1, 2) to market ck(k 1, 2, 3).Donglei Du (UNB)SCM39 / 67
Analysis and Solution IIThen the LP is given bymin 0xp1 w1 5xp1 w2 4xp2 w1 2xp2 w2 3xw1 c1 4xw1 c2 5xw1 c3 2xw2 c1 1xw2 c2 2xw2 c3xp2 w1 xp2 w2 60, 000xp1 w1 xp2 w1 xw1 c1 xw1 c2 xw1 c3xp1 w2 xp2 w2 xw2 c1 xw2 c2 xw2 c3xw1 c1 xw2 c1 50, 000xw1 c2 xw2 c2 100, 000xw1 c3 xw2 c3 50, 000x 0Donglei Du (UNB)SCM40 / 67
Analysis and Solution IIIThe optimal solution is given in the following c1c250,0005c3total cost [140(0) 60(2) 50(3) 40(4) 60(1) 50(
Supply Chain Management: Logistics Network Design Donglei Du (ddu@unb.edu) Faculty of Business Administration, University of New Brunswick, NB Canada Fredericton E3B 9Y2 Donglei Du (UNB) SCM 1 / 67. Table of contentsI 1 Introduction The Logistics Network Major Steps in Network Design 2 A Facility Location Problem 3 Optimial Distribution and outsourcing 4 Maximum ow problem 5 Network