Transcription
Joel E Tallaksen2016-2019Effects of a Solar Cooling System on SowPerformanceLee Johnston, Mike Reese, Eric Buchanan,Yuzhi Li, and Adrienne HilbrandsWest Central Research and Outreach Center,MorrisKevin Janni, Brian Hetchler, and Erin CortusBiosystems and Biological Engineering, St. PaulUniversity of MinnesotaVersion 2.0Effects of a Solar Cooling System on Sow Performance2016-201911/25/20200
12Table of ContentsIntroduction .2Methods.22.1Facilities and equipment . 22.1.1Farrowing barn design . 22.1.2Floor cooling pads. 32.1.3Cooled drinking water . 52.2Animals and management . 52.3Data collected . 62.3.1Cooling system performance . 62.3.2Electricity use and solar array performance. 62.3.3Sow and litter performance. 62.3.4Sow behavior . 62.43456Statistical analysis of data. 7Results and Discussion.73.1Farrowing room conditions . 83.2Cooling system performance . 113.3Electricity use and solar array performance. 133.4Sow and litter performance. 16Basic Economic Analysis .21Conclusions .23References .23Funding AcknowledgmentRARF- funding from the Rapid Agricultural Response Fund was used to carry out this LCA analysis for LCCMRfunded water heating and cooling as well as further RARF research with electric piglet heating.LCCMR-The development of the swine sow cooling and piglet heating equipment with water heat/cool mats inthis project was supported by The Minnesota Environment and Natural Resources Trust Fund as recommended bythe Legislative ‐ Citizen Commission on Minnesota Resources (LCCMR) Project #: LCCMR-2016-07eThe Trust Fund is a permanent fund constitutionally established by the citizens of Minnesota to assist in theprotection, conservation, preservation, and enhancement of the state’s air, water, land, fish, wildlife, and othernatural resources. Currently 40% of net Minnesota State Lottery proceeds are dedicated to growing the Trust Fundand ensuring future benefits for Minnesota’s environment and natural resources.DisclaimerAll data, models, and predictions contained in this report are solely works of the authors. Neither the University of Minnesotanor the funding agency(ies) have reviewed these statements for accuracy or completeness. For comments or questions, pleasecontact the author.Effects of a Solar Cooling System on Sow Performance11/25/20201
1 IntroductionGlobal climate change is predicted to make our climate hotter with a greater frequency of extremeweather events compared with 50 years ago. This increased temperature will increase the severity andfrequency of heat stress events for swine produced in Minnesota. Heat stress of pigs reduces theirgrowth and reproductive performance and compromises their welfare (Ross et al., 2015) leading todecreased efficiency of pork production systems. This decreased efficiency leads to an increase inresources (e.g. feed, water, fuel, electricity) required to produce a pound of edible pork whichnegatively affects the carbon footprint of pork production.Minnesota’s northern climate does not protect pigs from heat stress. Most pig barns are designed andbuilt to protect pigs against cold temperatures during the long Minnesota winters with lessconsideration for cooling needed during the short but hot Minnesota summers. All classes of pigs aresusceptible to heat stress during summer but sows are particularly sensitive around the time offarrowing and during lactation. Mortality rate of sows typically increases during summer on commercialsow farms in the Upper Midwest region (Deen and Xue, 1999) compared with other times of the year.Consequently, installation and operation of an effective cooling system for sows might improve sowperformance and welfare and simultaneously enhance the carbon footprint of commercial porkproduction systems during summer heat stress periods.Currently, there are several approaches to cooling sows in the farrowing stage of production such asincreased ventilation rates, evaporative cooling pads, drip coolers, snout coolers, and altered dietformulations. Each approach provides some degree of cooling sows but each has drawbacks. Our intentin this project was to investigate a different approach to cooling sows that was powered by renewableenergy. Our hypothesis was that sows cooled by a solar-powered system would be more comfortableand productive during heat stress than uncooled sows and this would improve the carbon footprint ofthe farrowing operation.2 Methods2.1 Facilities and equipment2.1.1 Farrowing barn designA mechanically-ventilated, confinement farrowing barn with two identical, mirror image rooms wasused for this experiment. This farrowing barn was located at the West Central Research and OutreachCenter in Morris, MN. Ventilation was provided by a combination of wall and pit fans controlled bythermostats in each room. Supplemental heat was provided by one natural gas fired heater located ineach room. Each farrowing room was equipped with 16 farrowing stalls (5 ft x 7 ft) that confined sowsin the center portion with piglet creep areas on both sides of the sow. Each farrowing stall was fittedwith a stainless steel, deep bowl feeder for sows, a nipple drinker for sows, and one nipple drinker forpiglets. Perforated flooring under the sow was made of cast iron while flooring under piglets wasplastic-coated woven wire. Piglet creep areas were provided with supplemental heat. Farrowing stallswere situated above an anaerobic manure collection pit that was 8 ft. deep.One room was designated as the Control room which was provided with no supplemental cooling forsows. The Cool room was identical to the Control room except cooling pads were installed in floorsbeneath sows were connected to a cooling loop.Effects of a Solar Cooling System on Sow Performance11/25/20202
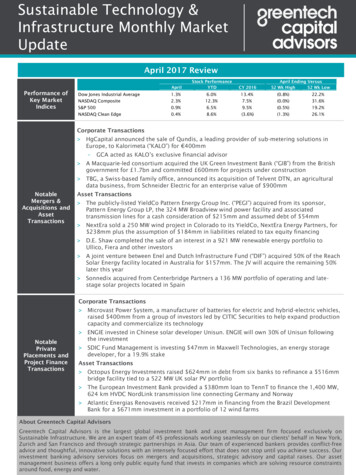
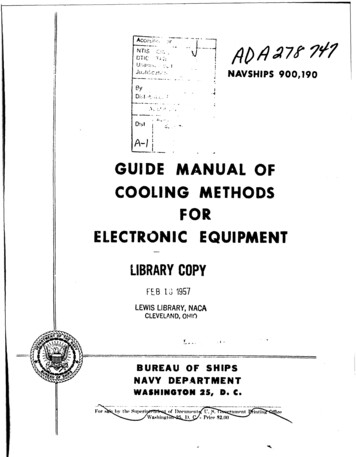
2.1.2 Floor cooling padsA cast iron pad manufactured by Nooyens Corporation (Netherlands) was placed in the front portion ofthe floor under each sow in the Cool room (Figure 1). Underneath this flooring pad, a serpentine tubingis attached that allows cool water to circulate which cools the floor surface sows lie on. The sameflooring pads were installed in each farrowing stall in the Control room but the underfloor tubing wasnot connected to any cooling system.Figure 1. Flooring pad installed in the front portion of the sow’s farrowing stall (left) and the coolingloop attached beneath the flooring (right).Water contained in a closed loop is cooled to about 65 F using a liquid-to-liquid heat pump (CarrierCorp., Indianapolis, IN; Model GW024). Pumps circulate cooled water to each farrowing stall in aparallel loop so that each stall receives cool water at a similar temperature. Sows lying on the cooledfloor transfer heat from their body to the floor and this heat is transferred to the cool water circulatingin the loop. The warmed water that exits the flooring is returned to the heat pump where it is cooledand circulated back to the flooring inserts in a closed loop system. A buffer tank is included in thecooling system to serve as a cool water reservoir to ensure consistent delivery of cool water to all 16farrowing stalls in the Cool room. If the heat extraction capacity of the heat pump is overwhelmed, afan coil unit included in the system extracts excess heat and exhausts it outside the barn. As part of asupplemental project, the heat extracted from the sow cooling loop was moved to a separate,independent system that circulated heated water through pads located in the piglet creep area. Furtherdiscussion of the piglet heating project is beyond the scope of this report. A complete schematicdrawing of the sow cooling and piglet heating system is displayed in Figure 2.Effects of a Solar Cooling System on Sow Performance11/25/20203
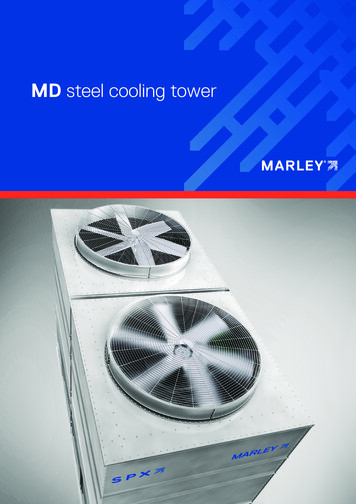
Figure 2. Schematic representation of the sow cooling and piglet heating system used in thisexperiment.The entire cooling system is powered by a 20 kW solar array (Figure 3) installed outside the barn. Thesolar array consisted of 60 solar photovoltaic panels (Heilene USA, Mount Iron, MN; Model 72P320) and2 power inverters (SolarEdge Technologies Inc, Fremont, CA; Model SE9KUS).Effects of a Solar Cooling System on Sow Performance11/25/20204
Figure 3. Solar panels (20 kW) installed at the WCROC used to power the sow cooling system2.1.3 Cooled drinking waterIn the Cool room, cool water (55 to 60 F) was supplied to the sow’s nipple drinker in each farrowingstall. Cool water was circulated continuously to each nipple drinker through insulated supply lines toensure each time a sow drank, it was cool water. Water was cooled by the heat pump described above.2.2 Animals and managementEighty four, mixed parity, crossbred maternal-line sows were used to evaluate the efficacy of the solarpowered cooling system. Parity of sows ranged from 0 to 9. Sows farrowed in three contemporarygroups from June to August of 2017 and 2018. Sows were assigned randomly within parity to Control orCool rooms when they were moved into farrowing rooms on about day 109 of gestation (5 days beforeexpected farrowing date). During commissioning and testing of the cooling system (June, 2017), coolerthan expected weather did not provide consistent heat stress of sows. Without consistent heat stressconditions, we could not adequately evaluate efficacy of the cooling system. So, during threesubsequent farrowing groups included in the data for this project, we imposed consistent heat stress onsows. Heaters and ventilation fans were set to a target temperature of 85 F during daytime (9:00 am to7:00 pm) and 75 F at night (7:00 pm to 9:00 am). Heaters and ventilation fans were set to ensuredesired room temperatures were achieved while maintaining acceptable air quality. Heat stressconditions were imposed in both Control and Cool rooms so that the cooling system could be properlyevaluated. Sows were exposed to heat stress conditions upon entry to the farrowing rooms. Thecooling system in the Cool room was also operational beginning the day sows entered the farrowingroom until pigs were weaned.Sows were provided ad libitum access to water throughout the study. A standard corn-soybean mealbased lactation diet was offered at 5 pounds per head daily from entry to the farrowing room until thesow farrowed. After farrowing, feed allowance for sows was increased steadily until day 4 postpartumat which time sows were allowed ad libitum access to feed. Sows farrowed naturally without induction.Within 24 hours of birth, piglets were processed which included docking tails, clipping needle teeth, eartagging for individual piglet identification, injecting supplemental iron, and castration of male piglets.Effects of a Solar Cooling System on Sow Performance11/25/20205
Litter size was equalized within farrowing room as much as possible by cross-fostering pigs within 24hours of birth. Litters were weaned at about 21 days of age and sows were moved to a single barn formating. Manipulation of room temperatures and operation of cooling systems ceased on weaning day.2.3 Data collected2.3.1 Cooling system performanceThe water flow rate and temperatures entering and leaving every flow loop within the sow cooling andchilled drinking water systems were measured by sensors (Badger Meter, Milwaukee, WI; Model 380CS/HS) installed in system piping. Data from these sensors were recorded by a supervisory and controlsystem (Johnson Controls Inc., Milwaukee, WI; Model JACE FX30). Thermocouples were connected tothe underside of three flooring pads in both the Control and Cool rooms to measure temperature of theflooring pads. In addition, two Novus RNT-WM 0-10V sensors were placed at pig level within each roomto measure temperature and humidity. Data were recorded from the day sows entered the farrowingroom until the day of weaning.Concentrations of carbon dioxide (CO2), ammonia (NH3), methane (CH4), and nitrous oxide (N2O) weremonitored and recorded every hour throughout the study period in each room. Concentrations of thesegases provide a qualitative measure of ventilation adequacy.2.3.2 Electricity use and solar array performanceElectrical current sensors (Magnelab, Longmont, CO; Model SCT 0400) were installed on most electricalcircuits including wall and pit ventilation fans, lights, and heaters. Data from these sensors wereaveraged and recorded every 10 minutes with a Campbell Scientific CR800 data logger. Another datalogger (eGauge, Boulder, CO; Model EG3000) with a total of 9 AC current sensors was installed tomonitor electricity consumption by the sow cooling system including heat pump, fan coil unit, andcirculation pumps. In addition, three AC current sensors were used to measure the total electricityconsumed by the entire barn. Electricity produced by the solar array was monitored at the array powerinverters and stored on a server provided by the inverter company and accessed via an internetconnection.2.3.3 Sow and litter performanceParity, farrowing date, and weaning date were recorded for each sow. Sows were weighed at entry tothe farrowing room, within 24 hours after farrowing, and at weaning. Backfat depth and loineye area atthe 10th and last rib were recorded using real-time ultrasonography on day 109 of gestation and atweaning. Voluntary feed intake of sows was recorded on a weekly basis. Respiration rate and rectalbody temperature of sows was recorded on the day before farrowing, within 24 hours after farrowingand weekly throughout the lactation period. Days from weaning to expression of estrus were recorded.Litter size at farrowing (total born, live born, stillborns, and mummies) and weaning was recorded.Individual pigs were weighed at birth and at weaning. Records of piglet deaths included date of death,weight of piglet at death, and the suspected cause of death.2.3.4 Sow behaviorBehavior of sows in Group 1 and Group 2 was recorded using video cameras (tru-Vision High DefinitionTVI Bullet, Built-in IR, Interlogix, Costa Mesa, CA) mounted over 8 farrowing stalls in each room. Sowsand litters were video-recorded 24 hours daily beginning the day before farrowing through the firstweek of lactation. Additionally, video-recording occurred one day (24 hours) per week throughoutEffects of a Solar Cooling System on Sow Performance11/25/20206
lactation and the day before weaning. Videotapes were transcribed using continuous observation forfarrowing behavior and drinking behavior, and using the scan sampling method for postures. Forfarrowing behavior, total duration of farrowing started from delivery of the first piglet until the lastpiglet, and intervals between delivery of piglets were registered. Drinking behavior and postures wereregistered for day 1, day 3, day 7, day 14 and day 21 after farrowing. For drinking behavior, number ofdrinking bouts and duration of each drinking bout were registered for 2 hours between 3 and 5 pmwhen sows were least disturbed by routine management and room temperature was at the highestpoint during the day. For postures, sows were scanned at 5-min intervals for 24 hours on each of the fivedays. At each scan, postures of standing, lying laterally (on side), lying ventrally (on belly), or sitting ofeach sow was recorded, and time budgets for each posture for sows were calculated (Martin andBateson, 1993).2.4 Statistical analysis of dataData collected to characterize environmental conditions in the farrowing rooms, performance of thecooling system, and electricity use and production for each farrowing group are expressed as raw meansover time. Within each farrowing group, there was only one cooled room and one control room soreplication of treatments was achieved over successive farrowing groups. By presenting these data asraw means, one can understand the repeatability of environmental conditions which allows a morecomplete understanding of the sow and litter responses.Data for sow and litter responses were analyzed using the Glimmix procedure of SAS (SAS Institute, Cary,NC) with room treatment as a fixed effect and contemporary farrowing group as a random effect. Forsow traits that were measured repeatedly (body weight, backfat depth, feed intake, rectal temperature,respiration rate, postures, and drinking behavior), a repeated measures analysis was used that includedthe fixed effects of room treatment, time, and their interaction with farrowing group as a random effect.Behavioral data were analyzed using the Glimmix procedure with Poisson distribution with roomtreatment, day (sow postures and drinking behavior) and their interaction as fixed effects. For analysisof farrowing behavior, total litter size was used as a co-variate. Sow and litter were considered theexperimental unit in the analysis of animal performance and behavioral responses.3 Results and DiscussionThis experiment was designed to test the efficacy of a renewably-powered cooling system to mitigatethe negative effects of heat stress on lactating sows. A valid evaluation of the cooling system demandedsows be consistently heat stressed. Consequently, this experiment was designed to be conductedduring summer when heat stress typically occurs. The cooling system and solar array were installed andoperational in time for the first group of sows to farrow in mid-June, 2017. Unfortunately,environmental conditions were rather cool such that sows experienced only transient heat stress.Additionally, we experienced a variety of glitches in the cooling system that resulted in intermittentoperation during the first farrowing group. Because of these problems, data from this first group ofsows were not included in the final dataset. These experiences with the first group of sows allowed usto fine-tune the cooling system for consistent operation in subsequent farrowing groups. And, welearned that we could not rely on the ambient environment to provide consistent heat stress conditionsfor sows. In subsequent farrowing groups, we imposed a consistent heat stress on all sows by settingthe natural gas-fired heater to supplement heat when needed to maintain a room temperature of aboutEffects of a Solar Cooling System on Sow Performance11/25/20207
85 F during daytime (9:00 am to 7:00 pm) and 75 F during nighttime (7:00 pm to 9:00 am). Thisartificial control of room temperatures allowed us to adequately test the efficacy of the cooling system.3.1 Farrowing room conditionsRoom temperatures remained above 75 F throughout the entire experiment and oscillated between 75and 85 F throughout most of the experiment (Figure 4). Temperatures were very consistent betweenControl and Cool rooms. These data confirm that target room temperatures were achieved as dictatedby the experimental design and that sows were consistently heat stressed. Black et al. (1993) suggestedthat lactating sows experience heat stress when environmental temperatures rise above about 64 to 72 F. Efficacy of the sow cooling system could be properly tested since sows were consistently heatstressed. Humidity readings in each room ranged from 43 to 77% and were consistent between Controland Cool rooms (Figure 5).Figure 4. Temperatures recorded in farrowing rooms averaged over 12-hour periods (7:00 am to 7:00pm) each day of all three farrowing groups.Effects of a Solar Cooling System on Sow Performance11/25/20208
Figure 5. Humidity recorded in farrowing rooms averaged over 12-hour periods (7:00 am to 7:00 pm)each day in two farrowing groups.Equipment to sample room air and analyze gas concentrations was available for Groups 1 and 2. Gasconcentrations for Group 3 were not determined. We were unable to directly measure ventilation rateswithin each farrowing room. However, carbon dioxide concentration in the farrowing rooms weremeasured as an indirect indicator of ventilation rates. The concentration of carbon dioxide in ambientair is about 400 ppm (NOAA, 2019). Carbon dioxide is exhaled by pigs housed in the farrowing roomswhich increases the concentration of carbon dioxide within the room compared with ambient air.Inadequate ventilation rates result in extreme increases in carbon dioxide concentrations within theroom. A carbon dioxide concentration in excess of 5,000 ppm is indicative of ventilation rates that aretoo low (MWPS, 1990). Carbon dioxide concentrations were similar between Control and Cool roomsand were well below the critical threshold of 5,000 ppm (Figure 6). These data indicate that rooms wereventilated similarly and adequate quantities of air fresh ambient air were introduced to each roomthroughout the experiment.Effects of a Solar Cooling System on Sow Performance11/25/20209
Figure 6. Carbon dioxide concentration in farrowing rooms averaged over 12-hour intervals (7:00 am to7:00 pm) for each day of farrowing groups one and twoAmmonia concentrations of air in farrowing rooms indicate the adequacy of manure managementsystems employed. Elevated ammonia concentrations suggest excessive accumulation of manure in thepigs’ airspace. Ammonia concentrations were consistently below 8 ppm in both rooms throughoutGroup 1 (Figure 7). About a week after the start of Group 2, ammonia concentration spiked above 25ppm in the Cool room during one 12-hour period but returned to baseline concentrations in the next 12hour period. Through the latter portion of Group 2, ammonia concentrations in the Cool room werehigher than in the Control room. A clear explanation for this rise in ammonia concentrations in the Coolroom is not readily apparent. With the exception of one 12-hour period, ammonia concentrations werewell within accepted ranges and remained well below the critical threshold of 25 ppm outlined by theNational Pork Board in the Pork Quality Assurance Plus program (National Pork Board, 2019).Effects of a Solar Cooling System on Sow Performance11/25/202010
Figure 7. Ammonia concentrations in farrowing room air averaged over 12-hour periods (7:00 am to7:00 pm) for each day of farrowing groups one and two3.2 Cooling system performanceTemperatures from the underside of three flooring pads below the sows in both the Control and Coolrooms were averaged over 12 hours (Figure 8). In both studies, measured temperatures of the flooringpads in the Cool room were lower than the pads in the Control room. The differences in flooring padtemperatures in the Cool room and the Control room were larger in Group 2. It is noted that the Controlroom pads were warmer than the room temperature indicating the sows were heating the pads as theylaid on them.Effects of a Solar Cooling System on Sow Performance11/25/202011
Figure 8. Temperature of flooring pads in Cool and Control rooms averaged over 12-hour periods (7:00am to 7:00 pm) for each day of farrowing groups one and two.Temperatures of the cooled drinking water were consistently lower in the Cool room compared with theControl room (Figure 9). Temperature of drinking water ranged from 58 F to 74 F in the Cool room(average 63.3 F) and 64 F to 106 F in the Control room (average 82.9 F). Jeon et al. (2006)reported that decreasing temperature of drinking water for heat-stressed lactating sows from 72 F to59 F increased voluntary feed intake of sows by 40%. So, cool temperature of drinking water in theCool room likely encouraged increased feed intake of sows in the Cool room compared with the Controlroom (see below).Effects of a Solar Cooling System on Sow Performance11/25/202012
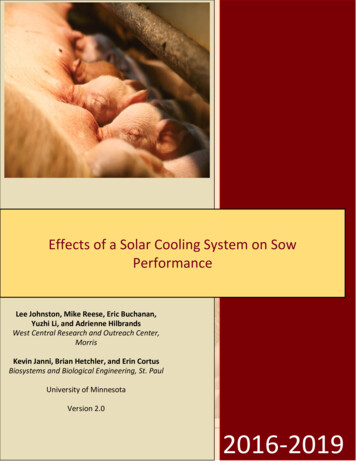
Figure 9. Temperature of drinking water in Control and Cool rooms averaged over 12-hour periods (7:00am to 7:00 pm) each day for all three farrowing groups.3.3 Electricity use and solar array performanceElectricity consumed in the Cool room was consistently higher than that consumed in the Control room.For each farrowing group, electricity use in the Cool room was 160% to 260% higher than electricity usein the Control room (Figures 10, 11, and 12). The higher electricity use in the Cool room can beattributed to operation of the heat pump, the fan coil unit and the continuous operation of pumps usedto circulate cool water in the floor pads and nipple drinkers. These three components representedbetween 61 and 87% of the total electricity used in the Cool room on a daily basis. Interestingly, thesolar array generated sufficient electricity to meet the higher electrical usage in the Cool room forfarrowing groups one and two.Effects of a Solar Cooling System on Sow Performance11/25/202013
Figure 10. Electricity used in Control and Cool rooms and solar PV electricity produced for the firstfarrowing group. Average daily use of electricity in the Control and Cool rooms was 35.3 and 93.0 kWh,respectively. Average daily solar electricity production was 95.3 kWh.Effects of a Solar Cooling System on Sow Performance11/25/202014
Figure 11. Electricity used in Control and Cool rooms and solar PV electricity produced for the secondfarrowing group. Average daily use of electricity in the Control and Cool rooms was 19.7 and 71.5 kWh,respectively. Average daily solar electricity production was 86.7 kWh.Effects of a Solar Cooling System on Sow Performance11/25/202015
Figure 12. Electricity used in Control and Cool rooms for the third farrowing group. Average daily use ofelectricity in the Control and Cool rooms was 24.3 and 74.4 kWh, respectively. Average daily solarelectricity production was not recorded due to a failure of the monitoring equipment.3.4 Sow and litter performanceAverage parity of sows assigned to Control and Cool treatments was not different as expected in thisexperiment (Table 1). Similarly, body weight of sows was not different statistically when sows enteredthe farrowing room at the start of the experiment or at any point in the experiment. Body weight ofsows declined (P 0.001) over time as the sows lost weight during the farrowing process and aslactation progressed. When considering total body weight loss during lactation, sows housed in the Coolroom lost less weight (P 0.05) than sows housed in the Control room. Other measures of sow bodycondition, backfat depth and loin muscle area, were not influenced by the sow cooling system (Table 1).Throughout farrowing and lactation, sows lost a significant amount of backfat depth and loin musclearea but the magnitude of these losses were similar for sows in the Cool and Control rooms. Lactationlength and days from weaning to estrus were similar for sows housed in the Control and Cool rooms.Effects of a Solar Cooling System on Sow Performance11/25/202016
Table 1. Effect of solar-powered cooling system on sow performanceTraitControl roomCool RoomSEaNo. of sows4143-Parity of sows2.933.000.29Sow weight, lb:Day 109 of gestation592.8575.324 h post farrowing537.9526.612.43Weaning490.5495.2Sow wt. loss in lactation, lb47.331.47.61Sow backfat depth, in.:Day 109 of gestation1.251.200.113Weaning0.900.94Sow loin muscle area, in2:Day 109 of gestation8.047.930.175Weaning7.117.16Lactation length, days21.921.82.39Days to estrus4.424.400.24aStandard error.bNot significant.Significant effects-NSbTime ( 0.001)Room ( 0.05)Time ( 0.001)Time ( 0.001)NSNSThe reduction in body weight loss for sows housed in the Cool room likely resulted from the highervoluntary feed intake of Cool sows compared to Control sows (Figure 13). Averaged over the entirelactation period, daily feed intake of sows housed in the Cool room was 11.56 lb compared with 9.87 lbfor Control sows. Admittedly, feed intake of sows in the Cool room was lower than desired suggestingthat these sows still experienced some degree of heat stress but the magnitude was significantly lessthan for sows housed in the Control room. This is supported by the significantly lower rectaltemperatures of sows housed in the Cool room compared with t
2.1.2 Floor cooling pads A cast iron pad manufactured by Nooyens Corporation (Netherlands) was placed in the front portion of the floor under each sow in the Cool room (Figure 1). Underneath this flooring pad, a serpentine tubing is attached that allows cool water to circulate which cools the floor surface sows lie on.