Transcription
AA241X Spring 20092. Simple Performance Estimation2.1 Important Performance ParametersUAV performance parameters of interest may include stall speed, climb rate, maximumaltitude, range, maximum speed, maximum sustained turn rates, and many other flightcharacteristics that depend on the UAV intended use. These, in turn are determined bythe aircraft weight, propulsion system performance and the vehicle's aerodynamiccharacteristics.At the earliest stages of UAV conceptual design, some estimate of weight, propulsivepower and efficiency, and aerodynamic performance is required. Unlike transportaircraft, simple parametric models are often not available and custom methods arecommon. Techniques for estimating these characteristics are described briefly in thefollowing sections and in the AA241A,B n.html)Once these characteristics are known, or estimated, some of the basic performancemeasures can be computed directly. These include the followingStall speedFor transport aircraft, stalling speed is primarily constrained by runway lengthrequirements. One might think that since the field length requirements for UAV's maynot be critical constraints (although that's not always true), that stalling speed is not anissue, but there are several reasons that it might be. If the UAV is to land on rough fields,reducing the stall speed can reduce the likelihood of damage and stalling speed affectsgear design on some large UAV's. Stalling speed may also have a direct effect on theability to maneuver – especially important for combat UAV's. But for high altitude andlong endurance UAV's making sure that the stalling speed is sufficiently low to achievethe desired design condition is often critical.where W is the vehicle weight, S is the wing reference area, CLmax is the maximum liftcoefficient, and ρ is the air density (see http://desktopaero.com/stdatm.html or the AA241A,B notes).1
AA241X Spring 2009As can quickly be shown (by assuming a quadratic drag polar as mentioned in thefollowing sections), the lift coefficient for maximum lift-to-drag ratio (closely related tothat for maximum range is:while the lift coefficient for maximum endurance (assuming fixed propulsion efficiencyand quadratic polar) is:The point here is that for airplanes with high AR (span2 / S), required for long endurancehigh altitude flight, this CL can easily exceed the maximum CL of the wing. The situationis made worse for low Reynolds number aircraft for which CDp is higher and CLmax lower.EnduranceIf the efficiency of the propulsion systems is known and the total energy content of thefuel or battery is given, the endurance may be estimated based on energy considerations.For battery-powered aircraft the weight of the airplane does not vary in time, so theendurance may be easily estimated. The power required for level flight is: P D VIn this case, the drag may be computed as described in the following sections with thesubstitution that Lift Weight.This power is the that delivered by the propulsion system to overcome drag. However,the power that is delivered to the motor must be converted to mechanical work, may gothrough a gear box, and may be converted into thrust through a propeller. All of theseprocesses introduce some loss so that the actual power required by the motor is:The total energy used to overcome drag is then:Ereq D V t, where t is the endurance.If the energy available from the batteries is Eavail, and the efficiency of the motor andpropellers is ηoverall, then the endurance may be written in terms of the energy in thebatteries:If the overall propulsion system efficiency is constant with speed (it's usually not), thenthe endurance is maximized by minimizing D V. Otherwise, it requires that thepropulsion system (e.g. propeller) and airframe are optimized together. Clearly the speed2
AA241X Spring 2009for maximum endurance is not the same as the speed for minimum drag (unless theefficiency varies in a special way). While the range of an aircraft with fixed propulsiveefficiency is maximum when the drag is minimum (and L/D is maximum), the endurancegenerally occurs at a lower speed (or higher CL).CeilingSince the power required for level flight increases as speed increases, the airplane ceilingmay be limited by the available power. This is because the airplane speed varies withdensity:It is also common that the maximum power available from the engine decreases withaltitude. This is certainly true of internal combustion engines, but one of the features ofelectric propulsion is that the available (engine) power changes little with altitude. Thepropeller performance does change with altitude and it is important to evaluate this atsome point in the early stages of the aircraft design.The ceiling may also be limited, not by power, but by total energy. Since the climb ratevaries with altitude, one must integrate the motion of the airplane over time to determinethe maximum achievable altitude.Climb RateThe rate of climb may be determined from energy considerations. The rate at whichpower is being used by the system is that due to changing the energy of the system andthe rate at which drag is consuming the power. In the case that the climb angle is notlarge, the drag may still be computed by assuming that the lift is approximately equal tothe weight, but the rate of energy use is given by:or:This assumes that the speed is constant. If the airplane is accelerating (as it would if theCL were constant and the density were decreasing with altitude), there is an additionalterm associated with the kinetic energy gain.When density, weight, available power, or speed vary during the flight, the climb ratechanges and a more accurate estimate of the altitude is obtained by integrating theperformance in time. This kind of complete "mission analysis" is common even in theearly stages of UAV design.3
AA241X Spring 20092.2 Initial Weight EstimationFor AA241X, the most reasonable approach to obtain a rough estimate of your aircraftweight is to create a weight statement that lists all of the components whose weights youknow, whose weights you estimate, and whose weights you can compute by some means.In this class the propulsion system and battery weight is given; the control system weightis known, and you must estimate the fuselage, tail, and wing weights. The latter you cando parametrically, knowing the density of foam, estimating airfoil thickness, and makinga rough estimate of the weight of skins, stiffeners, control surface hinges, etc.Note that parametric weight estimation based on large aircraft data is usually veryinappropriate for small UAV design. Even the form of the variation of wing weight withsize may be quite different.4
AA241X Spring 20092.3 Initial Propulsion System PerformanceAs indicated previously, the propulsion system performance is critical to the performanceof the vehicle. Two major parameters are of particular interest: the maximum availablethrust or power and the system efficiency. The thrust, efficiency, speed, and power intothe motor are related by:Pinto motor T V / ηoverallThe overall efficiency is the product of the component efficiencies of the motor, controlelectronics, gear box, and propeller. These parameters may be computed usingcomputational analysis models of the components or may be based on experimental data.A detailed analysis includes the effect of load and RPM on the motor efficiency and theeffect of speed and RPM on propeller efficiency.However, if one assumes that the propeller and motor are well matched to the designflight condition, some simple estimates of over efficiency are possible. For very goodbrushless motors on might achieve motor efficiencies as high as much as 90%. For smallbrushed motors 50% is very common and 25% not rare. With this large variation, it isessential to have data on a particular motor. Similarly, well-designed propellers mayreach efficiencies of 85%, but small direct-drive props at low Reynolds numbers are morecommonly about 50% efficient. Motor control electronics similarly range in performancewith 60% to 90% variation seen.Propeller performance is often characterized by curves that illustrate the variation ofthrust and torque with RPM, forward speed, and sometimes pitch angle. Motorperformance is often described by similar curves and is also summarized with a fewparameters such as maximum no load RPM and current and stall torque and current.From just these four numbers a simple motor performance map may be created.The final critical element of an electric propulsion system is the source of electricalpower. In AA241X we will provide a standard battery pack, but in general one mustexamine battery total energy, maximum power output, and weight and match these to theneeds of the rest of the propulsion system.5
AA241X Spring 20092.4 Drag BookkeepingFor low speed aircraft we divide drag into the following components:Drag Skin Friction Drag Viscous Pressure Drag Inviscid (Vortex) DragThe first two effects are often combined into a single term called parasite drag.Skin Friction drag arises from the shearing stresses at the surface of a body due toviscosity. It accounts for most of the drag of a transport aircraft in cruise.Viscous pressure drag also is produced by viscous effects, but not so directly. Thepressure distribution is modified by the presence of a boundary layer. Although in2-D inviscid flow the pressures on forward and aft surfaces balance so that nodrag is produced, the effect of the boundary layer leads to an imperfect cancelingof these pressures so some additional drag is created.Inviscid or vortex drag is produced by the trailing vortex wake of a threedimensional lifting system.The parasite drag may be estimated as:Drag Skin friction and pressure drag Lift-Dependent Viscous Drag Vortex DragThe drag is often expressed in dimensionless form:where Sref is the reference area. The reference area is not so clear when the wing is not asimple tapered planform, but for the purposes of this class, it is taken to be the projectedarea of the equivalent trapezoidal wing planform. The parasite drag is often written interms of the equivalent flat plate drag area, f:If one assumes that the vortex drag varies with CL2 and the parasite drag is constant withCL, the overall drag may be written:or in dimensional form:6
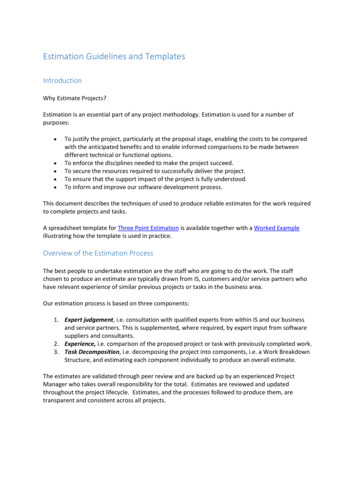
AA241X Spring 20092.4.1 Parasite DragThe parasite drag of a typical airplane in the cruise configuration consists primarily of theskin friction, roughness, and pressure drag of the major components. There is usuallysome additional parasite drag due to such things as fuselage upsweep, control surfacegaps, base areas, and other extraneous items. Since most of the elements that make up thetotal parasite drag are dependent on Reynolds number and since some are dependent onMach number, it is necessary to specify the conditions under which the parasite drag is tobe evaluated. In the method of these notes, the conditions selected are 0.5 Mach numberand the Reynolds number corresponding to the flight condition of interest.The basic parasite drag area for airfoil and body shapes can be computed from thefollowing expression:f k cf Swetwhere the skin friction coefficient, cf , which is based on the exposed wetted areaincludes the effects of roughness, and the form factor, k, accounts for the effects of bothsupervelocities and pressure drag. Swet is the total wetted area of the body or surface.Computation of the overall parasite drag requires that we compute the drag area of eachof the major components (fuselage, wing, nacelles and pylons, and tail surfaces) and thenevaluate the additional parasite drag components described above.We thus write:CDp Σ ki cfi Sweti / Srefwhere the sum includes skin friction, and pressure drag at zero lift of the majorcomponents. cfi is the average skin friction coefficient for a rough plate with transition atflight Reynolds number. Equivalent roughness is determined from flight test data.These computations are divided into evaluation of the following terms: Skin friction coefficient, cfForm factor, kWetted area, Swet2.4.1.1 Skin Friction CoefficientThe skin friction coefficients are sometimes based on experimental data for flat plateswith various amounts of roughness. In the present method, experimental results forturbulent flat plates are fit and combined with basic laminar flow boundary layer theoryto produce the data in the figure below. The data apply to insulated flat plates withtransition from laminar to turbulent flow specified as a fraction of the chord length (xt / c7
AA241X Spring 2009 0 represents fully turbulent flow.) The data are total coefficients; that is, they areaverage values for the total wetted area of a component based on the characteristic lengthof the component.When the skin friction is plotted on a log-log scale the curves are nearly straight lines, butthe actual variation of cf is more pronounced at lower Reynolds numbers.For fully-turbulent plates, the skin friction coefficient may be approximated by one of8
AA241X Spring 2009several formula that represent simple fits to the experimentally-derived curves shown inthe above figure. For incompressible, flow:The logarithmic fit by von Karman seems to be a better match over a larger range ofReynolds number, but the power law fit is often more convenient. (Note that the log inthe above expression is log base 10, not the natural log, denoted ln here.)In the computation of Reynolds number, Re ρ V l / µ, the characteristic length, l, for abody (fuselage, nacelle) is the overall length, and for the aerodynamic surfaces (wing,tail, pylon) it is usually the exposed mean aerodynamic chord. The values of density (ρ),velocity (V), and viscosity µ are obtained from standard atmospheric conditions at thepoint of interest. For our purposes we often use the initial cruise conditions. Atmosphericdata may be computed in the atmospheri
essential to have data on a particular motor. Similarly, well-designed propellers may reach efficiencies of 85%, but small direct-drive props at low Reynolds numbers are more commonly about 50% efficient. Motor control electronics similarly range in performance with 60% to 90% variation seen. Propeller performance is often characterized by curves that illustrate the variation of thrust and .File Size: 737KBPage Count: 15