Transcription
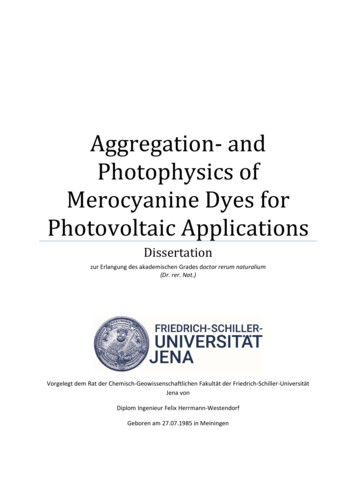
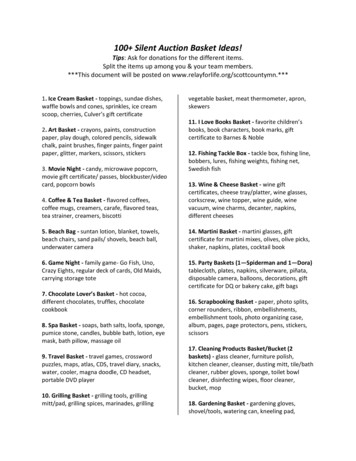
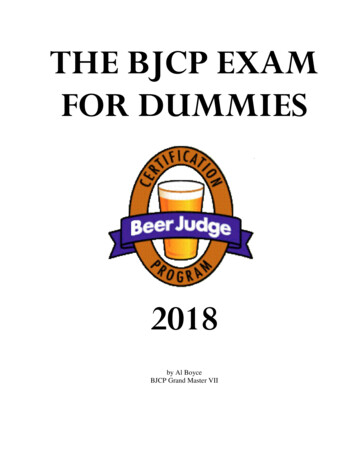
LESSON PLANSPECTRONIC 200 Visible SpectrophotometerFL53099Food Dyes and Beer’s LawWhat makes your drink blue?IntroductionThe wavelength of light is measured in nanometers: 1 nmis 1 x 10 -9 meters. The visible spectrum in Figure 2 showswhich wavelengths correspond to which color of light.Wavelength (nm)Figure 2. Visible spectrumUV-Visible spectrophotometersMeasuring how much of which wavelengths of light areabsorbed by a substance, and getting useful informationabout that substance from the results, is the scientificdiscipline of spectroscopy. The visible spectrum is 80For chemical solutions, we can use an instrument called aspectrophotometer to pass light through the solution andmeasure which wavelengths are absorbed. You can predictwhat wavelengths will be absorbed at a simple level bytaking the visible spectrum and wrapping it into a circle tomake a spectroscopist’s colorwheel. With this wheel, the colorthat you see is the opposite ofthe color that is absorbed. If youknow what wavelengths of thevisible spectrum correspondto which color, you can predictwhere in the spectrum achemical will absorb evenFigure 1. Color wheelbefore doing the experiment.etThe color of lightWhite light, as we see it, is a mixture of all the colors of thespectrum. We are used to seeing raindrops scatter whitelight into its colors to form a rainbow, or seeing “rainbows”of light on a wall from sunlight that has been scattered bycut glass or a prism. If you perceive an object as beingcolored, as opposed to white, it is because colors otherthan the one you see are being absorbed by the object.
part of the electromagnetic spectrum that we can accesswith equipment found in a typical chemistry laboratory. Thebasic principles of spectrum analysis can also be appliedto other instrumentation that examine the ultraviolet,infrared, and radio frequency regions.In a visible spectrophotometer, we shine a beam of lightinto a solution containing the sample, and detect howmuch of it comes out of the other side of the solution. Bycomparing the amount of light transmitted by the puresolvent to the amount transmitted when the sample isdissolved in it, we can calculate a quantity called theabsorbance. Absorbance is directly proportional toconcentration, so if you know the proportionality constant,you can use it to calculate the concentration of a substancein solution. Being able to answer the “how much?” questionmeans that a visible spectrophotometer is a tool for doingquantitative analysis.Knowing exactly which wavelengths of light are absorbedby a substance also gives us information that can beused to tell one substance from another or to determinewhether a sample is a pure substance or a mixture.Being able to answer the “what is it?” question meansthat a visible spectrophotometer is also a tool for doingqualitative analysis.Absorbance and Beer’s LawWhen colored solutions are irradiated with whitelight, the solution selectively absorbs incident light ofsome wavelengths. The wavelength of light where theabsorbance is highest is used as the analytical wavelength.Once the analytical wavelength for a particular solutionis determined, we can learn more about the solutionthrough the relationship between absorbance (A) andthree variables:A εbcBeer’s LawThe three variables are concentration of the solution (c),the pathlength of the light through the solution (b), andthe sensitivity of the absorbing species to the energyof the analytical wavelength. When the concentration isexpressed in molarity and the path length is measured incentimeters, the sensitivity factor is known as the molarabsorptivity (ε) of the particular absorbing species.Visible spectrophotometers are capable of displaying datain either of two scales: Percent transmittance (%T), which is a linear scale Absorbance (A), which is a logarithmic scaleThe linear %T scale can be converted to absorbance whereT is the percent transmittance expressed as a decimal(e.g., 22% 0.22):A –Log10 TThe most important lesson to take home from thislogarithmic relationship is the realization that when theabsorbance is 1.0, only 10% of the light beam’s full intensityis reaching the detector and when the absorbance is 2.0,only 1% of the light beam is reaching the detector. Theaccuracy and sensitivity of low cost instruments starts tosuffer at absorbance values higher than 1.5.Transmittance (or %T) itself is determined by the instrumentby dividing the detector signal when measuring the sample(I) by the signal recorded for a “blank” solution (I0).T II0TransmittanceWhen we work with cuvettes or test tubes where thepath through the liquid is exactly 1 cm, the value of “b” inthe equation for Beer’s Law is simply 1, so it effectivelydrops out of the equation and simplifies it to A εc. Thismeans that: If you were to measure the absorbance of severalsolutions of known concentration, and plot theabsorbance on the y-axis and concentration on thex-axis, the slope would be the molar absorptivity (ε) ofthe sample in solution. If you know the molar absorptivity, you can calculatethe concentration (c) of a solution with ease by simplydividing the absorbance by ε (c A/ε).PurposeIn this experiment, you will make different kinds ofmeasurement on various food dyes:1.A scan of the visible spectrum recorded using aThermo Scientific SPECTRONIC 200 Visible (Vis)Spectrophotometer* will show you which wavelengthsare absorbed by each sample. You will identify a peakor peaks in the scan and record the wavelength of eachpeak. Officially, the wavelength at the top of the peak is
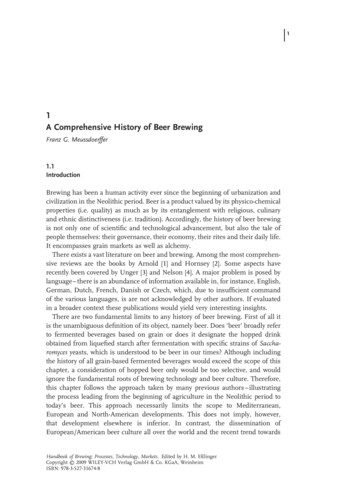
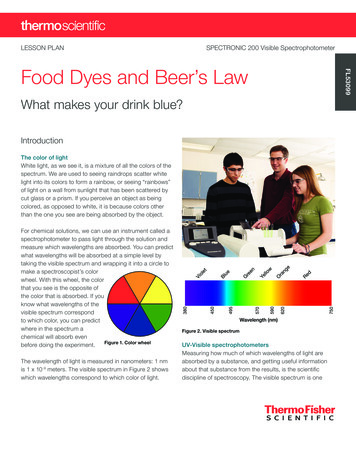
called the “wavelength of maximum absorbance”, whichis abbreviated to λmax (spoken as “lambda max”).2.A single point measurement recorded at λmax will beused to calculate the concentration of red, yellow, green,and blue food dyes in a solution. You will be able todetermine which chemical dye was used in the solutionsamples and whether the dye is a single chemical fooddye or a mixture of dyes.3. Given a stock solution of known concentration, you willmake a Beer’s Law plot by diluting the solution. Youwill then take a sports drink or soft drink and determinethe molar concentration of the Blue No. 1 dye foundin it. From this calculation and the molar mass of yourdye, you will determine the mass of Blue No. 1 dyefound in 591 mL of the solution – equivalent to a 20 fluidounce bottle.ExperimentalProcedureMaking a measurement with the Thermo Scientific SPECTRONIC 200 Visible (Vis) Spectrophotometer*1.Turn on the instrument and allow it to complete itsstartup sequence. Let the instrument warm up andstabilize for at least 30 minutes. Set up the experimentyou want to perform in the spectrophotometer software.Obtain a square plastic cuvette or glass test tube to usein your experiments. If using a test tube cuvette, use apen to place a mark near the top if the cuvette is notalready marked with a white line. The mark allows you toensure consistent placement into the instrument.2.Add liquid to the cuvette until there is 3 cm of liquidin the bottom (4 cm for test tubes). If plastic transferpipettes are available, use one. The exact liquid levelin the cuvette is not critical for good measurements aslong as it is above 3 cm. Do not waste solution or riskspills by over-filling the cuvette.3. Place the cuvette in the sample stage of theSPECTRONIC 200 Visible Spectrophotometer. If usinga plastic cuvette, the clear sides should be on the rightand left. If using a test tube cuvette, place it so that themark faces to the right.4. After the warm-up period, follow steps 2 and 3 usingwater or the appropriate “blank” solvent. Zero theinstrument by pressing the autozero button.5. For each subsequent measurement, empty and rinseyour cuvette, shaking out as much of the rinse solventas possible. When preparing samples, never returnexcess solution to the stock bottle. Pour all waste orexcess into the appropriate waste receptacle. Followsteps 2 and 3 using your sample.Part 1. Scan the dyesPrior to the lab, your instructor should have prepared dyesolutions using the four packs of liquid food dyes fromMcCormick Food Coloring containing red, yellow, blueand green dyes [1]. The actual concentration of the dyesolutions is arbitrary, but they should be chosen to ensurethe largest peak in each solution lies within the absorbancerange of the spectrophotometer.1.Run a scan of each dye solution from 400 nm to700 nm.2.Record the wavelength (λmax) and absorbance at eachpeak in the spectrum. If the color is due to a mixture ofdyes, two λmax peaks will be present.3. Enter this information in Data Table 1 in the Lab Report.SPECTRONIC 200 Visible Spectrophotometer*SPECTRONIC 200 Spectrophotometers are availableon loan from Thermo Fisher Scientific at no cost. Wewill ship it to you, and you ship it back after one week.If you are interested in this program, please visit:www.thermofisher.com/spec200freetrialData analysis: Determination of the dyes used inMcCormick food coloringUse the reference spectra in the Appendix to determinewhich chemical dye(s) are used to make each of the fourcolors from McCormick. Some of the colors are puresubstances and some are mixtures of dyes. Enter youranswers in Data Table 2 in the Lab Report.
Calculations: Molar concentration of dyes present ineach solutionUse the Beer-Lambert Law equation (A εbc),your measured absorbance values, and the molarabsorptivity values in Table 1 below to calculate the molarconcentration of each dye present in the four solutionstested. Write your answers in Data Table 2.You will need to know the pathlength (b). If you have astandard square plastic cuvette the pathlength is 1 cm. Ifyou are measuring in test-tube cuvettes or ordinary testtubes (without a pre-printed white line to help you to alignthem consistently) the pathlength will not be 1 cm. If this isthe case, use a metric ruler to measure the pathlength ofyour cuvette and record it on the Lab Report.Table 1FD&C DyeMolar Massε(g mol-1)(L cm-1 mol-1)as µM. Find the absorbance of your five solutions using thespectrophotometer and record in Data Table 3.Table 2SolutionDilution Ratio(mL stock/mL water)1 (stock solution)10 mL/0 mL28 mL/ 2 mL36 mL/ 4 mL44 mL/ 6 mL52 mL/8 mLUsing your absorbance readings and the molarconcentrations, construct a Beer’s Law plot (plot the molarconcentrations of your known solutions on the x-axis andthe absorbance data on the y-axis). Use a spreadsheetprogram or a graphing calculator to plot your data anddetermine a best-fit line (trend line) to calculate the slope ofyour line. Record the slope of the line in the Lab Report.Red 3 or Erythrosine(cherry red)89831,000Red 40 or Allura Red AC(orange-red)49625,900Yellow 5 or Tartrazine(lemon-yellow)53427,300Yellow 6 Sunset Yellow(orange)45225,900Green 3 Fast Green FCF(sea green)80943,000Blue 1 Brilliant Blue FCF(bright blue)793130,000Part 3. What’s in that drink?Blue 2 Indigotine(royal blue; Indigo Carmine)466111,0001.Obtain about 5 mL of the blue colored drink.2.Measure the absorbance of the drink at λmax for BlueDye No. 1 and record it on the Lab Report.Part 2. Create a Beer’s Law plot for Blue No. 1 dyeWhat is the relationship between the absorbance of acolored solution and its molar concentration? You willprepare a series of solutions of known concentration,measure their absorbance at λmax, and plot the data.Record the concentration of the stock solution:(This will be given by the instructor.)Dilutions: Take approximately 40 mL of the Blue No.1 dye stock solution to your bench and prepare dilutesolutions from it according to Table 2. These solutions willbe your known concentrations of the dye. Calculate themolar concentrations of your solutions and enter them inData Table 3 in the Lab Report. Report the concentrations3. Calculate the concentration of Blue No. 1 dye inthe drink using the Beer’s Law plot from Part 2.4. Calculate the mass of dye present in a 20 oz (591 mL)bottle of the drink.5. Record your calculations and answers in theLab Report.Disposal of chemicals:All of the food dyes can be flushed down the sink withplenty of water.Further reading/reference material1. Sigman SB, Wheeler DE (2004) The quantitative determination of food dyes inpowdered drink mixes. A high school or general science experiment. J Chem Educ81: 1475–1478.
Lab ReportName:Food Dyes and Beer’s LawSection No. or Lab Period:Date:4. Show your concentration calculations for any twoof the dyes listed in the table. Label the calculationwith the name of the dye, box your answer, andwrite neatly!Part 1. Scan the dyesData Table 1Color of Solutionλmax (nm)AbsorbanceRedYellowGreenBlueRecord the pathlength of your cuvette:cmData Table 2Color ofSolutionDye(s)contained insolutionPuresubstance ormixture?Conc.(mol/L)RedYellowGreenPart 2. Create a Beer’s Law plot for Blue No. 1 dyeBlueData Table 3Questions1.2.What was the wavelength of light absorbed by theblue colored solution at its λmax?SolutionDilutionRatio(mL stock/mL water)1(stocksolution)10 mL/0 mL28 mL/2 mLUsing the information in the introduction, determinethe color of light this corresponds to in the visiblelight spectrum.3. How is the color of light absorbed by the coloredsolution related to its perceived color? Is there aconnection between these two?36 mL/4 mL44 mL/6 mL52 mL/8 mLMolar Conc.(μM)MeasuredAbsorbancePlot of Absorbance vs. Concentration for Blue No. 1dye (Beer’s Law plot)Staple your printed graphs to this report sheet and recordthe required data and answers in the spaces below:1.Record the slope of the best-fit line:
Name2.Write the full equation (y mx b format) for thebest fit line on the graph you just created using theslope.3. The slope of the line is derived from the molarabsorptivity (ε) of the dye and the path length (b) ofthe sample in the spectrophotometer. What is thepath length of your cuvette?Record the pathlength of your cuvette:Part 3. What’s in that drink?Absorbance of the blue drink:1.atDetermine the molar concentration of the Blue Dyein the drink. Show all work.cm4. Use the slope of the line to determine the molarabsorptivity (ε) of Blue No. 1 dye. Use the equationfor Beer’s Law to derive and include the units.Note that absorbance has no units. Show yourcalculation here:2. Determine the mass of Blue #1 Dye found in591 mL of the drink. Show all work.Remember: Staple hand-drawn or printed graphs to your labreport Staple the two sheets of the lab report togetherbefore you hand them innm
AppendixReference spectra for FDA food dyes0.80.70.6FD&C Green No. 3“Fast Green”C37H34N2O10S3 2 NaAbsorbanceMW 808.85 gth (nm)0.80.80.7FD&C Red No. 3“Erythrosine”0.6C20H6I4O5 2 Na0.7FD&C Red No. 40“Allura Red”0.6C18H14N2O8S2 2 NaMW 496.42 g/moleAbsorbanceAbsorbanceMW 897.92 600650700400450500Wavelength (nm)5506000.8FD&C Yellow No. 6“Sunset Yellow”0.7C16H9N4O9S2 2 Na0.6C16H10N2O7S2 2 Na0.6MW 452.37 g/mole0.5AbsorbanceAbsorbanceMW 534.39 400700450500Wavelength (nm)0.60.7C37H34N2O9S3 2 Na0.6650700600650700FD&C Blue No. 2“Indigo Carmine”C16H8N2O8S2 2 NaMW 466.37 g/mole0.5AbsorbanceAbsorbance6000.8FD&C Blue No. 1“Brilliant Blue”MW 792.85 g/mole0.40.30.50.40.30.20.20.10.10400550Wavelength (nm)0.80.77000.8FD&C Yellow No. 5“Tartrazine”0.7400650Wavelength (nm)0450500550Wavelength (nm)600650700400450500550Wavelength (nm)
See promotions atthermofisher.com/uvpromosRequest a free trial atthermofisher.com/spec200freetrialLearn more at thermofisher.com/spec200 2019 Thermo Fisher Scientific Inc. All rights reserved. McCormick is a registered trademark of McCormick & Company. All othertrademarks are the property of Thermo Fisher Scientific and its subsidiaries. Specifications, terms and pricing are subject to change. Not allproducts are available in all countries. Please consult your local sales representative for details. FL53099 E 02/19MRequest a consult or quote atthermofisher.com/uvquote
1. Obtain about 5 mL of the blue colored drink. 2. Measure the absorbance of the drink at λ max for Blue Dye No. 1 and record it on the Lab Report. 3. Calculate the concentration of Blue No. 1 dye in the drink using the Beer's Law plot from Part 2. 4. Calculate the mass of dye present in a 20 oz (591 mL) bottle of the drink. 5.