Transcription
January 16, 2019Dear Senate and House Transportation Committee Leadership and Members:Please find attached the University of Washington’s research and development study regardingexpansion joint noise on WSDOT bridges. The Legislature provided funding to WSDOT in the2018 supplemental transportation budget to contract with the UW to study expansion jointnoise. The text, included in ESSB 6106, is as follows:Section 218 (3): 181,000 of the motor vehicle account state appropriation is providedsolely for the department, in coordination with the University of Washington departmentof mechanical engineering, to study measures to reduce noise impacts from bridgeexpansion joints. The study must examine testing methodologies and project timelinesand costs. A final report must be submitted to the transportation committees of thelegislature by October 15, 2018.The impetus for this funding was to help address community concerns raised regarding noisegenerated by bridge joints. In 2016, this concern was highlighted by the opening of the new SR520 floating bridge. At that time, WSDOT began investigations into the noise levels comingfrom the new bridge. In May 2017, WSDOT published a white paper including noisemeasurements, existing noise reduction measures built into the new bridge, potential pilotproject study options, and estimated costs to conduct a pilot project. The white paper also notedthat the SR 520 floating bridge meets all current state and FHWA criteria for noise abatement.WSDOT has over 50 bridges with modular expansion joints which allow bridge movementsfrom the low end of six inches to over four feet for the large SR 520 modular expansion joints.While the large modular expansion joints on SR 520 are quieter than similar expansion jointson the I-90 Floating Bridge, the intent of this research was to examine options to reduce noiseon modular expansion joints including those found on the SR 520 bridge. Please let me know ifyou have any questions.Sincerely,Roger Millar, PE, FASCE, FAICPSecretary of TransportationCC: Mark Gaines, WSDOT Bridge and Structures EngineerCody Elwell, University of Washington
Research ReportExpansion Joint NoiseModular Expansion Joint Noise MitigationStudyByPer G. Reinhall and Alexander G. SolowayDepartment of Mechanical EngineeringUniversity of WashingtonSeattle, Washington 98105-6698Prepared forThe State of WashingtonDepartment of TransportationJanuary 14, 2019
Table of Contents1Introduction . 12Background. 232.1Noise Generating Mechanisms . 22.2Noise Abatement Options . 3Experiment Description . 53.1Site Description . 53.2Existing Noise Abatement Measures . 73.3Residential Measurements October 18, 2018 . 73.4Bridge Measurements . 83.4.13.4.23.4.33.4.4456East Side Joint Measurements October 23, 2018 . 8West Side Joint Measurements November 1, 2018 . 8East Side Joint Measurements November 7, 2018 . 8West Side Joint Measurements November 8, 2018 . 9Methodology . 104.1Equipment Description . 104.2Data Processing . 11Results and Discussion . 125.1Residential Locations . 135.2Joint Measurements . 155.3Measurements Above and Below Expansion Joint . 185.4Directionality of Noise Above Joint . 205.5Tire Size Comparison . 225.6Sinus Plates . 245.7High-Speed Camera Measurements . 255.8Noise Abatement Options . 29Summary and Recommendations . 316.1Summary and Recommendations for SR520 Bridge. 316.2General Conclusions for All Modular Expansion Joint . 316.3General Recommendations. 32References . 33Appendix A.Tire Width Study. 34Appendix B.Golden Ears Bridge Maintenance Report . 45i
Table of FiguresFigure 3-1: West-side measurement site (map from Google Earth) . 6Figure 3-2: East-side measurement site (map from Google Earth). 6Figure 5-1: Overview of car-pass events using simultaneous noise and video recordings. Screen-shots from thevideo are attributed to specific parts of the noise recording using letters (A)-(I). . 13Figure 5-2: Equipment setup at (a) 2839 Evergreen Point Road, (B) 3221 Evergreen Point Road, and (C) view ofexpansion joint and sentinel on east side of bridge from 3221 Evergreen Point Road. . 14Figure 5-3: Average ESD of measurements collected at (a) 2839 Evergreen Point Road and (b) 3221 Evergreen PointRoad . 14Figure 5-4: (A) Schematic of equipment setup for the single receiver measurements at the large expansion jointson the east and west sides of the bridge, and (B) Equipment setup at the large expansion joint on the eastside of the floating bridge from the pedestrian walkway. . 16Figure 5-5: Spectral average of car pass events on October 23, 2018 and November 7, 2018 at the east sideexpansion joint (thick orange) and car pass events on November 1, 2018 and November 8, 2018 on the westside expansion joint (thin blue line). The background levels are also shown for both expansion joints. . 16Figure 5-6: Time series (blue) of a single car-pass event centered at 0.0 s and the time samples used for calculatingthe ESD of the background noise (red) . 17Figure 5-7: Equipment setup for simultaneous measurements collected above the expansion joint and in the jointcavity. . 18Figure 5-8: Equipment setup below the west-side large expansion joint with receivers east and west of the jointcavity. . 18Figure 5-9: Comparison of ESD for noise measured above the joint and below in the joint cavity for the (a) eastside joint and (b) the west side joint. . 19Figure 5-10: ESD of car-pass events measured below the west-side joint on the east and west side of the jointcavity. The west side of the joint cavity faces the transition span and has openings whereas the east side ofthe joint cavity is fully enclosed. These data are compared to the average ESD measured above the road andin the joint cavity. . 20Figure 5-11: Equipment setup for measurements on the east and west side of the large modular expansion joints. 21Figure 5-12: Measurements collected east and west of (a) the west-side large expansion joint with a receiver offsetof 10 m, (b) the west-side large expansion joint with a receiver offset of 20 m, and (c) the east-side largeexpansion joint with a receiver offset of 24 m. . 22Figure 5-13: ESD of individual car-pass events (blue) compared to the resonance frequency associated with the cartire width. The resonance frequencies determined by Eq.(2) that are associated range of tire widths(highlighted in magenta) were identified using the minimum and maximum tire widths from manufacturerspecifications of various body style and trim level. To provide a clearer relationship between the tire widthand peak ESD, the broadband spectra have also been smoothed using a Savitzky-Golay filter (orange) tohighlight the overall trend of the ESD. . 23Figure 5-14: Volume formed by car tires rolling over gap between center beam. Resonance frequency determinedby selecting L in Eq. (2) to be the width of the tire, Wt. . 24Figure 5-15: Average ESD of car pass events measured at the small expansion joint with sinus plates on the westapproach bridge compared to large expansion joints on east and west sides of the floating bridge . 25Figure 5-16 Frame from high-speed video recording of Toyota Prius front tire passing over east-side largeexpansion joint center beams. . 26Figure 5-17 Frame from high-speed video recording of a Scion sports car front tire passing over east-side largeexpansion joint center beams. . 26Figure 5-18 Frame from high-speed video recording of an SUV tire passing over east-side large expansion jointcenter beams. . 27ii
Figure 5-19 Frame from high-speed video recording of a Toyota Tundra front tire passing over east-side largeexpansion joint center beams. . 27Figure 5-20 Frame from high-speed video recording of a car-carrier truck front tire passing over east-side largeexpansion joint center beams. . 28Figure 5-21 Frame from high-speed video recording of a bus front tire passing over east-side large expansion jointcenter beams. . 28Figure 5-22: Average ESD for varying vehicle types (sedan, SUV, truck and bus) using data collected at the eastside large expansion joint on October 23, 2018 and November 7, 2018 and at the west-side large expansionjoint on November 1, 2018 and November 8, 2018. . 29Figure A-1: ESD of car pass events (blue) and ESD with Savitsky-Golay smoothing filter (orange) compared toresonance frequency calculated using Eq. (2). . 34Figure A-2: ESD of car pass events (blue) and ESD with Savitsky-Golay smoothing filter (orange) compared toresonance frequency calculated using Eq. (2) . 35Figure A-3: ESD of car pass events (blue) and ESD with Savitsky-Golay smoothing filter (orange) compared toresonance frequency calculated using Eq. (2) . 36Figure A-4: ESD of car pass events (blue) and ESD with Savitsky-Golay smoothing filter (orange) compared toresonance frequency calculated using Eq. (2) . 37Figure A-5: ESD of car pass events (blue) and ESD with Savitsky-Golay smoothing filter (orange) compared toresonance frequency calculated using Eq. (2) . 38Figure A-6: ESD of car pass events (blue) and ESD with Savitsky-Golay smoothing filter (orange) compared toresonance frequency calculated using Eq. (2) . 39Figure A-7: ESD of car pass events (blue) and ESD with Savitsky-Golay smoothing filter (orange) compared toresonance frequency calculated using Eq. (2) . 40Figure A-8: ESD of car pass events (blue) and ESD with Savitsky-Golay smoothing filter (orange) compared toresonance frequency calculated using Eq. (2) . 41Figure A-9: ESD of car pass events (blue) and ESD with Savitsky-Golay smoothing filter (orange) compared toresonance frequency calculated using Eq. (2) . 42Figure A-10: ESD of car pass events (blue) and ESD with Savitsky-Golay smoothing filter (orange) compared toresonance frequency calculated using Eq. (2) . 43Figure A-11: ESD of car pass events (blue) and ESD with Savitsky-Golay smoothing filter (orange) compared toresonance frequency calculated using Eq. (2) . 44iii
1 IntroductionThe noise created by vehicles driving over modular expansion joints is a nuisance to residents inseveral parts of the State of Washington, with the Washington State Department ofTransportation (WSDOT) receiving noise complaints from bridges throughout the state. Largeexpansion joints in particular have been problematic, such as those installed on the EvergreenPoint Floating Bridge (SR520 bridge). Shortly after opening in 2016, WSDOT started receivingnoise complaints relating to the large, 16 center beam, expansion joints on the east and westends.While several studies have investigated the noise from modular expansion joints, most havefocused on low frequency noise (below 200 Hz) radiated from the underside of the bridge [1]–[5]. Several technologies to reduce expansion joint noise are currently available, however theavailable literature on the subject does not discuss what noise mechanism(s) the mitigationoptions address nor their effectiveness. In this report the existing noise nuisance from the SR520bridge expansion joints is used as a case study to collect information on the noise from modularexpansion joints to better understand the noise generating mechanisms. Funding for this projectwas provided by the Washington State Legislature with 181,000 of the motor vehicle accountstate appropriation provided solely for WSDOT, in coordination with the University ofWashington department of mechanical engineering, to study measures to reduce noise impactsfrom bridge expansion joints. The primary goals of this report are Investigate the mechanism(s) responsible for the expansion joint noise including theirspectral characteristics and their point of origin.Summarize existing mitigation options for controlling noise from modular expansionjoints and consider each option within the context of the noise generating mechanismsthey address.Guide an investigation of the durability, cost, and effectiveness of a practical mitigationsolution with high potential to be implemented by WSDOT for existing or future bridges.In addition to these primary goals, specific recommendations on the SR520 bridge will bepresented including the origin of the noise that is the source of the noise complaints as well aspotential noise mitigation options. The process developed during this project andrecommendations in this report could be applied to other bridges that use modular expansionjoints.In the following report, background information will first be presented in Section 2 including asummary of noise abatement options and previous studies of expansion joint noise. Theexperimental description will then be provided in Section 3 followed by the methodology usedto analyze these data in Section 4. The Results from the experiments will be presented in Chapter5 along with a discussion on the results. Finally, a summary of the report with recommendationswill be presented in Chapter 6.1
2 Background2.1 Noise Generating MechanismsThe mechanisms responsible for the noise generated by cars passing over modular expansionjoints fall into two categories; noise emanating from the cavity below a modular expansion jointsand noise from the top of the joint [1]. The noise below the expansion joint will be presented firstas it is the focus of all but one of the previous expansion joint noise studies. These studies [1]–[5], have used numerical modelling, full scale models and existing modular expansion joints toshow that the impact of car tires on modular expansion joints cause the joint beams (both centerbeams and support beams) to vibrate. These vibrations then couple to acoustic modes of thejoint cavity with resonant frequencies below 200 Hz. One of the mechanisms responsible forexciting the center beams is referred to as the bar-pass frequency, 𝑓"# , which describes thefrequency at which the car tires strike the center beams. It is given by𝑓"# 𝑉𝑊( 𝑊"(1)Where 𝑉 is the velocity of the car (m/s), 𝑊( is the width of the gap between the center beams(m), and 𝑊" is the width of the center beam (m). A resonance is excited when this frequency isequal to the vibration response of a center beam.Compared to noise originating below the joint, comparatively little work has been devoted toinvestigating the noise from the top of the joint. One of the only studies addressing this topic isby Ravshanovich et. al [1] where noise up to 1000 from above and below the joint are compared.They also show that above 500 Hz sound levels from the top of the joint are significantly higherthan those measured below the joint. These data show that the noise above the joint has a centerfrequency (maximum value) of 700 Hz. The authors explain that this is caused by resonancesbeing excited in the gap formed by the rubber sealing and two adjacent center beams is coveredby the car tire. The authors present data from a “car” and “sedan” that show differences in thecenter (or maximum) frequency which they attribute to differences in the tire widths. Theauthors, unfortunately, do not discuss this relationship in detail nor do they provide detailedinformation on the study that led to this conclusion. The relation between tire width andresonance frequency can potentially be determined using an equation from Ver and Beranek forthe approximate resonance frequency in an arbitrary volume [6]𝑓* 𝑐2𝑊(2)Where 𝑓* is the resonance frequency (Hz), 𝑐 is the speed of sound in air (typically 340 m/s) and𝑊 is the largest dimension in the arbitrary volume. For this scenario, W is the width of the tire2
(typically in the range of 185 mm and 305 mm). The relation between the tire width and Eq. (2)will be discussed in Section 5.5.2.2 Noise Abatement OptionsExisting abatement options to reduce the expansion joint noise are summarized in Table 1. Thesetechnologies fall into one of two categories; low frequency mitigation options to reduce noiselevels below 400 Hz or high frequency options to reduce noise above 400 Hz. Noise barriers,which can reduce noise across a wide range of frequencies, can reduce noise both above andbelow 400 Hz; however, they are not effective in all situations and must provide line-of-sightcoverage to be effective [7]. As most of these existing solutions apply to specific frequencyranges, the selection of an appropriate noise mitigation method first requires the noise sourceand character of the noise (spectrum of noise) to be identified. It should also be note that whileHelmholtz resonators can be tuned to any frequency of interest, the study by Ancich [2] onlydiscusses frequencies below 200 Hz.3
Table 1: Summary of Noise Control OptionsNoise ControlNoise BarrierHelmholtzResonator in JointCavityInsulation BelowJoint CavityConcrete Enclosureof Joint Cavity(WSDOT Design)Sinusoidal/RhombusPlateFilling gaps betweenlamella beamsFrequencyRangeBroadband 200 Hz(tuned tospecificfrequencies) 400 Hz 400 Hz 400 Hz 400 HzStrength-mitigates noiseoriginating from top ofjoint- reduces broadbandnoise for receivers closeto the barrier- Can be tuned toresonance frequencies ofjoint vibration- attenuate noise atspecific, problematicfrequenciesWeakness- Must extend enough tocover noise source- Reduction less at longdistances- Can increase noise fromreflections- Cannot controlrefraction effects- Only reduce noise atspecific frequencies itstuned for- Reduce noise comingfrom bottom of joint- Can block noise fromwider range offrequencies thanHelmholtz resonator- Makes accessingunderside of joint moredifficult- same strength asinsulation below jointcavity- concrete has higherattenuation thaninsulating blanket- retrofitting existingbridge with concretecould be difficult- Reduces noise radiatingfrom top of the joint-reduces noise created bycar tires running overjoint gaps- Retrofitting existingjoints is difficult- Bolt-on, requires drillinginto center beam.Increased corrosion risk- Road would need to bere-graded to account forincreased height of joint- May limit mobility ofjoint- When installed properlyand in good condition,can reduce noise comingfrom top of joint- Easier than sinus platesto retrofit onto existingjoints- Durability is a concern- Has been tried onGolden Ears Bridge inVancouver, BC, Canada.Reduces noise butincreases maintenancerequiredReferenceCrocker [7]Ancich andBrown [3]MagebaROBO-MUTEWSDOTdesign onSR520 bridgeMagebaSinus PlateRavshanovichet. al. [1]4
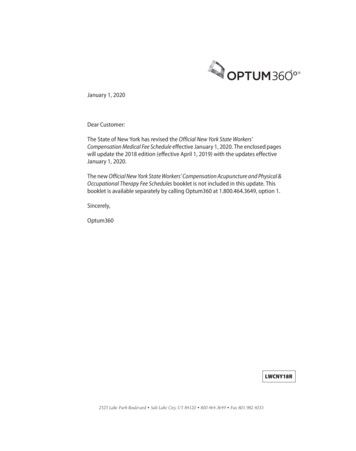
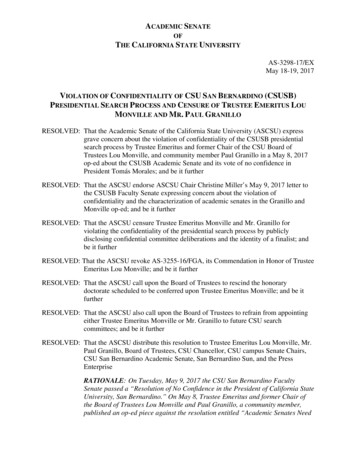
3 Experiment DescriptionMeasurement for this project were collected at two residential locations and at the SR520 bridgeover five site visits between October 2018 and November 2018. An overview of the experimentalsite will first be presented followed by a discussion of existing noise abatement currently installedon the SR520 bridge. Finally, a description of the experiments in chronological order will bepresented.3.1 Site DescriptionThe Evergreen Point Floating Bridge (SR520 bridge) is a 2349.6 m (7708.5 ft) long floating bridgethat spans Lake Washington and runs between the City of Seattle, WA on the west side and theCity of Medina, WA on the east side. The floating portion of the bridge connects to shore by fixedapproach bridges by way of short transition spans. Linking the transition spans to the floatingbridge are large modular expansion joints built by Mageba. These large expansion joints are thefocus of this study. It is bounded to the south by the Madison Park neighborhood of Seattle, tothe North by Union Bay and the Laurelhurst neighborhood, and to the east by the City of Medina.The westbound lane of the floating bridge includes shoulders with an inner width of 1.2 m (4 ft)and an outer width of 3 m (10 ft), two travel lanes and one high occupancy vehicle (HOV) lane.On the eastern end of the bridge, the HOV lane starts as two individual lanes that merge into asingle lane just past the large expansion joint. Bicycles and pedestrians can access the bridge bya 4.3 m (14 ft) shared use path is located adjacent to the westbound lane. The eastbound lane ofthe floating bridge includes shoulders with the same dimension as the westbound lane, and twostandard travel lanes. The eastbound lane on the east and west ends includes only a single HOVlane. All of the large expansion joints on the SR520 include 16 center (or lamella) beams. Small,seven center-beam expansion joints are also located on the west side of the bridge; several ofwhich are installed with noise reducing sinus plates.5
Figure 3-1: West-side measurement site (map from Google Earth)Figure 3-2: East-side measurement site (map from Google Earth)6
3.2 Existing Noise Abatement MeasuresThe design of the new bridge included three noise abatement features aimed at reducing theimpact of noise on nearby residences; quieter pavement surfaces, noise walls, and theencapsulation of the underside of the large modular expansion joints.To reduce the noise generated by cars driving over the bridge, grooved, noise-reducingpavements were installed on the bridge. These pavements have been shown to reduce road noiseat frequencies above 630 Hz [8]. The quiet pavements on the bridge result in reduced road-trafficnoise, which also lowers the overall ambient noise levels. As a result of these lower ambient noiselevels, the noise generated by cars running over the modular expansion joints is morepronounced. Although previous noise studies have shown the new modular expansion joints tobe quieter than those on the old bridge [9], the noise on the new bridge stands out morecompared to ambient levels.The noise walls are installed on the east side of the bridge on the north side of the westboundlane and on the south side of the eastbound lane. The walls start at Evergreen Point Road easton the approach bridge and terminate approximately 65 m (213 ft) from the large expansionjoints on the east end of the bridge. The noise walls include several small breaks to accommodatesmall expansion joints on the approach bridge and transition span. As the walls end before thelarge modular expansion joints, they do not provide shielding from the expansion joint noise forresidences adjacent to Lake Washington.The cavities below the large modular expansion joints are fully enclosed below and on the waterfacing side (west side of the cavity for east-side joints and east side of the cavity for the west sidejoints) however the land-facing side of the joint cavity (east side of the cavity for east-side jointsand west side of the cavity for the west side joints) is partially open to allow for unrestrictedbridge motion. This is an original design by WSDOT for the SR 520 ridge aimed at noise control.3.3 Residential Measurements October 18, 2018The first set of measurements were collected on October 18, 2018 at two residential locations inMedina, WA; 2839 Evergreen Point Road and 3221 Evergreen Point Road. Throughout thesemeasurements wind speed was negligible and sky conditions were mostly sunny. 2839 EvergreenPoint Road is located south of the large modular expansion joints on the east side of the bridge.Measurements were collected on the Brüel and Kjaer 2270 SLM from the west side of theproperty on the back porch of the house. The SLM was setup 3 m (9.8 ft) from the house with areceiver height of 1.5 m (4.9 ft). The direct line of sight between the bridge and the receivers wasblocked by trees, however the noise from the cars running over the large expansion joints wasstill clearly audible. Data were collected between 9:50 am and 10:00 am. Over the course of themeasurement, the noise from the joint increased and became more noticeable. This is potentiallydue to an increase in travel speed due to decreasing traffic volume.7
The second site, 3221 Evergreen Point Road, is located just north of the large modular expansionjoints on the east side of the bridge. Similar to the first site, the Brüel and Kjaer 2270 SLM wassetup on the west side of the property approximately 1
The study must examine testing methodologies and project timelines and costs. A final report must be submitted to the transportation committees of the . Figure 5-6: Time series (blue) of a single car-pass event centered at 0.0 s and the time samples used for calculating . Volume formed by car tires rolling over gap between center beam .