Transcription
te------------------6Amplitude Modulation (AM)OBJECTIVES 1. Demonstrate an amplitude-modulated carrier in the time domain for different modulationindexes and modulating frequencies.2. Determine the modulation index and percent modulation of an amplitude-modulatedcarrier from the time domain curve plot.Demonstratean amplitude-modulated carrier in the frequency domain for different3.modulation indexes and modulating frequencies.4. Compare the side-frequency voltage levels to the carrier voltage level in an amplitudemodulated carrier for different modulation indexes.5. Determine the signal bandwidth of an amplitude-modulated carrier for differentmodulating signal frequencies.6. Demonstrate how a complex modulating signal generates many side frequencies to formthe upper and lower sidebands. MATERIALSTwo function generatorsOne dual-trace oscilloscopeOne spectrum analyzerOne 1N4001 diodeOne dc voltage supplyOne 2.35 nF capacitorOne 1 mH inductorResistors: 100 fl, 2 kfl, 10 kfl, 20 kflTHEORY The primary purpose oia communications system is to transmit and receive informationsuch as audio, video, or binary data over a communications medium or channeL The basiccomponents in a communications system are the transmitter, communications medium orchannel, and the receiver. Possible communications media are wire cable, fiber opticcable, and free space. Before the information can be transmitted, it must be converted into71
an electrical signal compatible with the communications medium. This is the purpose of thetransmitter. The purpose of the receiver is to receive the transmitted signal from the channeland convert it back into its original information signal form. If the original electricalinformation signal is transmitted directly over the communications channel, it is calledbaseband transmission. An example of a communications system that uses basebandtransmission is the telephone system. Noise is defined as undesirable electrical energy that enters the communications system andinterferes with the transmitted message. All communications systems are subject to noise inboth the communication channel and the receiver. Channel noise comes from theatmosphere (lightning), outer space (radiation emitted by the sun and stars), and electricalequipment (electric motors and fluorescent lights). Receiver noise comes from electroniccomponents such as resistors and transistors, which generate noise due to thermal agitationof the atoms during electrical current flow. In some cases noise obliterates the message andin other cases it results in only partial interference. Although noise cannot be completelyeliminated, it can be reduced considerably.Often the original electrical information (baseband) signal is not compatible with thecommunications medium. In that case, this baseband signal is used to modulate a higherfrequency sine wave signal that is in a frequency spectrum that is compatible with thecommunications medium. This higher-frequency sine wave signal is called a carrier. Whenthe carrier frequency is in the electromagnetic spectrum it is called a radio frequency(RF) wave, and it radiates into space more efficiently and propagates a longer distance thana baseband signal. When information is transmitted over a fiber optic cable, the carrierfrequency is in the optical spectrum. The process of using a baseband signal to modulate acarrier is called broadband transmission.There are basically three ways to make a baseband signal modulate a sine wave carrier:amplitude modulation (AM), frequency modulation (FM), and phase modulation (PM). Inamplitude modulation (AM), the baseband information signal varies the amplitude of thehigher-frequency carrier. In frequency modulation (FM), the baseband information signalvaries the frequency of the higher-frequency carrier and the carrier amplitude remainsconstant. In phase modulation (PM), the baseband information signal varies the phase ofthe high-frequency carrier. Phase modulation (PM) is a different form of frequencymodulation and the carrier is similar in appearance to a frequency-modulated carrier.Therefore, both FM and PM are often referred to as angle modulation. In this experiment,you will examine the characteristics of amplitude modulation (AM).In amplitude modulation, the carrier frequency remains constant, but the instantaneous valueof the carrier amplitude varies in accordance with the amplitUde variations of the modulatingsignal. An imaginary line joining the peaks of the modulated carrier waveform, called theenvelope, is the same shape as the modulating signal with the zero reference ]ine coincidingwith the peak value of the unmodulated carrier. The relationship between the peak voltage ofthe modulating signal (V m) and the peak voltage of the unmodulated carrier (Vc) is the72
'f modulation index (m). Therefore,Vm ---1!!. Multiplying the modulation index (m) by 100 gives the percent modulation. When the peakvoltage of the modulating signal is equal to the peak voltage of the unmodulated carrier, thepercent modulation is 100%. An unmodulated carrier has a percent modulation of 0%. Whenthe peak voltage of the modulating signal (Vm) exceeds the peak voltage of the unmodulatedcarrier (Ve) overmodulation will occur, resulting in distortion of the modulating(baseband) signal when it is recovered from the modulated carrier. Therefore, it is importantthat the peak voltage of the modulating signal be equal to or less than the peak voltage of theunmodulated carrier (equal to or less than 100% modulation) with amplitude modulation.Often the percent modulation must be measured from the modulated carrier displayed on anoscilloscope. When the AM signal is displayed on an oscilloscope, the modulation index canbe computed fromwhere Vmax is the maximum peak-to-peak voltage of the modulated carrier and V min is theminimum peak-to-peak voltage of the modulated carrier. Notice that when V min 0, themodulation index (m) is equal to 1 (100% modulation), and when V min V max, themodulation index is equal to 0 (0% modulation).When a single-frequency sine wave amplitude modulates a carrier, the modulating processcauses two side frequencies to be generated above and below the carrier frequency by anamount equal to the modulating frequency (fm)' The upper side frequency (fUSF) and thelower side frequency (fLSF) can be determined fromandfLSF fe - fmA complex modulating signal, such as a square wave, consists of a fundamental sinewave frequency and many harmonics, causing many side frequencies to be generated. Thehighest upper side frequency and the lowest lower side frequency are determined bythe highest harmonic frequency (fm(max», and the highest lower side frequency and thelowest upper side frequency are determined by the lowest harmonic frequency (fm(min»' Theband of frequencies between (fe fm(min» and (fe fm(max» is called the upper sideband. Theband of fre uencies between (fe - fm(min» and (fe - fm(max» is called the lower sideband. Thedifference between the highest upper SI e equency e m(max).frequency (fe - fm(max» is the bandwidth occupied by the modulated carrier. Therefore, thebandwidth (BW) can be calculated fromBW (fe fm(max» - (fe - fm(max» 2 fm(max)I73
This bandwidth occupied by the modulated carrier is the reason a modulated carrier isreferred to as broadband transmission.The higher the modulating signal frequencies (meaning more information is beingtransmitted), the wider the modulated carrier bandwidth. This is the reason a video signaloccupies more bandwidth than an audio signal. Because signals transmitted on the samefrequency interfere with one another, this carrier bandwidth places a limit on the number ofmodulated carriers that can occupy a given communications channel. Also, when a carrier isovermodulated, the resulting distorted waveshape generates harmonics that generateadditional side frequencies. This causes the transmitted bandwidth to increase and interferewith other signals. This harmonic-generated sideband interference is called splatter. When an AM signal is observed on an oscilloscope, it is observed in the time domain(voltage as a function time). The time domain display gives no indication of sidebands. Inorder to observe the sidebands generated by a modulated carrier, the frequency spectrum ofthe modulated carrier must be displayed in the frequency domain (sine wave voltage levelsas a function of frequency) on a spectrum analyzer.A sine wave-modulated AM signal is a composite of a carrier and two side frequencies, andeach of these signals transmits power. The total power transmitted (P T) is the sum of thecarrier power (Pc) and the power in the two side frequencies (PUSF and P LSF). Therefore,P T Pc PUSF P LSFThe total power transmitted (P T) can also be determined from the modulation index (m)using the equationTherefore, the total power in the side frequencies (Ps F) isand the power in each side frequency isNotice that the power in the side frequencies depends on the modulation index (percentmodulation) and the carrier power does not depend on the modulation index. When thepercent modulation is 100% (m 1), the total side-frequency power (Ps F) is one-half of the74
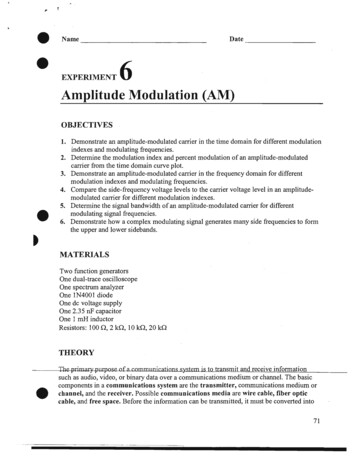
carrier power (Pc) and the power in each side frequency (PUSF and P LSF ) is one-quarter of thecarrier power (Pc). When the percent modulation is 0% (m 0), the total side-frequencypower (P SF) is zero because there are no side frequencies in an unmodulated carrier. Basedon these results, it is easy to conclude that an amplitude-modulated carrier has all of thetransmitted information in the sidebands and no information in the carrier. For 100%modulation, one-third of the total power transmitted is in the sidebands and two-thirds of thetotal power is wasted in the carrier, which contains no information. When a carrier ismodulated by a complex waveform, the combined modulation index of the fundamental andall of the harmonics determines the power in the sidebands. In a later experiment, you willsee how we can remove the carrier and transmit the same amount of information with lesspower.Because power is proportional to voltage squared, the voltage level ofthe side frequencies isequal to the square root of the side-frequency power. Therefore, the side-frequency voltagecan be calculated from222VUSF VLSF Vc (m42JThis means that the voltage of each side frequency is equal to one-half the carrier voltage for100% modulation of a sine-wave modulated carrier. When a carrier is modulated by acomplex waveform, the voltage of each side frequency can be calculated from the separatemodulation indexes of the fundamental and each harmonic. A circuit that mathematically multiplies a carrier and modulating (baseband) signal, and thenadds the carrier to the result, will produce an amplitude-modulated carrier. Therefore, thecircuit in Figure 6-1 will be used to demonstrate amplitude modulation. An oscilloscope hasbeen attached to the output to display the modulated carrier in the time domain. A spectrumanalyzer has been attached to the output to -Gi-splay the frequency spectrum of the amplitudemodulated carrier in the frequency domain .75
Figure 6-1Amplitude ModulationModulating SignalMULTIPLIERSUMMER OVCarrier1V 100kHzVcPROCEDUREStep 1Open circuit file FIG6-1. This circuit will demonstrate how mathematicalmultiplication ofa carrier and a modulating (baseband) signal, and then addingthe carrier to the mUltiplication result, will produce an amplitude-modulatedcarrier. Bring down the function generator enlargement and make sure that thefollowing settings are selected: Sine Wave, Freq 5 kHz, Ampl 1 V, Offset 0.Bring down the oscilloscope enlargement and make sure that the following settingsare selected: Time base (Scale 50 uslDiv, Xpos 0, Y/T), Ch A (Scale 1 VlDiv,Ypos 0, DC), Trigger (pos edge, Level 0, Auto). Note: In a hardwired laboratory, these steps should be perfonned using the modulator circuit inFigure 7-2, Experiment 7.Step 2Run the simulation to one full screen display, then pause the simulation. Notice thatyou have displayed an amplitude-modulated carrier curve plot on the oscilloscopescreen. Draw the curve plot in the space provided on page 77 and show theenvelope on the drawing 76
Step 3Based on the function generator amplitude (modulating sine wave voltage, Vm)and the voltage of the carrier sine wave (V c), calculate the expected modulationindex (m) and percent modulation.Step 4Determine the modulation index (m) and percent modulation from the curve plotin Step 2.Question: How did the value of the modulation index and percent modulation determinedfrom the curve plot compare with the expected value calculated in Step 3? Step 5Bring down the spectrum analyzer enlargement and make sure that the followingsettings are selected: Frequency (Center 100 kHz, Span 100 kHz), Amplitude(Lin, Range 0.2 VlDiv), Resolution 500 Hz.Step 6Run the simulation until the Resolution Frequencies match, then pause thesimulation. YOU have displayed the frequency spectrum for a modulated carner.Draw the spectral plot in the space provided on page 78 .77
.!! IiI. .--. -. ·········/·--··--l · -·· -· ··II-. --.-.-. i------. !--- '---"'--. -.-.---i ------ -.- - - !.- -.--- ------.-j--- .-.- . -.---.- - .-- -.-- . .--. -.-.--.- .Step 7Measure the carrier frequency (fe), the upper side frequency (fusF) , the lower sidefrequency (fLSF), and the voltage amplitude of each spectral line and record theanswers on the spectral plot.Questions: What was the frequency difference between the carrier frequency and eachof the side frequencies? How did this compare with the modulating signal frequency?How did the frequency of the center spectral line compare with the carrier frequency?How did the voltage amplitude ofthe center spectral line compare with the carrieramplitude?Step 8Calculate the expected bandwidth (BW) of th
One spectrum analyzer One 1N4001 diode One dc voltage supply One 2.35 nF capacitor One 1 mH inductor Resistors: 100 fl, 2 kfl, 10 kfl, 20 kfl THEORY The primary purpose oia communications system is to transmit and receive information such as audio, video, or binary data over a communications medium or channeL The basic components in a communications system are the transmitter, communications .