Transcription
Topographic Maps andCountoursAcademic Resource Center
Topography: The relief featuresor configuration of an area.*How do we measure it?
Contour Lines Contour lines, orisohypses,connect points ofequal elevation. Consider areceding waterlevel.
Contour Map Characteristics Index Contours areused to label theelevation of the theirassociated points. Bolded to facilitatereading of the map. Often occur in intervalsof five contour lines.
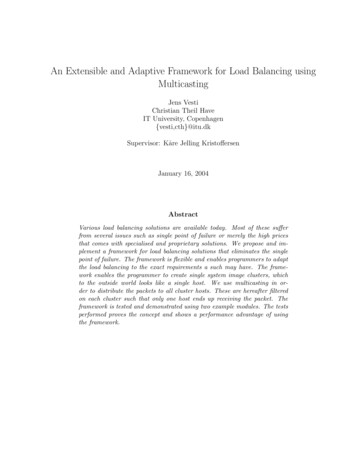
Contour Map Characteristics Contour Interval:Horizontal distancebetween twocontours Close together: Steepslope Far apart: GradualslopeGradual SlopeSteep Slope
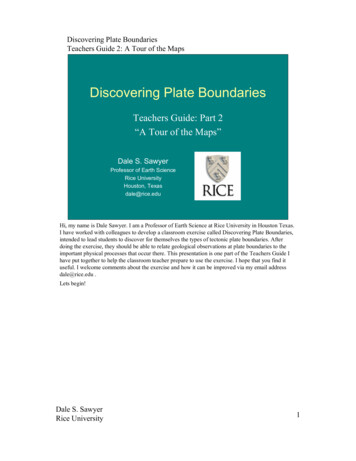
Contour Map Characteristics Valleys: Lines form a“V” pattern alongvalleys “Vs” point upstream;indicating thedirection of thestream flow. Streams always flowdownhill Contours can and docross streams
Contour Map Characteristics Concurrency: Contourlines never cross ordivide. Cliffs: May appear tomerge on vertical cliffs,but are stacked. Caves: May appear tocross in caves, but gounder one another.
Contour Map Characteristics Hills and knobs areshown as closed,concentric contours. Closed depressionsand basins are shownas closed contourswith hatches pointingdownslope.Hills:Depressions:
Contour Map Characteristics Other geologicfeatures commonlyexpressed by contourmaps include: DrumlinsSink HolesSand DunesVolcanosDissected PlateausRolling HillsFolds
Contour Map Generation In the field, pointsand their elevationsare measured usingautomatic levels,total stations, or GPSdevices Geotechnicalengineers use thesepoints to generatetopographic maps.
Contour Map Generation
Contour Map Generation Estimating Contour Intervals: Use an engineering scaleMeasure the distance between two pointsDivide the distance by the number of contoursMark the points along the interval
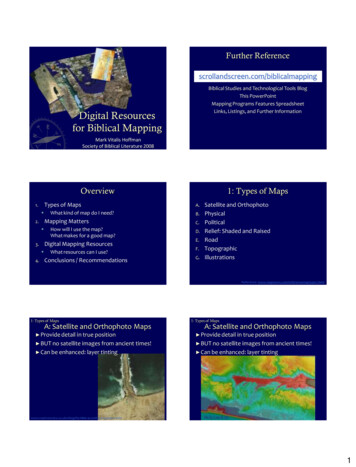
Contour Map Generation Example: Contours are to be placed every ten feet.d 300 feet There are to be three contourlines on this interval. Divide 300 feet by 3 to getone contour every 100 feet. Mark four points (two on theendpoints, and two between)and draw the contours.
Topographic Profiles Cross-sectional view of aportion of a topographic map. Used to demonstrate thevertical scale of landforms. Usually use an exaggeratedscale.
Topographic Profiles Generating profiles: Draw a line between the twopoints bounding the desiredprofile area. Place a folded sheet of paperalong the line. Mark each contour lineintersecting the paper. From each mark, indicate thevertical height with a dot on ascale. Connect the height dots with asmooth line.
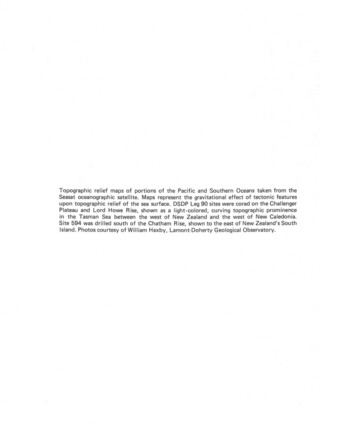
Other Mapping Methods Aerial Photography Extensive visual details Allow stereoscopicviewing Lack information aboutrock bodies, terrain, andother geologic features
Other Mapping Methods Landsat and Radar Earth ResourcesObservation System(EROS): satellite array Can see through cloudcover Can be enhanced withfalse color Used by Google Earth
Other Mapping Methods Computer Generated TerrainModels Store vast amounts of data Can be rendered fromLandsat and radar data Vertical scale can beexaggerated Reveals features that maynot be immediatelyapparent
Other Mapping Methods Geologic Maps Display different rock typesin an area Readily available on UnitedStates Geological Surveywebsites Usually lack elevationinformation
Questions?
Contour Map Characteristics Contour Interval: Horizontal distance between two contours Close together: Steep slope Far apart: Gradual slope Gradual Slope Steep Slope