Transcription
SOFTWARESECTOR REPORTQ2 2019
EXECUTIVE SUMMARYQ2 2019 Software» The global software sector remains one of the most active sectors, with 15Bn in financing volume and 39Bn in M&A volume during Q2 ’19- 198 financings in Q2 ‘19 is 19% higher than the number of financings in the same period in ’18- 359 M&A transactions in Q2 ‘19 is 5% higher than the 343 deals consummated during the same period in ’18- Q2 ‘19 M&A volume was bolstered by Salesforce’s 15Bn acquisition of Tableau Software resulting in a 22% M&A volume growth over Q2last year» Business / Productivity Software had one of the highest financing volume and deal counts in Q2 ‘19 led by the 500MM financing of Kaseya and 300MM financing of Carta; the Financial Software sector also saw a high volume of financings» Financial Software companies trade at the highest average revenue multiple at 11.5x EV/ ’19E Revenue compared to other software; theTechnical Applications sector trades at the highest average EBITDA multiple at 31.7x EV/ ’19E EBITDA compared to other software- Security software had the highest average 2019E/2018A revenue growth at 30% compared to other software- Development and Operations Management software stock performance outperformed other software sectors with LTM growth over 33%Select Q2 Active InvestorsNotes:Source: Pitchbook, 451 Research, Capital IQ.Select Q2 Active Strategic Buyers2
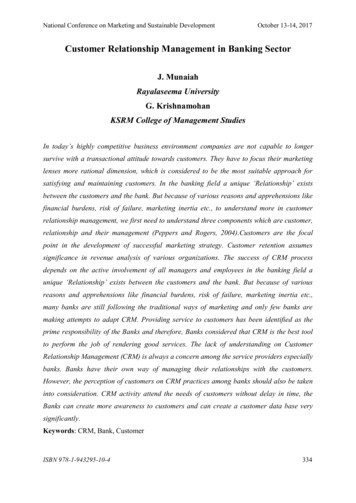
GCA OVERVIEWThe GCA Software TeamKEY GCA STATSSECTOR COVERAGEAI / Machine Learning21Offices GloballySenior Bankers CoveringSoftwareCRMCyberSecurity60Paul DiNardoRupert SadlerManaging DirectorManaging mBI / AnalyticsCollaboration Software25GCA US TEAMSenior Bankers CoveringTechnologyEnterprise Content ManagementJosh WepmanChris GoughManaging DirectorManaging evin WalshSaif MalikManaging al.comEnterprise Resource PlanningGlen Kruger60 Software Transactions inthe Last Three YearsTechnology-RelatedDeals in the Last 3 Yearsgkruger@gcaglobal.comMarketing TechnologySaaS / Cloud Enablement190 DirectorInfrastructure ManagementGCA EXECUTIVE TEAMTodd CarterSupply Chain ManagementGeoff caglobal.comVertically Focused Software3
GCA OVERVIEWDeep Software Sector ExpertiseNotes:The above transactions represent a compilation of past and current deals that GCA entities, including GCA Advisors, LLC, GCA Corporation and GCA Altium, have advised on. Generally, GCACorporation advises Asian-based transactions, while GCA Advisors, LLC advises U.S.-based transactions and GCA Altium advises UK/European-based transactions. At times, multiple GCAentities may be retained to advise on the same transaction.4
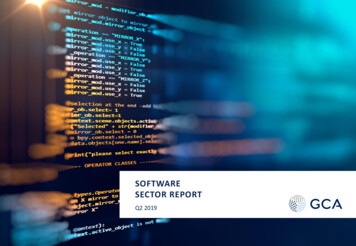
DEAL DASHBOARDSoftware 28.7 Billion399720 69.3 Billion2019 Financing Volume (1)(2)2019 Financing Transactions (1)(2)2019 M&A Transactions2019 M&A VolumeQuarterly M&A VolumeSelect M&A Transactions (3)Select Financing TransactionsCompanyQuarterly Financing Volume (1)(2)Amount ( MM) Bn BnAcquirer 23 1,100 12 575 11 12 17 15 14Q2'17 Q3'17 Q4'17 Q1'18 Q2'18 Q3'18 Q4'18 Q1'19 Q2'19160 159 161 155 167 200225 201198 5,744 39 13 19 4,400Q2'17 Q3'17 Q4'17 Q1'18 Q2'18 Q3'18 Q4'18 Q1'19 Q2'19Quarterly Financing Deal Count (1)(2)187 15,080 30 32 12 568 227EV ( MM) 57 14 15 20 500Target 82 2,600Quarterly M&A Deal Count343287 291 268 298 1,116363 375 361 359 1,000 200 425 165Q2'17 Q3'17 Q4'17 Q1'18 Q2'18 Q3'18 Q4'18 Q1'19 Q2'19 350Q2'17 Q3'17 Q4'17 Q1'18 Q2'18 Q3'18 Q4'18 Q1'19 Q2'19Last 12 Months Software Price Performance vs. S&P 500 (4)25%SPXM&A EV/ NTM Rev. Over Time (5)All x(5%)3.0x(10%)2.0x(15%)1.0x(20%)Jun-18Strategic BuyersPE Buyers 3.8x2.2x0.0xJul-18Aug-18Sep-18Oct-18Nov-18 Dec-18Jan-19 Feb-19Mar-19 Apr-19 May-19 Jun-192011201220132014Notes:Sources: Capital IQ, PitchBook, 451 Research and Dow Jones VentureSource. Market Data as of 6/30/2019.1)Criteria based on software series A and subsequent rounds of global financings greater than or equal to 20MM.2)Financings include Software Venture and Private Equity Growth / Expansion activity.3)Software M&A transactions reflect select transactions in 2019 YTD. M&A metrics are based on closed and announced transactions.4)iShares North American Tech-Software ETF (IGV), used as proxy for software landscape. Top holdings in the ETF include ADBE, MSFT, ORCL, CRM, and INTU.5)Criteria based on global public target software M&A deals.201520162017201820195
SOFTWARE PUBLIC COMPANY LANDSCAPESub Sector Top Players and Key Operating StatsPlatformInfrastructureSecurityCombined Market Cap: 1,862Bn19/18 Rev. Growth: 3.5%19 EBITDA Margin: 30.8%Combined Market Cap: 108Bn19/18 Rev. Growth: 13.0%19 EBITDA Margin: 15.5%Combined Market Cap: 186Bn19/18 Rev. Growth: 22.3%19 EBITDA Margin: 14.3%Content & Storage ManagementBI & AnalyticsFinancial ApplicationsCombined Market Cap: 236Bn19/18 Rev. Growth: 20.5%19 EBITDA Margin: 13.1%Combined Market Cap: 41Bn19/18 Rev. Growth: 29.6%19 EBITDA Margin: 12.3%Combined Market Cap: 263Bn19/18 Rev. Growth: 14.5%19 EBITDA Margin: 22.4%Notes:Sources: Capital IQ. Market Data as of 7/24/19.Logos shown represent largest players in each sub sector by enterprise value. Operating stats for each sector represent full list of companies shown in public comparable tables.6
SOFTWARE PUBLIC COMPANY LANDSCAPESub Sector Top Players and Key Operating StatsTechnical ApplicationsVerticalERP & General BusinessCombined Market Cap: 162Bn19/18 Rev. Growth: 13.6%19 EBITDA Margin: 32.8%Combined Market Cap: 229Bn19/18 Rev. Growth: 11.3%19 EBITDA Margin: 20.3%Combined Market Cap: 351Bn19/18 Rev. Growth: 19.2%19 EBITDA Margin: 15.5%Development & OperationsSales & MarketingSaaSCombined Market Cap: 249Bn19/18 Rev. Growth: 21.3%19 EBITDA Margin: 14.0%Combined Market Cap: 21Bn19/18 Rev. Growth: 17.6%19 EBITDA Margin: 4.2%Combined Market Cap: 768Bn19/18 Rev. Growth: 29.7%19 EBITDA Margin: 14.0%Notes:Sources: Capital IQ. Market Data as of 7/24/19.Logos shown represent largest players in each sub sector by enterprise value. Operating stats for each sector represent full list of companies shown in public comparable tables.7
RECENT STOCK PERFORMANCEIndex PerformanceLast 12 8Nov-18Jan-19Mar-19May-19Jul-191) Development andOperationsManagement2) Vertical3) ERP & GeneralBusiness4) BusinessIntelligence& Analysis5) SaaS6) Platform7) FinancialApplications8) Sales & Marketing9) TechnicalApplications10) Security11) Content &StorageManagement12) 5.2%23.1%22.2%4.5%1.9%Notes:Sources: Capital IQ. Market Data as of 7/15/2019.List of companies in each sector can be found in the public comparable tables.8
TRADING COMPARABLESValuation and Operational MetricsEV / 2019E RevenueEV / 2019E EBITDA31.7xMedian: 7.9x11.5x9.9x9.4x9.2xMedian: 3x7.3x6.5x6.4x15.0x5.1x12.1x3.8x2019E / 2018E Revenue GrowthMedian: 18.4%29.6%22.3%21.3%20.5%30.8%Median: 14.9%22.4%19.2%17.6%14.5%20.3%15.5%13.6%11.1x2019E EBITDA %12.3%11.3%3.5%Notes:Sources: Capital IQ. Market Data as of 7/24/19.Figures represent mean values of respective comp groups.List of companies in each sector can be found in the public comparable tables.4.2%9
PUBLIC COMPANY VALUATIONSSoftware Trading Statistics( MM)Trading MetricsCompanyStock PriceMarketCash &TotalEnterprise7/24/2019CapST. Invest.DebtValue (EV)Operating MetricsEV / RevenueCY18ACY19EEV / EBITDACY20ECY18ACY19ERevenue GrowthCY20E18A/17A19E/18AGross Margin20E/19ECY18ACY19EEBITDA t Corporation 85,947 %65%42%44%44%Cisco Systems 140.72 1,075,523 57.23 244,986 133,819 34,643 23,709 6%36%36%Oracle Corporation 58.11 193,844 37,827 56,397 %47%47%48%International Business Machines Corporation 150.03 133,023 46,273 78,304 %24%25%SAP SE 127.26 151,909 6,338 2,064 5%36%36%Dell Technologies Inc. 56.22 43,335 9,040 55,078 2%13%Hewlett Packard Enterprise Company 14.74 19,739 3,585 12,581 62%62%62%35%36%36%InfrastructureInfrastructureZoom Video Communications 95.94 26,139 737 52 Akamai Technologies 83.42 13,689 1,119 1,279 %41%42%Citrix Systems 100.72 13,260 563 943 %36%36%RingCentral 124.94 10,237 549 407 13%Juniper Networks 27.15 9,348 2,800 1,958 %21%22%Amdocs Limited 64.00 8,776 450 0 % 148.67 8,939 986 0 37%Verint Systems Inc. 57.64 3,791 453 903 %24%25%Everbridge 99.55 3,278 258 112 5%Five9 48.46 2,892 299 217 %18%Presidio 13.95 1,154 29 940 8%Fastly 22.00 1,995 67 52 (10%)Software Aktiengesellschaft 28.47 2,106 589 425 %28%27% 7.25 861 157 181 dware Ltd. 25.01 1,174 313 21 3%17%A10 Networks 7.55 571 123 6 ight Networks 2.34 272 29 3 %68%69%17%13%14%F5 NetworksExtreme NetworksNotes:Sources: Capital IQ and Wall Street Estimates. Market Data as of 7/24/19.Margins (20%) considered NM. Multiples 0 or 50 considered NM.10
PUBLIC COMPANY VALUATIONSSoftware Trading Statistics( MM)Trading MetricsCompanyStock PriceMarketCash &TotalEnterprise7/24/2019CapST. Invest.DebtValue (EV)Operating MetricsEV / RevenueCY18ACY19EEV / EBITDACY20ECY18ACY19ERevenue GrowthCY20E18A/17A19E/18AGross Margin20E/19ECY18ACY19EEBITDA MarginCY20ECY18ACY19ECY20ESecurityVeriSign 216.84 25,844 1,225 1,795 %71%72%72%Palo Alto Networks 225.02 21,596 3,048 1,573 %27%26%27%CrowdStrike Holdings 87.46 17,929 175 0 (8%)Symantec Corporation 22.69 14,027 2,043 4,452 %45%Check Point Software Technologies Ltd. 113.25 17,241 1,615 0 %51%51%Okta 137.02 15,639 547 435 9%)(2%) 86.58 14,784 1,802 39 %25%26%27%FortinetSecurityZscaler 86.69 10,894 353 0 12%Proofpoint 127.19 7,128 183 57 17%CyberArk Software Ltd. 144.86 5,467 466 0 88%29%27%27%Trend Micro Incorporated 44.78 6,217 1,417 0 3%33%FireEye 15.85 3,331 1,130 1,064 %14%16%Qualys 88.81 3,478 298 42 9%40%39%39%Rapid7 64.56 3,112 251 199 Mimecast Limited 48.33 2,985 174 138 16%19%Sophos Group plc 5.46 2,645 172 300 %15%17%24%Tenable Holdings 31.32 3,022 299 11 %)(8%)Varonis Systems 70.51 2,133 164 56 lPoint Technologies Holdings 22.02 1,953 86 43 0%Forescout Technologies 39.68 1,795 127 42 %Carbon Black 18.69 1,337 153 19 %)SecureWorks Corp. 12.51 1,020 111 28 9371.8x1.7x1.6xNMNMNM11%4%7%53%56%56%2%0%2%Tufin Software Technologies Ltd. 22.76 738 26 15 Zix Corporation 8.97 486 17 179 %21%24%OneSpan Inc. 15.90 638 75 7 10%14%F-Secure Oyj 3.04 480 29 53 %11%Absolute Software Corporation 5.85 243 35 0 %78%14%14%16%MeanMedianNotes:Sources: Capital IQ and Wall Street Estimates. Market Data as of 7/24/19.Margins (20%) considered NM. Multiples 0 or 50 considered NM.11
PUBLIC COMPANY VALUATIONSSoftware Trading Statistics( MM)Trading MetricsCompanyStock PriceMarketCash &TotalEnterprise7/24/2019CapST. Invest.DebtValue (EV)EV / RevenueCY18ACY19EOperating MetricsEV / EBITDACY20ECY18ACY19ERevenue GrowthCY20E18A/17A19E/18AGross Margin20E/19ECY18ACY19EEBITDA MarginCY20ECY18
Last 12 Months Software Price Performance vs. S&P 500 (4) M&A EV/ NTM Rev. Over Time (5) Financing Activity by Quarter 69.3 Billion 2019 Financing Volume (1)(2) 2019 M&A Volume 28.7 Billion 2019 Financing Transactions (1)(2) 2019 M&A Transactions 399 720 160 159 161 155 167 187 225 201 198 Q2'17 Q3'17 Q4'17 Q1'18 Q2'18 Q3'18 Q4'18 Q1'19 Q2'19 12 11 12 15 14 17 23 14 15