Transcription
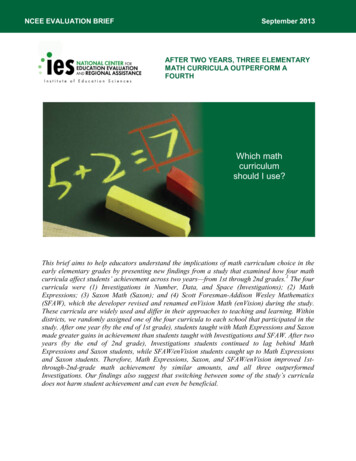
NCEE EVALUATION BRIEFSeptember 2013AFTER TWO YEARS, THREE ELEMENTARYMATH CURRICULA OUTPERFORM AFOURTHWhich mathcurriculumshould I use?This brief aims to help educators understand the implications of math curriculum choice in theearly elementary grades by presenting new findings from a study that examined how four mathcurricula affect students’ achievement across two years—from 1st through 2nd grades. 1 The fourcurricula were (1) Investigations in Number, Data, and Space (Investigations); (2) MathExpressions; (3) Saxon Math (Saxon); and (4) Scott Foresman-Addison Wesley Mathematics(SFAW), which the developer revised and renamed enVision Math (enVision) during the study.These curricula are widely used and differ in their approaches to teaching and learning. Withindistricts, we randomly assigned one of the four curricula to each school that participated in thestudy. After one year (by the end of 1st grade), students taught with Math Expressions and Saxonmade greater gains in achievement than students taught with Investigations and SFAW. After twoyears (by the end of 2nd grade), Investigations students continued to lag behind MathExpressions and Saxon students, while SFAW/enVision students caught up to Math Expressionsand Saxon students. Therefore, Math Expressions, Saxon, and SFAW/enVision improved 1stthrough-2nd-grade math achievement by similar amounts, and all three outperformedInvestigations. Our findings also suggest that switching between some of the study’s curriculadoes not harm student achievement and can even be beneficial.
2AFTER TWO YEARS, THREE ELEMENTARY MATH CURRICULA OUTPERFORM A FOURTHThe selection of a math curriculum affects the nature of mathematics instruction and,ultimately, the opportunities for students to learn mathematics. According to the NationalResearch Council (2001), “Opportunity to learn is widely considered the single most importantpredictor of student achievement.” Research confirms this important connection betweencurricula and achievement. For example, at the elementary level, previous findings issued by thisstudy indicate that some curricula improve the average student’s percentile rank in math by asmuch as 12 points more than other curricula during the first year of implementation (Agodini etal. 2009, 2010).The choice of curriculum is particularly critical for elementary schools because they tend touse one math curriculum in several grades, thus affecting students for multiple years. However,little is known about how these curricula affect students over time. This is a key issue becausecurricula differ in important ways that could have implications for students’ learning over timeand, therefore, their effects may differ from those found after a single year. For example,differences between curricula in the sequencing of concepts, the extent of review of previouslylearned skills, or the alignment with student assessments in different grades could lead toachievement effects that vary from year to year. Also, some curricula place higher cognitivedemands on students, by having them figure out important mathematical ideas that typically arenot immediately apparent. This practice helps students develop conceptual understanding ofmath that could improve gradually over several years (Hiebert and Grouws 2007). Finally, somecurricula are clearer about the objectives of the lessons and provide better teacher supports forimplementing the lessons (Stein and Kaufman 2010), which could in turn lead to differing effectsacross years and grades.To help educators more fully understand this issue, we expand on previous findings fromthis study by examining how four math curricula affect students’ achievement across twoyears—from 1st through 2nd grades: (1) Investigations in Number, Data, and Space(Investigations); (2) Math Expressions; (3) Saxon Math (Saxon); and (4) Scott ForesmanAddison Wesley Mathematics (SFAW), which the developer revised and renamed enVisionMath (enVision) during the study. 2 These curricula are widely used in the early elementarygrades 3 and, as described below, differ in their approaches to mathematics instruction.When making curricular decisions, it is important to consider not only the potential effectsof the new curriculum, but also the implications of switching from one curriculum to another.Because many districts make their own curricular decisions, and some districts let schoolschoose their own curriculum, students who move from one district or school to another couldswitch curricula. This issue is of particular concern for disadvantaged students, who are morelikely to transfer between schools (Rumberger 2003). Switching curricula also could be an issuefor students who do not transfer between schools because many districts review their elementarymath curriculum every several years and often adopt a new one at that time, resulting in a largefraction of students experiencing more than one math curriculum during their elementary years. 4For example, California, Florida, and Texas are among 22 states with a textbook adoptionprocess that every six years or so determines a selection of math texts that districts can purchasewith state funds, and districts in these states tend to follow this curriculum adoption schedule. 5Our study also provides evidence that helps educators understand the effects on studentachievement of switching from one curriculum to another.NCEE EVALUATION BRIEF
AFTER TWO YEARS, THREE ELEMENTARY MATH CURRICULA OUTPERFORM A FOURTH3This brief addresses three questions:1. Do some of the study’s curricula improve 1st-through-2nd-grade student mathachievement more than others?2. How do these curriculum-group differences in achievement after two years (by theend of 2nd grade) compare with the curriculum-group differences after one year (bythe end of 1st grade)?3. How does switching curricula (instead of staying with the same one) affect studentachievement during the first year a new curriculum is used?In the remainder of this brief, we provide an overview of the study design, including theselection, description, and assignment of study curricula. Next, we examine curriculumimplementation to place the student achievement effects in context. We then present our findingson the achievement effects of elementary math curricula after one and two years, along with theeffects of switching curricula. Finally, we conclude with a discussion and suggestions for futureresearch.Study DesignTo set up the study, we (1) selected the curricula to be included, (2) documented the keyways in which the programs differ, and (3) randomly assigned the curricula to schools thatagreed to participate in the study.Selecting the CurriculaWe used a competitive process to choose our curricula. Developers and publishers of mathcurricula for early elementary school were invited to submit proposals to have their curriculaincluded in the evaluation. The goal of this process was to select curricula that represented variedapproaches to instruction and learning and were likely to improve student achievement morethan other curricula. To meet this objective, we used six criteria to review the submissions: (1)research support for the curriculum’s conceptual framework, (2) empirical evidence ofeffectiveness, (3) teacher practices and skills that comprise the curriculum, (4) quality of trainingand materials, (5) institutional capacity to train the number of teachers in the study, and (6)appropriateness of the curriculum for early elementary students in Title I schools. Anindependent panel of experts in math and math instruction reviewed the submissions andrecommended curricula they believed were suitable for the study. In-person meetings were heldwith publishers whose curricula were considered strong candidates, after which IES selected thefour curricula mentioned above. 6Important Differences Between the CurriculaTo summarize the differences between the curricula, we conducted a comparative analysisthat was framed using research on effective mathematics instruction. This research has found thatthree aspects of curricula are likely to have a strong influence on instruction (that could affectstudent achievement): (1) mathematical emphasis, (2) instructional approach, and (3) supportsfor teachers. 7 For each aspect, our review of curriculum materials revealed substantial variationacross the four curricula, as expected. Below is a summary of the differences, and more detail isprovided in the appendix.NCEE 2013-4019
4AFTER TWO YEARS, THREE ELEMENTARY MATH CURRICULA OUTPERFORM A FOURTHMathematical emphasis concerns the kinds of mathematics that students had opportunitiesto learn and how those opportunities were structured. To assess this feature, including the waysin which the curricula address conceptual understanding and procedural fluency, we examinedthree components: (1) the cognitive demand of the tasks 8; (2) regular routines that provideopportunities for engagement with concepts, facts, and procedures; and (3) repeated practice ofskills and procedures to develop procedural fluency. 9 Cognitive demand refers to the extent towhich the mathematics tasks involved connections between concepts, procedures, and facts andprovided potential opportunities to struggle with mathematics. 10 High-demand tasks areintellectually and conceptually challenging, whereas low-demand tasks focus on routine andprocedural elements without connections to concepts.As Table 1 shows, nearly all (95 percent) of Investigations’ and Math Expressions’ tasks arehigh demand, compared with 65 percent for Saxon and 57 percent for SFAW/enVision. Lookingat daily routines and use of repeated practice, we found that Saxon and, to a lesser extent, MathExpressions both emphasize procedural fluency more than Investigations and SFAW/enVisiondo.Table 1. Summary of Key Curriculum DifferencesInvestigationsMath ExpressionsSaxonSFAW/enVisionCognitive Demand of thePrimary Tasks in EachCurriculumDM – 40%PWC – 55%PWOC – 5%M – 0%DM – 30%PWC – 65%PWOC – 0%M – 5%DM – 0%PWC - 65%PWOC – 35%M – 0%DM – 0%PWC – 57%PWOC – 40%M – 3%Frequency and Length ofthe RoutineDaily10 minutesDaily5-10 minutesDaily20 minutesOptionalLength UnspecifiedFrequency and Length ofRepeated PracticeRegularlya10 minutesDaily5-10 minutesDaily10-15 minutesOptionalLength UnspecifiedTeacher’s RoleFacilitate studentproduction of ideasExplain, model, facilitateproduction of ideasExplain,demonstrate, guideExplain,demonstrate, guideClassroom extBetween students andteacherFrom teacher to students,andbetween studentsFrom teacher tostudentsFrom text tostudentsMathematical EmphasisInstructional ApproachPathway for LearningSupports for TeachersEXPLICIT: Fullyscripted lesson;DESCRIPTIVE:detailed descriptionHow the Text GuidesMinimal descriptionof teacher actionsTeachersof teacher actionsand roomarrangementsNote:The technical appendix further details the curriculum differences; DM doing mathematics, PWC procedures withconnections, PWOC procedures without connections, and M memorization. DM and PWC are high-demand tasks;PWOC and M are low-demand tasks.BLEND: Descriptivescripts guide teacheractions, with selectiveexplicit scripts containingexact words to useBLEND: Detaileddescriptive scripts andexplicit guidance ofteacher actions (rarelyscripts teacher’s words)aRepeated practice in Investigations occurs at regular intervals at least once a week, but does not necessarily occur daily.Instructional approach refers to the teacher’s role during instruction, the types of activitiesin which students are expected to engage, and the nature of the classroom interactions.Investigations, Math Expressions, and Saxon have students and teachers interact with oneanother as they work on activities and concepts (Table 1). Investigations and Math ExpressionsNCEE EVALUATION BRIEF
AFTER TWO YEARS, THREE ELEMENTARY MATH CURRICULA OUTPERFORM A FOURTH5also emphasize student-to-student interactions and provide opportunities for students to worktogether and communicate their mathematics knowledge. With SFAW/enVision, in contrast, thepredominant classroom interaction is between the student and the worksheet, workbook, or othercurriculum materials.Supports for teachers concern the types of implementation guidance provided to teachers,including how each curriculum provides guidance and the topics of the guidance. The curriculaprovide guidance through either explicit scripts, descriptive scripts, or both. Explicit scriptsspecify what teachers should say. Descriptive scripts guide teachers’ and students’ actions ordialogue by describing what should be said, written, visually demonstrated, or done; or byproviding both explicit and descriptive scripts. The topics of the guidance can include directingteachers’ actions, helping teachers understand student thinking, providing subject-specificcontent support, and clarifying curriculum designers’ rationale or intent.Investigations blends descriptions of teacher actions with selective explicit scripts ofquestions the teacher should ask or ways to respond to students (Table 1). Math Expressions iseven more detailed in its descriptive script but less frequently specifies what the teacher shouldsay. Unlike the other three, Saxon provides a fully scripted lesson containing almost everythingthe teacher should say, along with a detailed descriptive script. SFAW/enVision’s guidance ismore minimal and general than that of the other curricula.In terms of topics, both Investigations and Math Expressions provide guidance on a varietyof teaching components, including mathematical concepts, student thinking, and ways to adapt alesson for specific students. SFAW/enVision provides guidance on few topics, as does Saxon,which primarily focuses on classroom organization and management.Assigning the Curricula to SchoolsAfter selecting the curricula, we recruited schools to participate in the study. A total of 111schools from twelve districts enrolled in the study and agreed to participate for at least oneyear. 11 Of the 111 schools, 58 agreed to participate for a second year; the analyses presented inthis brief are based on the 58 schools (from seven districts) that participated for two years.Though not a representative sample of all elementary schools in the United States, the 58schools included in these analyses are dispersed geographically and in areas with various levelsof urbanicity. The participating schools also serve a higher percentage of students eligible forfree or reduced-price meals than the average U.S. elementary school.At the outset of the study, we randomly assigned one curriculum to each school. The randomassignment ensures that the four curriculum groups are similar in other ways and, therefore, anydifferences in classroom practices and student achievement can be attributed to differences in theeffect of the curricula. The random assignment was conducted separately in each district, so eachdistrict implemented all four curricula. After random assignment, we introduced the school staffto the publishers of their assigned curriculum. Publishers then worked with the schools to delivercurriculum materials before the school year began and to schedule training for teachers.NCEE 2013-4019
6AFTER TWO YEARS, THREE ELEMENTARY MATH CURRICULA OUTPERFORM A FOURTHHow Teachers Implemented Their School’s Assigned CurriculumThe differences between the curricula described above indicate how they differ whenimplemented as intended. But teachers and publishers may not always implement the curriculaperfectly, which could influence the effect of the curricula on student achievement. To help shedlight on this important issue, we analyzed implementation data collected by the study teamthrough teacher surveys and classroom observations.The survey data indicated that nearly all teachers (at least 96 percent) in each curriculumgroup used their assigned program as their core curriculum. In addition, at least 70 percent of theteachers implemented a majority of the curriculum features as intended. 12 According to thesurvey data, the amount of time spent on math instruction did not differ across the curriculumgroups among 1st-grade teachers. In 2nd grade, however, Saxon teachers spent one more hourper week on math instruction than did teachers using the other three curricula (6.1 hours versus5.1 hours). 13 The appendix presents more information about implementation based on the surveydata.Our classroom observation data show how well teachers implemented three aspects of theinstructional approaches underlying the curricula, including the way teachers question students,respond to student answers, and guide practice. For each of these aspects, our observation datacontain two to three related measures.For these aspects of the instructional approach, we found that teachers did what wasexpected for their assigned curriculum, with only two unexpected findings, both of whichinvolve Math Expression, Saxon, and SFAW/enVision. First, based on our review of thecurriculum materials, we expected Math Expressions teachers to ask fewer closed-endedquestions and more open-ended questions than Saxon and SFAW/enVision teachers, but theclassroom observation data do not show these patterns. Instead, as shown in Table 2, all threegroups (Math Expressions, Saxon, and SFAW/enVision) asked similar numbers of closed-endedquestions, and Math Expressions teachers asked as many or fewer open-ended questionscompared with Saxon and SFAW/enVision teachers. Second, we expected Math Expressionsteachers to be less likely than Saxon and SFAW/enVision teachers to immediately indicatewhether a student’s answer was correct; instead, all three groups were equally likely to respondin this manner. 14Curriculum EffectsTo measure the effects of the curricula, we administered the math assessment from the EarlyChildhood Longitudinal Study-Kindergarten (ECLS-K) Class of 1998–1999 study. The ECLS-Kassessment is an individually administered, adaptive, and nationally normed test that measuresstudent achievement both within and across grades and meets accepted standards of validity andreliability (Rock and Pollack 2002). 15 The assessment includes both open-ended and multiplechoice questions designed to measure conceptual understanding, procedural knowledge, andproblem solving in five math content areas: (1) number sense, properties, and operations; (2)measurement; (3) geometry and spatial sense; (4) data analysis, statistics, and probability; and(5) patterns, algebra, and functions. 16NCEE EVALUATION BRIEF
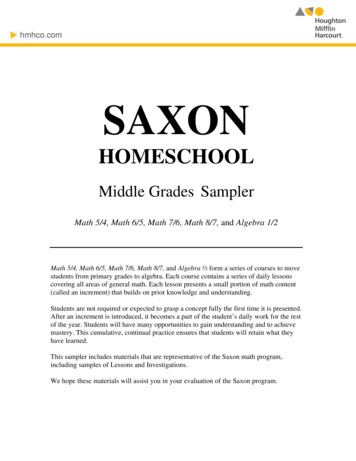
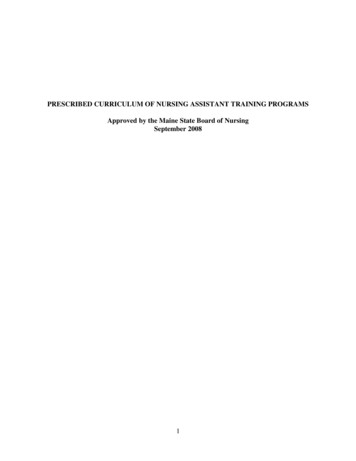
AFTER TWO YEARS, THREE ELEMENTARY MATH CURRICULA OUTPERFORM A FOURTH7Table 2. Implementation of Three Aspects of the Curricula in First- and Second-Grade Study Classrooms17(average number of times each behavior occurred during one day of math /envisionTeacher asks closed-ended questions for whichonly one answer is acceptable18.220.121.020.4Teacher poses open-ended questions that havemore than one correct answer9.64.37.64.8Teacher probes for reasoning or justification inresponse to student work/answer6.84.93.54.7Teacher repeats student answer in a neutral waywithout indicating correctness4.20.31.21.6Teacher states whether student answer is correctwithout elaborating16.919.820.218.7Number of problems on which the teacher guidedpractice5.26.810.811.6Number of problems focused on review ofpreviously learned material2.66.015.34.4Observation Item1.2.3.Teacher QuestionsTeacher Responses to Student AnswersTypes of PracticeNote:The classroom observations were conducted by the study team using a protocol designed to distinguish differencesbetween the curricula. The observation included an entire day of math instruction, including the math lesson and anymorning meeting or calendar time, and the behaviors in the table had a possible range of 0 to 21. The appendixfurther details the observation effort. All measures differ significantly across the curriculum groups at the 5 percentlevel of confidence. Statistics are based on 334 classroom observations conducted in 1st- and 2nd-gradeclassrooms.Two years of a curriculum. Among students who were taught using their school’s assignedcurriculum for two years (in the 1st and 2nd grades), Math Expressions, Saxon, andSFAW/enVision improved math achievement by similar amounts. All three improved mathachievement more than Investigations by statistically significant amounts (Figure 1). 18Specifically, after being taught with their school’s assigned curriculum in 1st and 2nd grade,Math Expressions, Saxon, and SFAW/enVision students had an average spring 2nd-grade ECLSK math score of 69.4, compared with 65.5 for Investigations students. Dividing this nearly 4point difference by the 18-point standard deviation of the second-grade score indicates that MathExpressions, Saxon, and SFAW/enVision students scored an average of 0.22 standard deviationshigher on the ECLS-K math test than Investigations students. This 0.22 difference (also knownas an “effect size”) means that a study student at the 50th percentile in math would score 9percentile points higher as a result of being taught in 1st and 2nd grade with Math Expressions,Saxon, or SFAW/enVision instead of with Investigations. 19One year of a curriculum. Using the same set of districts and schools that participated inthe study for two years, we examined the one-year effects students experienced by the end of 1stgrade (Figure 1). The comparison of one- and two-year effects helps us understand whether thedifferent teaching and learning approaches underlying the four curricula have implications forstudents’ learning over time. 20NCEE 2013-4019
8AFTER TWO YEARS, THREE ELEMENTARY MATH CURRICULA OUTPERFORM A FOURTHFigure 1. Math Expressions, Saxon, and SFAW/enVision improved 1st-through-2nd-grade mathachievement by similar amounts, and all three outperformed Investigations1st GradeInvestigations2nd Grade53.565.5Math 540455069.25560657075Average Spring ECLS-K Math ScoreNote:The students included in this analysis entered the study at the beginning of 1st grade, at which point their school wasrandomly assigned to use one of the study’s four curricula. The starting point of 35 for the horizontal axis representsaverage math achievement of students at the beginning of 1st grade—that is, when they entered the study. Thestandard deviations of the spring 1st and 2nd grade scores equal 17 and 18, respectively.After one year (by the end of 1st grade), the achievement differences betweenInvestigations, Math Expressions, and Saxon students were similar to the differences after twoyears (by the end of 2nd grade). In contrast, after one year, SFAW students scored 2.2 pointslower than Math Expressions students on the ECLS-K test—a difference that is statisticallysignificant. Dividing this 2.2 point difference by the 17-point standard deviation of the 1st-gradescore indicates that SFAW students scored an average of 0.13 standard deviations, or 5 percentilepoints lower than Math Expressions students. But, after the second year, achievement of SFAWand Math Expressions students was nearly equal. The effectiveness of SFAW/enVision thereforeincreased as study students gained experience with this curriculum. 21Switching curricula. Among the 111 schools that agreed to participate in the study for atleast one year, 71 implemented their assigned curriculum in the 2nd grade during the first year ofthe study. Nearly all of these schools also implemented their curriculum in the 1st grade duringthe first study year. Our evidence about the effects of switching curricula is based on secondgraders in 37 of the 71 schools because these 37 schools reported using either Saxon or SFAWbefore the study. As such, the year before the study, the first graders in those schools were taughtwith either Saxon or SFAW. The next year, when these schools entered the study, they wererandomly assigned to either continue using their pre-study curriculum (Saxon or SFAW), orswitch to one of the other study curricula. As a result, the second graders in those schools eithercontinued to be taught with one of the study’s curricula (Saxon or SFAW) or were taught with adifferent curriculum in the 2nd grade. We compared 2nd-grade achievement of students who didand did not switch from Saxon or SFAW to another study curriculum after 1st grade, tounderstand how switching curricula affects students during the first year a new curriculum isused. The appendix provides more details about these analyses. 22NCEE EVALUATION BRIEF
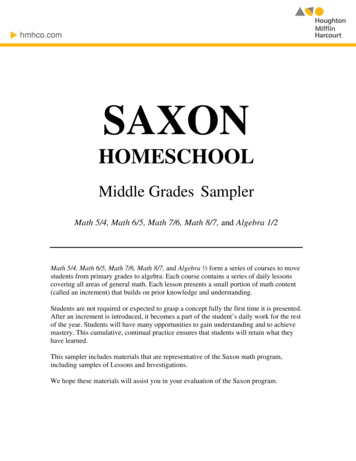
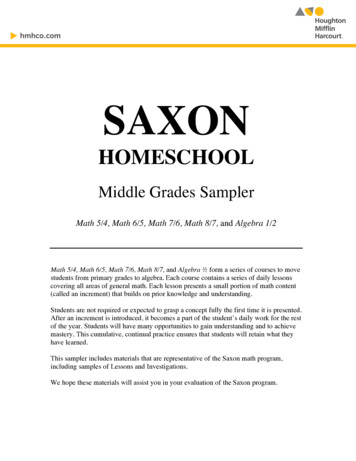
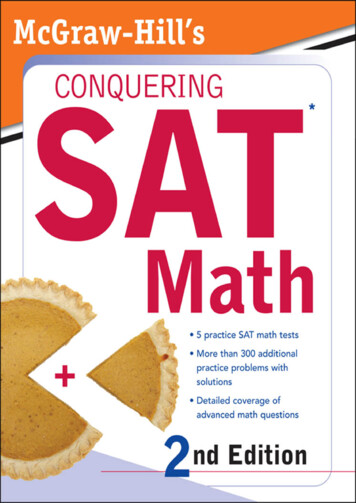
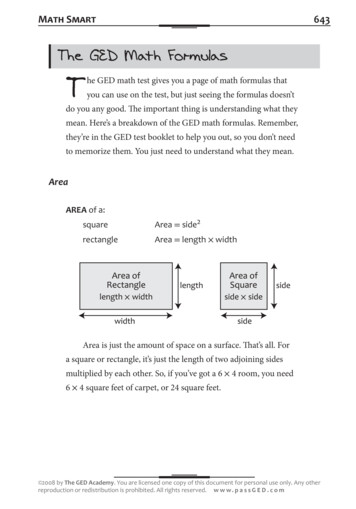
AFTER TWO YEARS, THREE ELEMENTARY MATH CURRICULA OUTPERFORM A FOURTH9This evidence suggests that switching between some of the study’s curricula does not harmstudent achievement and can even be beneficial. Students in the 7 schools who switched fromSFAW to Saxon after 1st grade had an average 2nd-grade math score of 73.6, compared with68.4 for those (in 6 schools) who stayed with SFAW—a difference that is statistically significant(Figure 2). This effect is equivalent to moving a study student from the 50th to the 64thpercentile in math achievement. The other types of switching we examined had no effect onstudent math achievement. Students in the 12 schools who switched from SFAW toInvestigations or Math Expressions after 1st grade had similar 2nd-grade math scores: 68.4 forthose who stayed in SFAW and 69.4 for those who switched to Investigations or MathExpressions (Figure 2). Similarly, students using Saxon for an additional year rather thanswitching to another curriculum had similar 2nd-grade math scores: 70.9 for students in 3schools who stayed with Saxon versus 70.4 for students in 9 schools who switched to anothercurriculum (Figure 3). 23Figure 2. Average 2nd-Grade Math Achievement: Students Who Stayed with SFAW Through 2ndGrade and Those Who Switched to Another Study Curriculum After 1st GradeSFAW in 1st and 2nd Grades68.4SFAW in 1st Grade; Investigations in 2nd69.4SFAW in 1st Grade; Math Expressions in 2nd69.4SFAW in 1st Grade; Saxon in 2nd73.65560657075Average Spring 2nd-Grade ECLS-K Math ScoreNote:The students included in this analysis entered the study at the beginning of 2nd grade, at which point their schoolwas randomly assigned to either continue using SFAW (their pre-study curriculum) or switch to another studycurriculum. The starting point of 55 for the horizontal axis represents average math achievement of students at thebeginning of 2nd grade—that is, when they entered the study. The standard deviation of the spring 2nd-grade scoreequals 15. The difference in average math achievement of students who stayed with SFAW through 2nd gradeversus those who switched to Saxon after 1st grade is statistically significant at the 5 percent level; all otherdifferences between students who stayed with SFAW versus those who switched are not significant.NCEE 2013-4019
10AFTER TWO YEARS, THREE ELEMENTARY MATH CURRICULA OUTPERFORM A FOURTHFigure 3. Average 2nd-Grade Math Achievement: Students Who Stayed with Saxon Through 2ndGrade and Those Who Switched to Another Study Curriculum After 1st GradeSaxon in 1st and 2nd Grades70.5Saxon in 1st Grade; Investigations in 2nd69.2Saxon in 1st Grade; Math Expressions in 2nd70.6Saxon in 1st Grade; SFAW in 2nd70.65560657075Average Spring 2nd-Grade ECLS-K Math ScoreNote:The students included in this analysis entered the study at the beginning of 2nd grade, at which point their schoolwas randomly assigned to either continue using Saxon (their pre-study curriculum) or switch to another studycurriculum. The starting point of 55 for the horizontal axis represents average math achievement of students at thebeginning of 2nd grade—that is, when they entered the study. The standard deviation of the spring 2nd-grade scoreequals 15. There were no statistically significant differences (at the 5 percent level) between the four groups.Discussion and Looking AheadMany policymakers and education experts agree on the need for education reform and arefocusing much of their attention on approaches to improving school governance, staffing, andcontent standards. Some research suggests that these approaches may have promise forincreasing student achievement, but other studies show that an entirely different approach—changing a school’s curriculum—could lead to larger increases in student achievement at a muchlower cost (Whitehurst 2009).In our study, one of the first to rigorously examine curriculum effects over multiple years,we compared the two-year effects of four math curricula that are widely used in the earlyelementary grades and differ in their approaches to teaching mathematics. Our results indicatethat Math Expressions, Saxon, and SFAW/enVision improved 1st-through-2nd-grade mathachievement by similar amounts, and all three outperformed Investigations.Although these results help confirm that curricula can be an effective policy lever forimproving student achievement in math, educators need at least three more pieces of informationto help them use this lever successfully. First, researchers should look at the impacts of curriculaon other assessments of student achievement that, like the one administered in this study, weredesigned to measure knowledge and skills that mathematicians and math educators feel areimportant for students to develop in early elementary school. 24 Given that about 44 states intendto implement new math assessments in response to the adoption of the Common Core StateStandards, it is important to know how the curricula affect these new accountability assessments.NCEE EVALUATION BRIEF
AFTER TWO YEARS, THREE ELEMENTARY MATH CURRICULA OUTPERFORM A FOURTH11Second, researchers should examine curriculum effects beyond two years, along with theeffects on students in other grades and subjects. The findings from this research may also beuseful for certain states that limit the
years (by the end of 2nd grade), Investigations students continued to lagbehind Math Expressions and Saxon studen, while SFAW/enVision students caught up to Math Expressions ts and Saxon students. Therefore, Math Expressions, Saxon, and SFAW/enVision improved 1st-through-2nd-grade math a