Transcription
THE WORLD’s TOP 100AEROSPACE & DEFENCECOMPANIES2012September 2012 Copyright Candesic Ltd 2012. All rights reserved
CANDESIC TOP 100 AEROSPACE & DEFENCECOMPANIES 2012FACTS & FIGURESConsolidation at the top of the industry pyramid has slowed downTotal A&D revenues of the top 100 A&D companies in the world amounted to 681Bn in 2011.This is only 17% more than five years ago in 2007 but 71% more than nine years ago in 2003.This reflects a slowdown in the industry consolidation process, at least at the top of the “industrypyramid”. Indeed, between 2008 and 2011, only three M&A transactions within the top 100companies took place, to be compared with eleven transactions during the preceding four-yearperiod (2004-2007):Nevertheless, some consolidation did occur, primarily at the bottom and in the middle of theindustry pyramid (below 5Bn revenues), but not as much as one might expect. In fact, overall,the industry has become less concentrated, with the top 10 players accounting for only 53% of thetotal top 100 A&D revenues in 2011, down from 57% five years earlier and 60% nine years earlier.In 2011, 80% of the total top 100 A&D revenues were accounted for by the top 34 companies,while in 2003, it was accounted for by the top 25 companies only.The recently announced takeover of Goodrich by United Technologies will be the first M&Atransaction involving two of the top 20 players in the world since the creation of EADS in 2000(and in the US since the merger between AlliedSignal and Honeywell in 1999), and may trigger anew wave of consolidation among the large “tier one” aerospace suppliers. Copyright Candesic Ltd 2012. All rights reserved
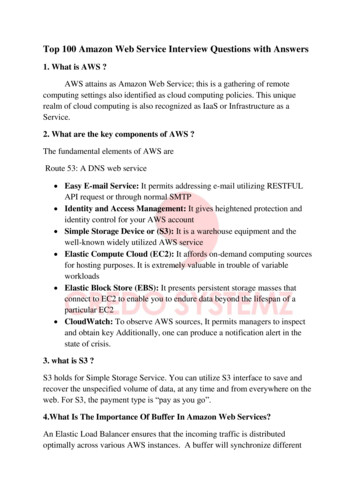
2003 Top 100 A&D Industry Pyramid2011 Top 100 A&D Industry Pyramid(number of companies by revenue bracket)(number of companies by revenue bracket)575961217 20Bn 10-20Bn 5-10Bn1939 2-5Bn 1-2Bn4730 1Bn4Revenue growth has also slowed downThe average revenue growth of the top 100 A&D players has slowed down significantly as wellover the last five years. It was 33% between 2007 and 2011 (6% CAGR) compared to 65%between 2003 and 2007 (12% CAGR).CAGR)Companies within the Topop 100 which have experienced the biggest increase in their A&Drevenues between 2003 and 2011 include Triumph (461%), Mantech (309%), Precision Castparts(299%), Meggitt (258%), Harris (254%), Hindustan Aeronautics (253%), Zodiac Aerospace(212%), Esterline Technologies (206%), BE Aerospace (301%) and L-3L 3 Communications (200%).(200%)The firms that have progressed the most significantly in the rankings over the 2003-20112003periodare Harris (from 44 to 26), Precision Castparts (from 52 to 33), Triumph (from 77 to 43),4 Mantech(from 66 to 47), BE Aerospace (from 75 to 55)5 and Meggitt (from 84 to 64). Moog (from 100 to 78),7Ultra Electronics (from 98 to 85)8and Esterline Technologies (from 83 to 74)7have alsoimpressively progressed up the rankings.Interestingly, most of these fast-growingfastcompanies are positioned similarly in the valuevachain, asmajor tier 1 or tier 2 “merchant”merchant” suppliers and have also been typically very profitable over the lastdecade. This suggests a kind of “sweet spot” in the industry pyramid where well positioned andambitious players can enjoy the benefits of both sustained growth and profitability. Copyright Candesic Ltd 2012. All rights reserved
Three Chinese companies, two spin-offs and one consulting firm are newcomers in 2011Among the newcomers for 2011 (compared to 2007) are two recent US spin-offs: HuntingtonIngalls (out of Northrop Grumman) and Exelis (out of ITT). Additionally, we have decided toinclude for the first time three public subsidiaries of China’s state enterprise AVIC, as well asconsulting services firm Booz Allen Hamilton which has become a much more specialized defenceservices player (more than 50% of their revenues) since the spin-off of its commercial consultingarm.The industry, while still dominated by North American and West European companies, isbecoming more globalThe industry is still dominated by North America and Western Europe, with respectively 46 and 34companies in the Top 100, but an increasing number of countries outside these two regions arerepresented in the Top 100.In 2011, eight countries outside Western Europe and North America had players (20 of them) inthe Top 100: Japan (5), Russia (3), China (3), India (2), Israel (3), Singapore (2), South Korea (1)and Brazil (1). Turkey might soon join the list, with Aselsan and Turkish Aerospace Industries nowjust outside the Top 100. This rewards the significant investments made by these countries intheir A&D industry over the last 10 to 20 years. Nevertheless, while their number is increasing(from 15 in 2007), their share of revenues is still marginal: 9% (up from 6% in 2007), to becompared with 57% and 34% for North American and West European players respectively.Within Western Europe, the most represented countries are the U.K. (ten companies), followed byFrance and Germany (seven each, eight including EADS), and Italy (three). Spain has only onecompany left – Navantia - in the Top 100 (two if one takes into account the Spanish share inEADS), as Indra and ITP, which used to be in the Top 100, are currently out of it. Copyright Candesic Ltd 2012. All rights reserved
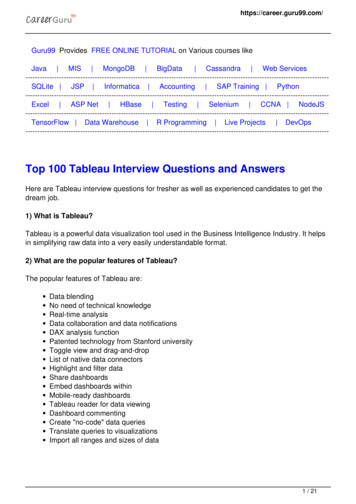
2011 Top 100 A&D Companies by Region(number of companies)3%North America3% 1%Western Europe13%46%34%Asia (South East and FarEast)Middle East and EasternAsiaRussiaBrazil2011 Top 100 A&D Companies by Region(aggregated sales)North America1%1% 2%Western Europe5%Asia (South East and FarEast)34%57%Middle East and EasternAsiaRussiaBrazilThe industry leadership is very stable, with only one change in the top 10The top 3 A&D companies have not changed over the last nine years: Boeing has remained thelargest in the world with 69Bn of sales, followed very closely by EADS ( 68Bn) and, relatively farbehind, Lockheed Martin ( 46Bn). BAE Systems is currently the fifth largest A&D company in theworld but even further behind, generating only 40% of Boeing’s or EADS’ revenues. Only onechanged occured in 2011 in the Top 5: Northrop Grumman has been replaced by GeneralDynamics as the fourth largest player following its divestiture of Huntington Ingalls.In the Top 10, nine players have remained the same throughout the last decade: Boeing, EADS,Lockheed Martin, BAE Systems, Northrop Grumman, General Dynamics, Raytheon, UnitedTechnologies and General Electric. The “new kid on the block” is Finmeccanica which climbedinto the top 10 following its acquisition of DRS Technologies, replacing Thales. Copyright Candesic Ltd 2012. All rights reserved
2011 A&D Sales: World's Top 20(USD 00Among institutional and financial investors, BlackRock is the most active, being a majorshareholder (i.e. holding more than 5% of the capital) in 30 of the top 100 A&D companiesBlackrock and State Street Bank are by far the most active institutional investors in the A&Dsector. Only accounting for companies where they own more than 5% of the capital, Blackrock isa major shareholder in thirty of the top 100 A&D companies. On aggregate, it owns the equivalentthof 22Bn in sales, which, if it was an industrial group, would make it the 9 largest A&D player inthe world.State Street Bank is a major shareholder in only seven companies but, on aggregate, owns moreththan 26Bn worth of sales, which would make it the 7 largest A&D player in the world. This isdue to particularly high stakes held in large players like Boeing, Lockheed Martin, NorthropGrumman or United Technologies.The French Government is also a major and influential shareholder in five companies (EADS,Thales, Safran, DCNS, Nexter) for the equivalent of a combined sales amount of 28.2Bn, whichthmakes it in essence the 6 largest A&D player in the world.Other governments with significant shareholdings in top 100 A&D companies include Russia(three companies, 6.8Bn in aggregate sales), Italy (two, 7.3Bn), Spain (two, 5.9Bn), Israel (two, 5Bn in sales), China (three, 3.5Bn) and India (two, 3.8Bn).Private equity ownership of leading A&D companies has become pervasiveSeven of the top 100 A&D companies are currently owned by private equity funds: Avio by Cinven,SR Technics by Mubadala Development Company, Hawker Beechcraft by Goldman Sachs andOnex, Fokker Technologies by Arle Capital (formerly Candover) and Booz Allen Hamilton, Arinc Copyright Candesic Ltd 2012. All rights reserved
and Sequa by The Carlyle Group. The Carlyle Group thus confirms its leadership among privateequity firms involved in the A&D industry, having also owned major stakes in several other top 100A&D companies in the past, including Vought Aircraft Industries (sold to Triumph), Avio (sold toCinven), Howmet (now part of Alcoa), United Defense (sold to BAE Systems) and Qinetiq.Other top 100 companies having been under private equity ownership in the past include L-3Communications, Spirit Aerosystems, MTU Aeroengines and Transdigm. This confirms the rolethat private equity firms can play as catalysts for corporate transformation or industryconsolidation.Meanwhile, only three companies are still privately owned by the founding family and are all to befound in Germany: Diehl (Diehl family), Krauss Maffei Wegmann (Bode family) and Liebherr(Liebherr family).The balance between commercial and defence revenues is stableThe split between commercial and defence revenues has been remarkably stable since 2003, with59% of the aggregated revenues of the top 100 A&D companies coming from defence /government customers and 41% coming from commercial customers. The average defence –commercial split is 57%-43%.There are 27 “pure play” defence companies (with defence and government revenues accountingfor at least 95% of their total A&D revenues), but only 13 “pure play” commercial companies (withcommercial revenues accounting for at least 95% of their total A&D revenues).While Lockheed Martin is the largest defence company by far with about 50% more defence salesthan its nearest follower Boeing ( 46Bn vs. 31Bn), EADS is also by far the largest commercialaerospace company with 36% more commercial revenues than its nearest follower, Boeing( 52Bn vs 38Bn). Copyright Candesic Ltd 2012. All rights reserved
The level of specialization among the top 100 A&D companies is high and has beenincreasing slightlyOn average, A&D sales account for 76% of the total sales of the companies in the Top 100; thisshows a fairly high level of specialization among the top players. This figure is slightly up from72% in 2003. For fifty eight of the companies, A&D sales account for more than 90% of their totalsales. Not surprisingly, the level of specialization is higher at the top of the pyramid (84% for thetop 30) than at the bottom (70% for the bottom 50).On the other end of the spectrum, for twelve companies in the Top 100, Aerospace & Defencesales represent less than 20% of the total enterprise’s sales: Volvo (2%), ThyssenKrupp (3%), FujiHeavy Industries (5%), Mitsubishi Electric (6%), Eaton (10%), General Electric (13%), Liebherr(13%), Alcoa (14%), Navistar (14%), Kawasaki Heavy Industries (16%), Parker Hannifin (16%),and Mitsubishi Heavy Industries (18%).Aircraft manufacturing and Services are the largest sub-sectorsIn 2011, “Aircraft Manufacturing” (design and integration of complete aircraft, including UAVs) and“Services” (including MRO / aftermarket, aircraft services, IT & cybersecurity, training & simulation,technical services ) were the two largest sub-sectors in terms of revenues, each representingaround 26% of all top 100 A&D revenues. The figure has been stable over the last nine years for“aircraft manufacturing”, while the share of “services” is significantly up, from around 18% in 2003.This increase is mainly due to the development of outsourced defence services, in particular in theUnited States, but it is also partially due to a reclassification as “service” revenues of somerevenues which were historically not captured as such (e.g. aftermarket revenues), thus reflectingthe increased importance of services in the industry and the emergence of dedicated businessunits within companies to support “services” growth. Underlying this trend is the acknowledgementthat new business models are needed to complement and sometimes replace traditional“platform-centric” business models in order to find new growth engines and to compete moreeffectively with new manufacturing players from countries such as China, India, Brazil or SouthKorea. It is worth mentioning that a big chunk of “Services” revenues (around one third) isessentially a captive MRO business for aircraft equipment OEMs and airlines.The third largest sub-sector is “Aircraft Sub-Systems and Components” (including aircraft engines,avionics, aerostructures, materials ), representing 18% of all A&D revenues in 2011. This figurehas been stable over the last nine years. Copyright Candesic Ltd 2012. All rights reserved
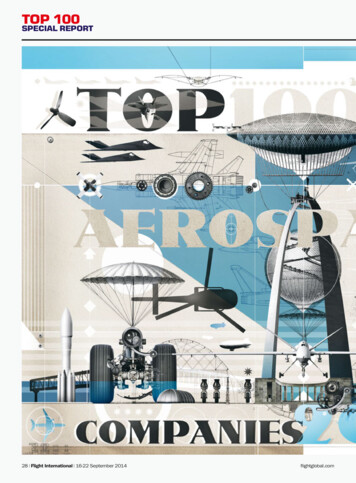
Next comes “Defence Electronics & Communications” with 12% of total sales, slightly down from14% in 2003. Other declining sectors have been “Weapon Systems & Ammunitions” (5%, downfrom 7% in 2003) and “Space” (4% down from 7%). “Naval Systems” (shipbuilding) has remainedrelatively stable around 4% while the share of “Land Systems” (vehicles and equipment) hasincreased from 2% in 2003 up to 3.5% in 2011.Security revenues (excluding cybersecurity – which is included in IT services) are still verymarginal among top A&D players, accounting for around 1% of all revenues. Only a fewcompanies (such as BAE Systems, Safran, Thales, L-3 Communications, ST Engineering, Saaband Alliant Techsystems) have developed a significant security business.2011 Top 100 A&D Revenues by Sub-SectorAircraft Manufacturing4%4% 1%Services4%5%26%12%Aircraft Sub-Systems andComponentsDefence Electronics &CommunicationsWeapon Systems &AmmunitionsSpaceNaval Systems18%26%Land SystemsSecurity Copy
CANDESIC TOP 100 AEROSPACE & DEFENCE COMPANIES 2012 FACTS & FIGURES Consolidation at the top of the industry pyramid has slowed down Total A&D revenues of the top 100 A&D companies in the world amounted to 681Bn in 2011. This is only 17% more than five years ago in 2007 but 71% more than nine years ago in 2003.