Transcription
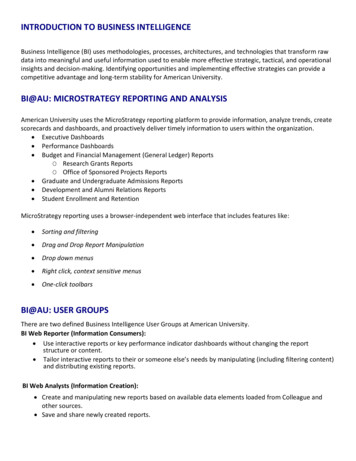
INTRODUCTION TO BUSINESS INTELLIGENCEBusiness Intelligence (BI) uses methodologies, processes, architectures, and technologies that transform rawdata into meaningful and useful information used to enable more effective strategic, tactical, and operationalinsights and decision-making. Identifying opportunities and implementing effective strategies can provide acompetitive advantage and long-term stability for American University.BI@AU: MICROSTRATEGY REPORTING AND ANALYSISAmerican University uses the MicroStrategy reporting platform to provide information, analyze trends, createscorecards and dashboards, and proactively deliver timely information to users within the organization. Executive Dashboards Performance Dashboards Budget and Financial Management (General Ledger) ReportsO Research Grants ReportsO Office of Sponsored Projects Reports Graduate and Undergraduate Admissions Reports Development and Alumni Relations Reports Student Enrollment and RetentionMicroStrategy reporting uses a browser-independent web interface that includes features like: Sorting and filtering Drag and Drop Report Manipulation Drop down menus Right click, context sensitive menus One-click toolbarsBI@AU: USER GROUPSThere are two defined Business Intelligence User Groups at American University.BI Web Reporter (Information Consumers): Use interactive reports or key performance indicator dashboards without changing the reportstructure or content. Tailor interactive reports to their or someone else’s needs by manipulating (including filtering content)and distributing existing reports.BI Web Analysts (Information Creation): Create and manipulating new reports based on available data elements loaded from Colleague andother sources. Save and share newly created reports.
DATA1. SOURCE SYSTEMS (COLLEAGUE, RECRUIT, ETC.)Source systems store the data that is captured about the University and it’s operations. These systems may bedatabases or mainframes, but they are optimized to process the recording of data. The Ellucian Colleaguesystem is the primary data source for BI Reporting at American University.2. EXTRACT, TRANSFORMATION, AND LOADData is pulled from the source system(s) on a nightly basis to load into our reporting database. After beingextracted, we also transform data from Colleague and other data sources to create additional informationsuch as a student’s Primary Academic Program or Retention Cohort.3. ENTERPRISE DATA WAREHOUSEThe extracted/transformed data is then loaded into the Enterprise Data Warehouse (EDW). This databaseholds all of the information available for BI reporting. This separate database allows IT to optimize it forreporting on larger data sets and isolates the impact of reporting on these larger data sets from the sourceoperational systems.ACCESS TO BIAccess to Business Intelligence is determined by business need. All account or access requests should besubmitted to the OIT Help Desk. Users should specify the reporting domain being requested as well as theschool/university department to which he/she belongs. The OIT Help Desk will forward the request to theappropriate Data Custodian for approval. Once approved, the account is created and credentials are grantedonce this mandatory training is completed. Additional training is available depending on your access level.RESPONSIBLE COMPUTINGEveryone with access to American University data shares in the responsibility to protect and defend ouracademic, administrative, and financial information resources. American University adheres to the Principle ofLeast Privilege which provides the narrowest access needed to sensitive data to reduce risk to the university.American University Office of Information Technology offers extensive online training in Information SecurityBest Practices, and you are encouraged to email CIO@american.edu if you have any questions or concerns.1
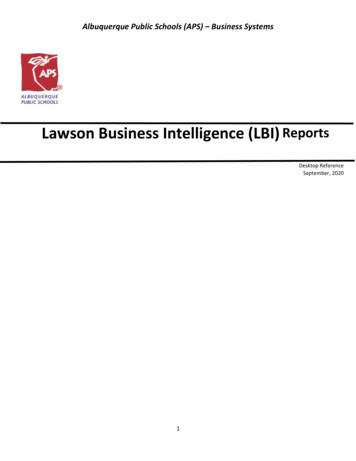
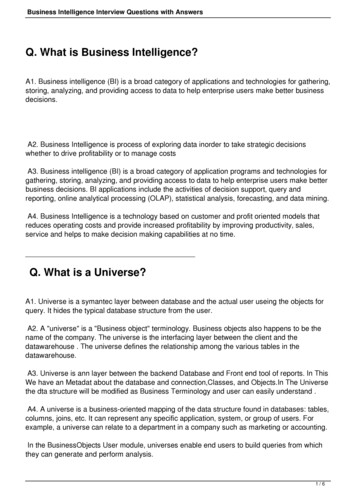
BUSINESS INTELLIGENCE TERMINOLOGYReportsA report is a request for specific data that has a defined layout and format.All of the information for a report can be predefined or you may be able to choose part or all of the content ofa report. You can view report results either in grid or graph format. The following image shows an example ofa grid report:The following image shows a grid report:This image shows the same data as above displayed in a graph report:2
Report Elements Row and ColumnOn a typical report, each row represents groupings by the values of different concepts, such Student, CourseSection Name, GL Unit, and so on. MicroStrategy calls these concepts “attributes,” because represent themany important characteristics of the university. While the rows represent concepts/groupings, the columnsof a typical report represent calculations, such as Enrolled Credits or GL Amount. MicroStrategy calls thesecalculations “metrics.”It can be useful to think of attributes as the nouns and metrics as the verbs. A student enrolls in a coursesection. A Project incurs an expense.AttributeAttributes are the concepts/characteristics reflected in your stored data in your data source. Attributesprovide a context in which to report on and analyze calculations.MetricMetrics are MicroStrategy objects that represent counts, measurements, and key performance indicators.From a practical perspective, metrics are the calculations performed on data stored in your database, theresults of which are displayed on a report. Metrics are similar to formulas in spreadsheet software.FilterA filter is the part of a MicroStrategy report that screens data from the EDW to determine whether the datashould be included in or excluded from the calculations of the report results. Filters are helpful in clarifyinglarge quantities of data and only displaying subsets of that data, so reports show users what they really needto see.For example, you want to view the GL Expense and PO Encumbrance amounts for Project 34608 in Fiscal Year2017. The report would need to be filtered by GL Project 34608 and Fiscal Year 2017.3
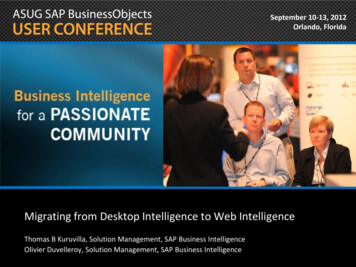
PromptsA prompt is a question the system presents to a user during report execution. How the user answers thequestion determines what data is displayed on the report when it is returned from your data source. Promptsmay be used to create filters on a report, determine what attributes and metrics appear on a report, and/orboth. Instructions for a given prompt will appear below the prompt title and will explain the effects of yourselections. You may either click on the desired value and then the right pointing arrow or double-click yourselection to add it to the Selected list. Required prompts are indicated by the word (Required) and must beanswered before the report will run. Optional prompts may be left blank.Examples:1. Select a value to filter report. A common report element prompt is the Academic Term.2. Select attributes and/or metrics to include on the report.3. Optionally, additional filters prompts present you with prompts to further restrict the report.4
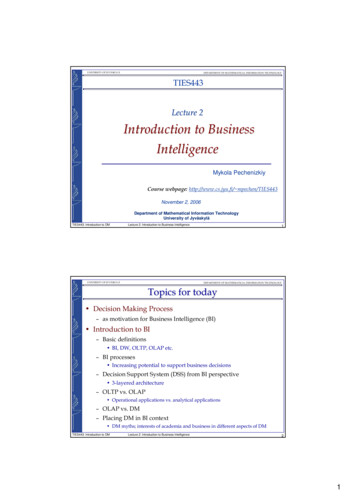
REPORT TYPESGridsA grid report is the most commonly used type of report. Grid View displays grid reports using a formatted,cross-tabular display of the report data. Most business intelligence analysis is performed using this view. Thefollowing figure displays the Grid View of a report.GraphsA graph report is representations of data in a visual format that can help you see overall trends easily, identifymedians and exceptions, and so on. You display report data as a graph using Graph View. There are manydifferent graph styles you can choose from to display your report data most effectively.5
Grids and Graphs combinedGrid Graph View is a combination display of the Grid View and the Graph View of a report, side by side.The following figure displays the Grid Graph View of a report.DocumentA document is a more formatted report that may contain information from multiple grids. There is lessinteraction but the report results will be formatted in such a way to make it easier to print. A document mayinclude several tabs.6
DashboardA dashboard is an interactive report that may combine information from multiple grids and graphs. It is highlyvisual and is usually best viewed on-line. A dashboard may also include multiple tabs.MICROSTRATEGY BI REPORTSOverview: Navigate to the folder that contains the report you want to run.Click the name of the report to run the report.If the Wait Page appears as your report is executing, you can click Add to my History List toautomatically save a copy of the report in your History List when the report is finished executing.If you are presented with a prompt question, you must answer the prompt(s) before the results of thereport are displayed.After the report is displayed, you can interact with the report to change the sorting, filter the view, orchange the display.Technical Requirements: Recommended Web browsers:oFirefoxoChrome7
ACCESSING MICROSTRATEGY BI REPORTING1. Log on to the myau.american.edu Portal, then expand the TECHNOLOGY link under Personalized links.2. Select Business Intelligence. Access to view this link is restricted to those granted the security class.Contact the HelpDesk at x2550 for security class assistance.3. The BI Portal will be customized based on the domains to which you have been granted access.4. If you would like to see a complete list of applications and instructions for access, click the OITBusiness Intelligence link at the top of the page, in the last sentence of the first paragraph.5. The available reporting applications have been organized by domain: Enrollment, Finance andAdministration, Development and Alumni Relations, and Office of Information Technology. Click onthe tab under the appropriate domain to access reports and folders.6. Make a selection from your available options: dashboard, document, folder, etc.8
ACCESS RIGHTS AND PRIVILEGESIDENTIFYING ACCESS RIGHTSThe folders, reports, and features you can access depend on the rights and privileges that have been grantedto your account. You may have rights to access the Research Grants and Reporting Shared Reports folder butyour privileges do not extend to running the Overhead and Fringe reports. Some users will have rights tocreate new reports while others will only be able to run existing reports. PRIVILEGES – control what functionality in the MicroStrategy system the user has access to (i.e. runreports vs. create your own) SECURITY FILTERS – control what data the user has access to (i.e. user may only access GL accounts towhich the user has been granted access to in Colleague within the Budget and Financial Managementreporting.) PERMISSIONS – control to which objects (Attributes, Metrics, etc.) in the MicroStrategy system theuser has access:o None (user may not run a report including that object)o Execute (user may run reports using these object)o Full Control (user may change these objects)).9
REPORTSThrough Enterprise Reporting, you can analyze data using standard features such as page-by, pivot, sort, filterand drill up/down to flip through a series of report views. Massive amounts of operational data are organizedinto hierarchical categories that are fundamental to university operations. The reports feature easy page andsection navigation, including labels, headers, footer and page break logic.Each project that you log into in BI opens the project’s HOME page, which provides links at the top of the pageto different areas of the project. Click the Microstrategy logo to select from: PROJECTS - all the domain folders you have rights to access RECENTS - access any reports you have recently run within a particular BI application SHARED REPORTS - a common report library for all users MY REPORTS - each users’ favorite reports HISTORY LIST - stored reports that have been run on a schedule and delivered to the History List folder MY SUBSCRIPTIONS - a list of scheduled reports, where you can manage subscriptions to scheduledreports10
SHARED REPORTS FOLDERSelecting Shared Reports displays subfolders containing reports. Below each subfolder name is a descriptionof the types of reports contained in the subfolder. Note: If you know the name of the report you are lookingfor and not the exact location, you may also use the search feature by either clicking the magnifying glass fromthe NAVIGATION TOOLBAR on the left or entering the name in the search box in the upper right of the SharedReports page.1. Click the name of a subfolder to display a list of the reports.NAVIGATION TREE, LIST, ICON VIEWS1. To change the report list display, make a selection from the NAVIGATION TOOLBAR, located at thebottom of the left sidebar. Choose one of the following:o Show Navigation Treeo Listo Icon11
RUN A REPORT1. To run a report, click the report name. For this example, select the 2. Admissions Analytics folder, thenclick Application Status Review Baseline Reports subfolder, and, then, click the 2.1 CurrentApplication status by School and Term report.2. Click the RUN REPORT button located in the lower left corner of the screen to run the report.3. If the report does not return immediately, a PROCESSING REQUEST page will appear. After refreshingthe first time, a link will appear and the running report can be added to the history list to be viewedlater. After adding a report to the history list, the user may then navigate away and run other reports ifdesired.12
4. After the report is run, it is displayed on the next screen.USING THE TOOLBARS1. To interact with the data, use the MENUBAR and/or TOOLBAR located above the report display.2. Do one of the following:o Select the dropdown next to the MENUBAR name and choose an option.o Click the MENUBAR name to change the TOOLBAR and then select an option from theTOOLBAR.HOME: GridGraphGrid and GraphAdd to History ListCreate Personal View Share PrintSend NowSchedule to History ListExportPDF Full Screen Mode13
TOOLS: GridGraphGrid and GraphRelated ReportsPage-by Axis View FilterReport DetailsShow Pivot ButtonsShow Sort ButtonsReport Options GridGraphGrid and GraphAdd View Filter ConditionSort DrillFilter on SelectionsHide Nulls/ZerosRefreshSwap Rows and Columns GridGraphGrid and GraphAutostylesBandingOutline Merge Column HeadersMerge Row HeadersLock Row HeadersLock Column HeadersAutofit to ContentsAutofit to WindowDATA:GRID:
MOUSEOVERSMicroStrategy BI provides more information regarding icons and report elements through the use ofmouseovers. Hover your mouse pointer over an icon or an attribute/metric name on a report and a shortdescription will pop up if one has been created.PRINTING AND EXPORTING DATAMicroStrategy BI allows you to easily export reports to Microsoft Excel and as an Adobe PDF file.1. To export the report to Excel, click the EXPORT TO EXCEL button on the Home Menu toolbar.2. Select the report formatting options, then, click the EXPORT button .3. To export the report to a PDF, click the EXPORT TO PDF button on the Home Menu toolbar . You canalso click the PRINTER icon which displays the same Options dialog box as the PDF icon.4. Select the report formatting options, then click the EXPORT button .1
5. You can also choose to run the report directly into a PDF or Excel by selecting these options under thereport description.FILTER DATA SHOWNMicroStrategy BI provides a few ways in which you can limit what data is shown on the screen for a report.1. A report may already have included PAGE-BY fields or you can add them yourself. If there are no fieldsin the PAGE-BY section, you can enable it by clicking on the Page-By option under TOOLS. Anyattributes can be pulled into the PAGE-BY section. Select an attribute value from the list and only rowswith those values will be shown on the screen.2. You can also add a VIEW FILTER to the report. Click on the VIEW FILTER option on the TOOLS menu.Select one of the report elements from the drop-down presented. You can then build your filter onvalues of those report elements. Remember to click Apply to restrict your view of the report. You canadd multiple view filters to one report. Click Clear All in the VIEW FILTER section to remove all viewfilters.SORT THE DATAMicroStrategy BI provides the ability to change the way that a report is sorted in your display.1. From the TOOLS menu, select Show Sort Buttons to add sort buttons to the report elements. You canclick them to sort by that value up or down.2. From the DATA menu, select the Sort option to sort by one or more different report elements.VISUALIZE THE DATAMicroStrategy BI provides the ability to change the way that a report is displayed.2
1. You can improve the readability of the data by adding BANDS to the data.2. MicroStrategy automatically groups like attribute values in the rows so that you only see a single valuefor attributes. For some reports, it may be better to see all of the repeating values. From the GRIDmenu, de-select the Merge Row Headers option. This will show all values for the attributes in the grid.DRILL THROUGH THE DATADrilling provides a view into the details of the report’s data. When data is organized hierarchically in a storagesystem, the data can be displayed at a high, summarized level, and areas of interest can be investigated all theway down to a low, detailed level.Drilling allows users to change the initial report definition dynamically without having to design and store thenew reports beforehand.1. Some reports already have drills to different reports or additional values. If an attribute or metric valueis underlined, you should be able to click it and be taken to either a more detailed report or addadditional report elements to the report you are viewing.2. In the GRID report, right-click on any column or row heading and select DRILL.3
USING THE HISTORY LISTThe HISTORY LIST is a tool that allows you to view previously run reports. Reports are not added to the listautomatically, but may be added manually or subscribed on a pre-determined schedule. Once you havesubscribed to a report, the results will run automatically and will be saved in the History List.1. If you have RUN a report you would like to have sent to your History List,you may add the report while it is running from the PROCESSING REQUESTpage or using the Add to History List option on the REPORT HOME menu.2. If a report is not prompted or has default answers selected, you cansubscribe to have the report delivered to your history list on a regular basis. Click the dropdown arrow next to HOME, click SUBSCRIBE TO,slowly move mouse to the right and select HISTORY LIST.3. In the dialog box that opens, set the following:REPORT NAME: You can edit the report name to a more descriptive name.SCHEDULE: The report will automatically run on the scheduled date you select from the dropdown.4
TO: By default, your email address will receive notification that the report has been run and is available foryou to view in your HISTORY LIST. To email a notification to another address letting that person know that thereport has been run, click the Send to a New Address link at the bottom of the dialog box. This option DOESNOT send the report to that person.only notification that the report is waiting in your History List!RUN SUBSCRIPTION IMMEDIATELY: Check this box if, after clicking OK to close the dialog box, you want thereport to run now instead of waiting until the Scheduled Date. The report will still run on the scheduled date inaddition to being immediately run.ADVANCED OPTIONS: If you want only the new copy of the report when it is run (ie. the 5th of next month)and the older copy deleted, check the box next to The new scheduled report will overwrite.If the report does not need to be run after a particular date (ie. end of fiscal year), check the box next to Donot deliver after and select a date from the calendar picker dropdown.Click OK to save your settings.5
View the Report from your History List: EMAIL NOTIFICATION that the report has run and is saved to your History List: LOGIN to BI Reporting, select a PROJECT FOLDER (ie. Graduate Admissions), click the MicroStrategy Mfrom the upper left corner and select HISTORY LIST. CHOOSE one of the following: export the report into Excel, view the report in Adobe Reader as a .PDF,rename the report, or to delete the report from this list, click the Remove checkbox. To REMOVE the subscription (stops the subscription, does not delete the report), choose MYSUBSCRIPTIONS, checkmark the box under Unsubscribe and, then, click the UNSUBSCRIBE button.6
CREATING EMAIL SUBSCRIPTIONS1. RUN the report. Note: The report must not be prompted or the report must have default answersselected in order to be used as a subscription.2. Click the dropdown arrow next to HOME, click SUBSCRIBE TO, slowly move mouse to the right andselect E-MAIL.3. In the dialog box that opens, set the following:REPORT NAME: The report name can be edited to a more descriptive name.SCHEDULE: The report will automatically run on the scheduled date selected from the dropdown.7
TO: Click the TO button to open the Recipients Browser dialog box. Select an email address to send the reportto by clicking the ADD TO SELECTIONS arrow to move one or more recipients from the Available list on theleft to the To list on the right. If you do not see the correct email address to use, type a name to refer to theemail address in the ADDRESS NAME field and type the email address in the PHYSICAL ADDRESS field. ClickADD TO RECIPIENTS to add the address. Click OK to close the dialog box.SEND: Specify how the report or document is included in the email.DELIVERY FORMAT: Select the format in which to send the report or document. When Excel or PDF is chosen,the report is included as an attachment in the email.Click OK to save your settings.NOTE: If you are subscribing other people to the report, the recipient will receive the email from the system asAU Business Intelligence. If the recipient replies to that email, it will come back to the IT department as ahelpdesk ticket. Generally, we will forward along any personal responses, but in some situations it may bebetter to export a report and email it manually. This is especially true if you expect the report to generate anemail conversation.8
View the Report: EMAIL NOTIFICATION that the report has run and is included as an attachment in the email: To REMOVE the subscription (stops the email, does not delete the report), choose MYSUBSCRIPTIONS, checkmark the box under Unsubscribe and, then, click the UNSUBSCRIBE button.9
GETTING HELPFor additional assistance, please contact the OFFICE OF INFORMATION TECHNOLOGY HELP DESK: helpdesk@american.edu 202-885-2550 AskAmericanUHelp http://help.american.edu10
INTRODUCTION TO BUSINESS INTELLIGENCE Business Intelligence (BI) uses methodologies, processes, architectures, and technologies that transform raw data into meaningful and useful information used to enable more effective strategic