Transcription
Use of Intraday Alphas inAlgorithmic TradingQWAFAFEW Boston ChapterJune 21, 2011Thorsten Schmidt, CFAThor Advisors LLC
Execution Algorithms: Traditional Area of Focus Minimize market impact & volatility of the result Vs a price benchmark (e.g. VWAP, arrival price, open, last close) Techniques commonly used to execute efficiently:- Forecast liquidity distribution across time and venues- Forecast adverse selection by venue (esp. dark pools)- Estimated price impact & high frequency volatility, optimizethe trade-off between the two- Tactics to minimize signaling & information leakage(e.g. latency-adjusted Smart Router spraying)- Judicious spread-crossing Not so widely exploited (yet):- Generic alphas (“Micro Alpha Models”)- Portfolio implicit alphas (“Alpha Profiling”)
Generic Alpha Example: “Periodicity” “Intraday Patterns in the Cross-section of Stock Returns” (Heston,Korajczyk, Sadka 2010) Intra-day segment (excess) return continuation at daily intervals Documented for U.S. stocks for 8-year time period 2001 – 2009 Heston, Korajczyk, Sadka robustness checks:- Robust after correcting for bid-ask bounce- Not an artifact of thinly traded stocks- Not an artifact of intra-day spread changes- Magnitude of effect inversely proportional to market cap, but notlimited to small cap stocks- Periodicity in volume doesn’t explain return periodicity Let’s explore if it is relevant in a more recent time period and howuseful in algorithmic execution trading context
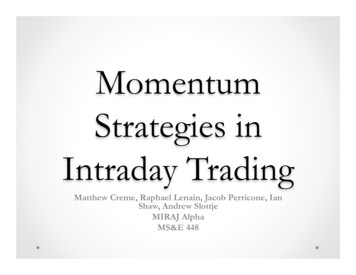
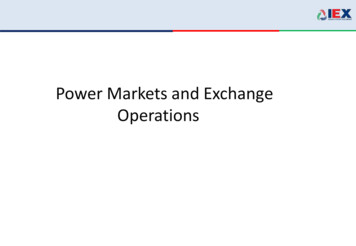
Honing in on the “Periodicity” Effect0.100.05-0.15 -0.10 -0.05 0.00Autocorrelation Coefficient0.15ACF Stock Returns132639526530min Bin #7891104117130Returns normalized by stock trailing 20 day volatilityThe first intraday lag shows high negativeautocorrelation due to temporary liquidityimbalances and bid-ask bounce.Universe: S&P 500 stocks 5 , July 2010 – Feb 2011. The trading day has 390 minutes, i.e. there are 13 30min bins per day.
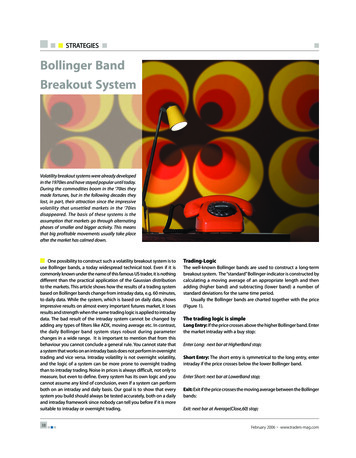
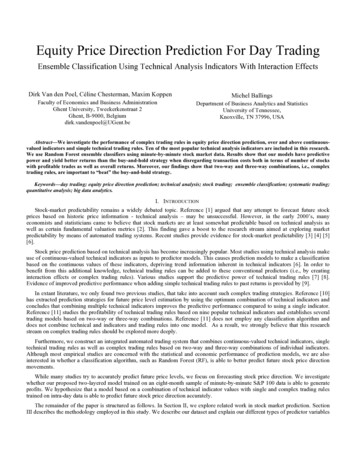
Improved Visibility of “Periodicity” by Removing 1st Lag0.100.05-0.15 -0.10 -0.05 0.00Autocorrelation Coefficient0.15ACF Stock Returns13263952657891104117130Returns normalized by stock trailing 20 day volatility30min Bin #0.010.00-0.01-0.02Autocorrelation Coefficient0.02ACF Stock Returns (ex 1st Lag)132639526530min Bin #7891104117130Returns normalized by stock trailing 20 day volatilityUniverse: S&P 500 stocks 5 , July 2010 – Feb 2011. The trading day has 390 minutes, i.e. there are 13 30min bins per day.
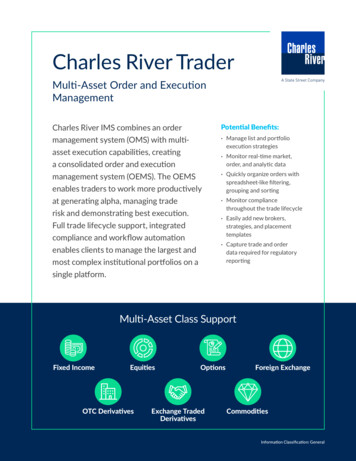
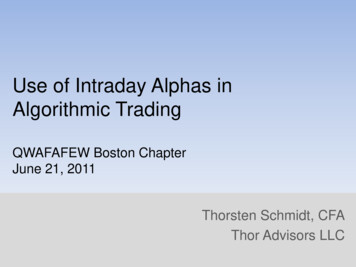
Enhanced “Periodicity” Signal via Removal of Market and Sector Noise0.010.00-0.02-0.01Autocorrelation Coefficient0.010.00-0.01-0.02Autocorrelation CoefficientAll ACF charts are without the 1st Lag0.022) ACF CAPM Excess Returns, normalized by Tracking Error0.021) ACF Stock Returns13263952657830min Bin #911041171301326395265789110430min Bin #Universe: S&P 500 stocks 5 , July 2010 – Feb 2011. The trading day has 390 minutes, i.e. there are 13 30min bins per day.117130
Enhanced “Periodicity” Signal via Removal of Market and Sector Noise0.010.00-0.02-0.01Autocorrelation Coefficient0.010.00-0.01-0.02Autocorrelation Coefficient1326395265789110411713013263930min Bin #5265789110411713030min Bin #-0.02-0.010.000.010.023) ACF 2-Factor Model Market/GICS Sector Residuals, normalized by Residual VolatililtyAutocorrelation CoefficientAll ACF charts are without the 1st Lag0.022) ACF CAPM Excess Returns, normalized by Tracking Error0.021) ACF Stock ReturnsT -1 day13T -2 daysT -3 daysT -4 daysT -5 days26395265 etc789110411730min Bin #Universe: S&P 500 stocks 5 , July 2010 – Feb 2011. The trading day has 390 minutes, i.e. there are 13 30min bins per day.130
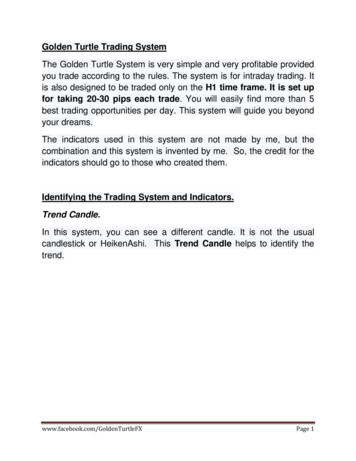
14:3015:0015:3016:00Day Part Bin68Decile Spread Trading Portfolios by Day Part (2-Factor Model Market/GICS Sector Residual)4e.g. 1 Bps Return, 2.5 Sharpe2Not tradable forinvestors except HFTsas expect return isless than typicalspread.Decile Spread Trading Portfolios by Day Part (CAPM Excess Returns)0Strongest effect canbe seen end-of-day,but that might beartifact of recentmomentum regime.Black: Return in Bps, Red: Sharpe w 0% RF RateBest risk-adjustedreturns with sector &market noiseremoved.Black: Return in Bps, Red: Sharpe w 0% RF RateDecile Spread High Frequency Trading Portfolios by Day 4:3015:0015:30Day Part BinUniverse: S&P 500 stocks 5 , July 2010 – Feb 2011. Using T-1 day lag to build trading portfolios. Holding period is 30mins.16:00
Decile Spread Portfolios are Constantly Recomposedthroughout the Trading Day Correlation Matrix of All-day Returns*Sector-Market Model Periodicity Decile Spread Trading Portfolios on same Trading DayLow and negativecorrelations of allday returns ofadjacent decilespread portfoliosshows that theirmake-up changesthroughout the day.Does this mean thata “winning”portfolio in one binbecomes a losingone in the next?10:00 10:30 11:00 11:30 12:00 12:30 13:00 13:30 14:00 14:30 15:00 15:30 16:0010:00 0.04-0.0210:30 0.0311:00 20.13-0.0611:30 2-0.0312:00 0.130.0512:30 0.1213:00 40.0313:30 0.070.0214:00 0.0614:30 0.020.0715:00 10.1115:30 00.1316:00 131.00* As proxy for similarity of Decile Spread Portfolio CompositionUniverse: S&P 500 stocks 5 , July 2010 – Feb 2011. Using T-1 day lag to build trading portfolios.
however, Returns do not fully Decay, but show some Staying Power.8Decile Spread Trading Portfolios by Day Part (Cumulative Returns for Remainder of Day)420Return BpsThis means thereshould be value inthis Alpha factor forlonger durationtrades.6The effect is not sofleeting as tosubsequently fullyerase any returnswithin the same day.10:00 10:30 11:00 11:30 12:00 12:30 13:00 13:30 14:00 14:30 15:00 15:30 16:00Day Part BinUniverse: S&P 500 stocks 5 , July 2010 – Feb 2011. Using T-1 day lag to build trading portfolios.
Can the “Periodicity” Alpha be Utilized to ImproveTypical All-day Institutional Orders? Our experiment: Create hypothetical VWAP orders comprising theentire S&P 500 ( 5 ) universe for every trading day of our 168 daysample (79,557 hypothetical orders) Long/short mix: Approximately same number of buys and sellsevery day, randomly assigned each day using binomial distribution Volume forecast: We use trailing 20-day stock-specific volumedistribution, smoothed by a 5th order polynomial fit, to build our“VWAP curve” forecast. This is for both operational (orderplacement) and economical (market impact) reasons. Our Alpha signal:Z (RstockT-1bin - RmarketT-1bin * βmarket - RsectorT-1bin * βsector – α) / σ residuals1volatility of residuals is calculated for the entire rolling factor model estimation window of trailing 60 days1
Transforming our Alpha Z Score into reweighed VWAP “Curves” TradeDummy is 1 for buys, -1 for sells Z Z * TradeDummy * -1 E.g. we are a VWAP buyer and Z is positive, Zsided will be negativebecause we want to underweight this “expensive” bin We want to overweight positive Zsided bins and underweightnegative Zsided bins, proportional to the size of Zsided We super-impose our 13 “coarse grid” Zsided per stock/day on our“refined grid” of 390 1-min VWAP bins. ωreweighted ωtrailingavg * ( (Z – Z ) * (1/390) 1 )) scalefactor ωreweighted is then rescaled to sum to 1 for every stock/day The VWAP “curves” are then refitted based on ωreweighted using a 5thorder polynomialsidedsidedsided
Example in Visuals: Creating reweighted VWAP Curve. Step 1210-1-2Hypotheticalall-dayVWAP buyorder forAAPL on12/06/2010Residual Return NormalizedResidual Return ( Z Score), original (black) and sided (red)306090Buy order & positive residual:Positive Z score “flipped” tonegative Zsided for this bin120150180210Trading Day Minute240270300330360390
Example in Visuals: Creating reweighted VWAP Curve. Step 60390Trading Day Minute0.020Trailing Volume Fraction, original (black) and reweighted (red)0.0100.015Overweight “cheap” bins0.005Volume FractionHypotheticalall-dayVWAP buyorder forAAPL on12/06/2010Residual Return Normalized2Residual Return ( Z Score), original (black) and sided (red)306090120150180210Trading Day Minute240270
Example in Visuals: Creating reweighted VWAP Curve. Step 60390300330360390Trading Day Minute0.0100.015Overweight “cheap” bins0.005Volume Fraction0.020Trailing Volume Fraction, original (black) and reweighted (red)306090120150180210240270Trading Day MinuteOverweight “cheap” bins (after polynomial fit smoothing)0.0010.0030.0050.007Trailing VolumeFractionSmoothed, original (black) and reweighted (red)Volume FractionHypotheticalall-dayVWAP buyorder forAAPL on12/06/2010Residual Return Normalized2Residual Return ( Z Score), original (black) and sided (red)306090120150180210Trading Day Minute240270
Result: “Periodicity” Alpha Signal can EnhanceS&P 500 VWAP Achieves up to 0.4 bps ofmean VWAPoutperformance in ourS&P 500 universesimulation.Mean VWAP outperformance BpsEnhanced mean VWAPoutperformance can betraded off for increasedvolatility, as function ofscalefactor, i.e. theextent to which weintroduce the signal inbuilding of VWAP curves.0.5VWAP Outperformance vs VWAP VolatilityOriginal VWAP performance – not using signal152025303540Stdev Bps vs VWAPUniverse: S&P 500 stocks 5 , July 2010 – Feb 2011. Each simulation run is based on 79,557 hypothetical VWAP orders randomly sided.
Additional Simulation Runs:Performance Varies, but Positive Relationship is Robust0.5VWAP Outperformance vs VWAP Volatility0.30.20.1-0.10.0Mean VWAP outperformance BpsShows performancegains are not result ofsome “lucky” buy/selldistribution of orders.0.4A total of 954,684hypothetical orders,randomly sided.Original VWAP performance – not using signal152025303540Stdev Bps vs VWAPUniverse: S&P 500 stocks 5 , July 2010 – Feb 2011. Each simulation run is based on ca 79,557 hypothetical VWAP orders, randomly sided.
Important DisclaimersOther factors also affect VWAP performance: The study does not factor in any other performance contributors,such as spread costs/savings, market impact, more sophisticatedvolume forecasting. These vary based on the algorithm provider and can both enhance ordeteriorate results. Polynomial fit smoothing will avoid any “radical” overweighting ofspecific time bins. This is important as the intent of VWAP is to trade“with volume” to minimize market impact. Any extreme overweighting of a specific day part could more thanoffset the positive effect of the alpha signal, especially with larger %ADV orders.
Important Disclaimers (cont’d)Suitability: In practice, one would likely allow the user to control thescalefactor, i.e. the extent to which the signal reweights VWAPcurves. Users with many orders would be in a better position to stomach theincreased volatility to harvest the expected performance gain. Exploiting the signal is not limited to VWAP orders, can be used forImplementation Shortfall orders, tactical child orders, etc. Results from Heston, Korajczyk, Sadka paper indicate performancegains should be greater on smaller caps, but not tested as part ofthis study.
Areas for Improvement and Further Research Consider inter-day signal memory: The “Periodicity” effect has anmemory of multiple days. There are some small benefits ofincorporating multiple days in the signal via an EWMA process. Consider intra-day spill over: The process works well for 30min bins,but autocorrelation shows up in surrounding bins. Explore effect of“spill-over” from adjacent bins. Bin structure: Explore equal “volume time” bins vs. “clock time” bins. Effect of noise reduction model: Market-Sector works well, butcould use PCA model, proprietary risk model. Volume distribution forecasting: Could help reduce volatility ofresult through more sophisticated volume forecasting (volume PCAdecomposition, exchange-specific curves.) Other Alphas: There are other generic alphas as well as thoseimplicit in the portfolio you are trading. This is a subject for anotherpresentation. But I will touch on it briefly
Example other Intraday Alphas Decay Considerations:10-day Decay Profile 12M Price Momentum vs 5-day CAPM Excess Return.101512M Price Momentum Factor55 –day CAPM Excess Return Factor0Mean P/L BpsDifferent Alphafactors havedifferent decayspeeds.20Return246810# of Lag Days1.2Sharpe0.812M Price Momentum Factor5 –day CAPM Excess Return Factor0.4Sharpe RatioUnderstanding theAlpha decay profileof your portfolio (i.e.its underlying factorreturns) will allowyou to trade MUCHmore intelligently.246# of Lag DaysUniverse: S&P 500 stocks 5 , April 2007 – May 2011810
Thank youThor Advisors LLCthorsten.schmidt@gmail.com
Algorithmic Trading QWAFAFEW Boston Chapter June 21, 2011 Thorsten Schmidt, CFA . Universe: S&P 500 stocks 5 , July 2010 –Feb 2011. The trading day has 390 minutes, i.e. there are 13 30min bins per day. 5 0 5 0 5 0 5 ACF Stock Returns