Transcription
Available online at www.sciencedirect.comScienceDirectProcedia Technology 23 (2016) 391 – 3973rd International Conference on Innovations in Automation and Mechatronics Engineering,ICIAME 2016A comparative study of the RSM and ANN models forpredicting surface roughness in roller burnishingKiran A Patela*, Pragnesh K BrahmbhattbbaResearch scholar,PAHER University, Udaipur, Rajasthan, IndiaProfessor, L D Collage of Engineering, Ahmadabad, Gujarat, IndiaAbstractIn this paper the comparison of the surface roughness prediction models based on response surface methodology (RSM) andartificial neural networks (ANN) is described. The models were developed based on five-level design of experiments conductedon Aluminum alloy 6061 work material with spindle speed, interference, feed, and number of tool pass as the roller burnishingprocess parameters. The ANN predictive models of surface roughness was developed using a multilayer feed forward neuralnetwork and trained with the help of an error back propagation learning algorithm based on the generalized delta rule.Mathematical models of second order RSM and developed ANN models were compared for surface roughness. The comparisonevidently indicates that the prediction capabilities of ANN models are far better as compared to the RSM models. The minutiaeof experimentation, development of model, testing, and performance comparison are presented in the paper. 2016 The Authors. Published by Elsevier Ltd. This is an open access article under the CC BY-NC-ND license 2016 The Authors. Published by Elsevier 4.0/).Committee of ICIAME 2016.Selection and/orof the OrganizingPeer-reviewunder peer-reviewresponsibilityunderof the responsibilityorganizing committeeof ICIAME 2016Keywords: Response surface methodology; Artificial neural networks; Burnishing; Design of experiments; Surface roughness.1. IntroductionSurface treatment is to be considered most important aspect for growing industrial manufacturing processes. Toconfer various physical and mechanical properties it has been utilized, for example, appearance, consumption,grinding, wear and weariness resistance [1]. The execution of a machined part, for example, weariness quality,burden bearing limit, erosion, and so on depends to a vast degree at first glance as geography, hardness, nature ofanxiety and strain impelled at the first glance area [2]. Roller Burnishing is one of the most important finishingprocesses which produce plastic deformation of surface in addition with compressive residual stresses and thereby it2212-0173 2016 The Authors. Published by Elsevier Ltd. This is an open access article under the CC BY-NC-ND nd/4.0/).Peer-review under responsibility of the organizing committee of ICIAME 2016doi:10.1016/j.protcy.2016.03.042
392Kiran A. Patel and Pragnesh K. Brahmbhatt / Procedia Technology 23 (2016) 391 – 397helps in improvement of fatigue resistance [3, 4]. Material from the peak is cold flow into valley under the action ofplastic deformation formed with the help of roller burnishing. Result of this process gives a mirror-like finish with awork hardened, tough and wears as well as corrosion resistant surface which is key objective of the proposed study[5].In the past, the burnishing process system and its disturbing variables were studied by a number of researchers onvarious materials [6–10]. It is revealed from the investigations that process variable and cutting conditions, such asspindle speed, feed, interference and number of tool pass, have significant influences on surface roughness. Variousstudies conceded out on the burnishing of aluminium alloy with a roller burnishing tool [7, 8] focused on the effectsof variable speed and feed on surface roughness. The studies on the burnishing of aluminium alloy emphasized theimportance of process variable on the surface roughness [6] [9].Aluminium alloy has low weight high strength property in addition with better corrosive resistance propertiesand, hence, finds a variety of applications in aircraft designs, manufacture of medical apparatus and in chemicalindustries. The formation of surface with good finishing in Aluminium alloy work materials during after machiningprocess is a major problem due to high ductility of the work material. One of the most effective after machiningprocess for achieving the objective is burnishing process. Hence, burnishing process with carbide roller was used forthe experiments.Many researchers have investigated the suitability of different empirical models to predict surface roughnessduring burnishing. These include empirical burnishing charts, finite element models, and models based on responsesurface methodology [11] for analyzing the surface roughness. The methodology based on RSM was found to beconvenient because a model can be generated with minimum process knowledge which leads to save time and costof experimental work. Model developed using RSM are accurate only for a narrow range of input processparameters. Alternatively, the development of higher order RSM models requires a larger number of experiments tobe performed. This is the limitation on the use of RSM models for highly non-linear processes, such as burnishing.These constraints have led to the model development based on artificial neural networks.An artificial neural network (ANN) is a learning system depending upon a computational procedure to simulatethe neurological processing ability of the human brain [12]. Human intuition has been simulated by ANN in makingdecisions and drawing conclusions when presented with noisy, complex, irrelevant, and limited information. For thepurpose of implementing ANN few prior assumptions are needed about the process under study. An ANN has theability to approximate any reasonable function arbitrarily well. The capability of an ANN to study and simplify theperformance of any complex and non-linear process makes it a powerful modeling tool [13, 14].The present study aims at investigating the fitness of surface roughness predictive models based on RSM [15] andANN during the burnishing of aluminum alloy 6061 work material using roller carbide burnishing tool. The modelsof surface roughness were developed with the spindle speed, feed, interference and number of tool pass as theburnishing process parameters. The input and output information needed to build up RSM and ANN models havebeen obtained through five level design of experiments. The generated models have been tested for their predictionaccuracy with new process variable combinations. The comparison of the interaction and main effects of the processparameters by the RSM and ANN models have also been verified in the paper.2. Experimental detailsThe input and output data required for the development of surface roughness models is obtained throughburnishing experiments. Entire understanding of the process requires a large number of experiments to beconducted, which is very costly and time consuming. This can be overcome by adopting the experimental layoutplan based on the design of experiments using different levels defined for each of the process variables. In thepresent study four parameters, namely, spindle speed, interference, feed and number of tool pass were identifiedbased on the past investigation.To investigate the effect of process parameters on the performance of output parameter, the experiment wasdesigned and conducted by considering surface roughness as a main response. Aluminum alloy 6061 round bar of 40mm diameter has been used for the present experiments with tungsten carbide single roller burnishing tool. Theexperiments were conducted on HMT lathe machine (ECONO CNC 26).In the following section the experimentalresults are discussed subsequently. The considered process parameters were varied up to five levels for each factoras summarized in Table 1. The upper level of a factor is coded as 2, center level as 0, and the lower level as 2 and
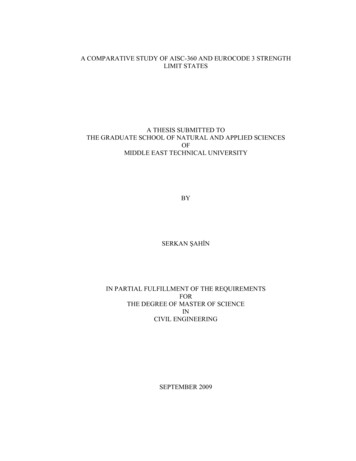
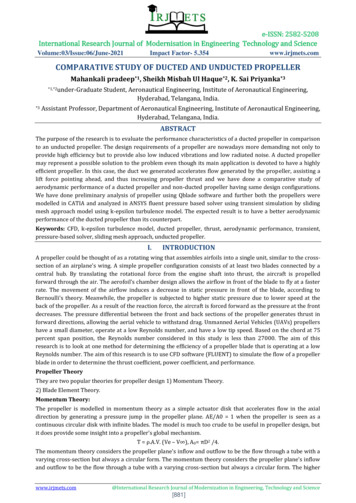
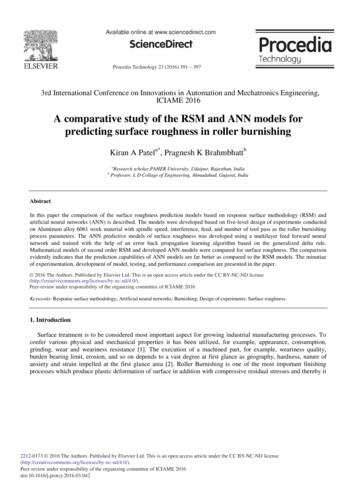
Kiran A. Patel and Pragnesh K. Brahmbhatt / Procedia Technology 23 (2016) 391 – 397393central composite rotatable design was adopted to plan the experiments. RSM was used to develop a second orderregression equation to relate response characteristics with process variables [11].Table 1. Process Parameters and their LevelsCoded FactorsFactors(-2)(-1)Levels(0)( 1)( 2)A1Spindle 0240.0440.0640.0840.104A4No. of Tool Passes123453. RSM-based predictive modelThe experiments were designed and conducted by employing response surface methodology. Second-order nonlinear mathematical models have been developed to predict the surface roughness, which are of the following form[16, 17].Y b0 b1x1 b2x2 b3x3 b4x4 b11x12 b22x22 b33x32 b44x42 b12x1x2 b13x1x3 b14x1x4 b23x2x3 b24x2x4 b34x3x4(1)Where:YResponseCoded values for i A1, A2, A3 and A4xiRegression coefficientsb0, , b34The regression equation for the surface roughness as a function of four input process variables was developedusing the regression coefficients of the second order equation (Equation 2) are obtained by using the experimentaldata as shown in Table 3[15].The coefficients (insignificant identified from ANOVA) of some terms of thequadratic equation have been omitted. The analysis of variance (ANOVA) [16] was performed to statisticallyanalyze the results.Surface Roughness 0.110840 0.006024A1 - 0.070690A2 0.026662A3 -0.019587A4 0.015689A12 0.035242A22 0.010256A42 - 0.006538A1A2 0.012052A1A3 - 0.026860A2A3 0.021932A2A4 - 0.019263A3A4(2)Fig 1. Predicted vs. Actual for Surface RoughnessFrom the Table 2. It is evaluated that the coefficient of multiple determination is very close to unity (R 2 0.9946)and the adjusted coefficient is R2 adj 0.9899. All these statistical estimators indicate an appropriate RSM modelwith the degree of freedom and optimal architecture that can be used for predictive simulations of reactive extraction
394Kiran A. Patel and Pragnesh K. Brahmbhatt / Procedia Technology 23 (2016) 391 – 397process [18]. ANOVA results as shown in Table 3. gives F-value of 212.07 and P-value of 0.001 outlining asignificant RSM model. The agreement between experimental and predicted data given by RSM is shown in theFigure 1. All points are located close to a straight line indicating that RSM predicts well the experimental data forthe considered valid region [19].Table 2. Estimated Regression Coefficients for Surface SE 0R-Sq 99.46%R-Sq(pred) 95.01%R-Sq(adj) 98.99%Table 3. Analysis of Variance for Surface l ErrorLack-of-FitPure ErrorTotalDegrees of freedom (DF)14446169730Sum of square 1351.45864Mean 07190.000192F-value212.07206.92196.86138.683.74The Model F-value of 212.07 implies the model is significant. There's no chance that a "Model F-Value" of thismuch magnitude could occur due to noise.4. ANN modelingNormally, an ANN is made up of some neurons connected together via links. The information is processed withinthe neurons and is propagated to other neurons through synaptic weights of the links connecting the neurons [20].Literature review shows that ANN models have better prediction capability than the regression models. So ANNmodels are also created for surface roughness prediction. This section describes pre processes, model design,training, model simulation and post processes in the generation of ANN prediction models.All 31 experimental data sets are divided for training, validation and testing. There are 23 data sets are used fortraining, 4 data sets for validation and 4 data sets for testing. It is clear that more data sets in training reducesprocessing time in ANN learning and improves the generalization capability of models[21], so large number of datasets are used to train the models. Attempts have been made to study the network performance with a differentnumber of hidden neurons. A network is constructed each of them is trained separately, and the best network isselected based on the accuracy of the predictions in the testing phase.A feed-forward neural network with back propagation with three layers is used. The first layer, which is the inputlayer, is triggered using the sigmoid activation function whereas the second layer is hidden layer and third layer isthe output layer which is triggered using the linear activation function. A network of two transfer function, wherethe first transfer function is tansig and the second transfer function is purelin, can be trained to approximate any
395Kiran A. Patel and Pragnesh K. Brahmbhatt / Procedia Technology 23 (2016) 391 – 397function[22].5. Comparison of the RSM and ANN modelsThe surface roughness predictive models developed by RSM and ANN were compared on the basis of theirprediction accuracy. Table 4 shows RSM and ANN prediction comparison for surface roughness. Therefore, in thecase of data sets with a limited number of observations in which regression models fail to capture reliably, advancedsoft computing approaches like ANN may be preferred.Table 4. Experimental 0.0950.1200.1150.15
These include empirical burnishing charts, finite element models, and models based on response surface methodology [11] for analyzing the surface roughness. The methodology based on RSM was found to be convenient because a model can be generated with minimum process knowledge which leads to save time and cost of experimental work. Model developed using RSM are accurate only for a