Transcription
2018 EdelmanTrust BarometerGlobal Report#TrustBarometer1
2018 EdelmanTrust BarometerGeneral Online PopulationInformed Public7 years in 25 markets10 years in 20 marketsAges 18 Methodology1,150 respondents per marketRepresents 15% of total globalpopulationAll slides show general onlinepopulation data unless otherwise noted500 respondents in U.S. and China;200 in all other marketsMust meet 4 criteria:Ages 25-64College educatedOnline Survey in 28 Markets18 years of dataIn top 25% of household income perage group in each marketReport significant media consumptionand engagement in business news33,000 respondents totalAll fieldwork was conducted betweenOctober 28 and November 20, 201728-market global data margin of error: General population /0.6% (N 32,200), informed public /- 1.2% (N 6,200), masspopulation /- 0.6% (26,000 ), half-sample global general onlinepopulation /- 0.8 (N 16,100).Market-specific data margin of error: General population /- 2.9(N 1,150), informed public /- 6.9% (N min 200, varies bymarket, China and U.S. /- 4.4% (N 500), mass population /- 3.0to 3.6 (N min 740, varies by market).Mass PopulationAll population not including informed publicRepresents 85% of total global population2
Trust in ng Influenceof NGOsFall of theCelebrity CEOEarned MediaMore CredibleThanAdvertisingU.S.Companies inEurope SufferTrust DiscountTrustShifts from“Authorities”to Peers“A Person LikeMe” Emergesas CredibleSpokespersonBusiness MoreTrusted ThanGovernmentand MediaYoungInfluencersHave More Trustin BusinessBusiness MustPartner withGovernment toRegain Trust201020112012201320142015201620172018Trust is Now anEssential Lineof BusinessRise ofAuthorityFiguresFall ofGovernmentCrisis ofLeadershipBusinessto Leadthe Debatefor ChangeTrust isEssential toInnovationGrowingInequalityof TrustTrust in CrisisThe Battlefor Truth3
A Polarizationof Trust
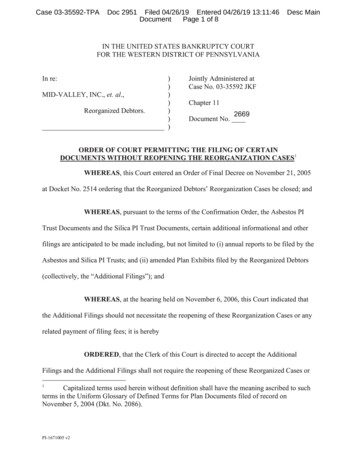
2017No Recovery in Trust Percent trust in each institution, and change from 2017 to 20186764-3GeneralPopulation-153535253NGOsY-to-Y Change53530052410 646553InformedPublic020180Business434343 20GovernmentMediaSource: 2018 Edelman Trust Barometer. TRU INS. Below is a list of institutions. For each one, please indicate how much you trust that institution to dowhat is right using a nine-point scale, where one means that you “do not trust them at all” and nine means that you “trust them a great deal.” (Top 4 Box,Trust) Informed Public and General Population, 28-market global total.5
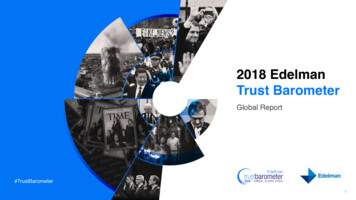
2017General PopulationTrust IndexA Worldof DistrustAverage trust in institutions,general population, 2017 vs. 2018Global Trust Index remains at distruster level20 of 28 markets are distrusters, up 1 from 2017Source: 2018 Edelman Trust Barometer.The Trust Index is an average of a market's trust in the institutionsof government, business, media and NGOs. General population,28-market global total.2018General aSingaporeUAEThe ysiaArgentinaHong KongSpainTurkeyAustraliaS. AfricaGermanyFranceU.K.S. nesiaIndiaUAESingaporeMexicoThe keyHong KongBrazilS. K.IrelandS. st(1-49)Biggest changes inU.S.-9China 7S. Korea 6UAE 6Italy-5Trust decline in the U.S. isthe steepest ever measured6
2017Informed PublicTrust IndexInformed PublicDeclines to NeutralAverage trust in institutions,informed public, 2017 vs. 2018A 1-point decline in the Global Trust IndexSource: 2018 Edelman Trust Barometer.The Trust Index is an average of a market's trust in the institutionsof government, business, media and NGOs. Informed public,28-market global total.2018Informed SingaporeU.S.CanadaThe biaAustraliaGermanyHong KongArgentinaBrazilS. KoreaTurkeyJapanS. aIndiaUAESingaporeThe iaS. KoreaHong KongIrelandPolandRussiaJapanS. )Biggest changes inU.S.-23Argentina 9Sweden 9Malaysia 8Turkey 7U.S. Trust Index crashes23 points7
A World Moving ApartNumber of markets with extreme changes in their aggregate trust in the four institutions, 2013 to 2018 12964# of marketswith extreme22Trust Gains–# of marketswith extreme12Trust Losses66913201320142015201620172018Source: 2018 Edelman Trust Barometer. Trust Volatility Measure. The net year-over-year (2013-2018) percentage point change across the four institutions(TRU INS). General population, 28-market global total. For more details on how the Trust Volatility Measure was calculated, please refer to the TechnicalAppendix.8
The Polarization of TrustAggregate percentage point change in trust in the four institutions, and change from 2017 to 20186 markets with extremeTrust Gains27242320191716 markets withTypical Changes in Trust13121099877536 markets with extremeTrust . nceGermanyThe NetherlandsHong nTurkeyPolandMalaysiaSwedenS. KoreaUAEChina-37Source: 2018 Edelman Trust Barometer. Trust Volatility Measure. The net year-over-year (2017-2018) percentage point change across the four institutions(TRU INS). General population, 28-market global total. For more details on how the Trust Volatility Measure was calculated, please refer to the TechnicalAppendix.9
Global LeadersPoles Apart
2017 Trust Crash in U.S.2018 0Y-to-Y ChangePercent trust in each institution, and change from 2017 to 20187345TRUSTINDEX745123-point decreaseFell from 6th to last placeTRUSTINDEX646342Informed Public33-22584354-204958-30484747General Population9-point decreaseFell from 8th to 18th ource: 2018 Edelman Trust Barometer. TRU INS. Below is a list of institutions. For each one, please indicate how much you trust that institution to do what is right usinga nine-point scale, where one means that you “do not trust them at all” and nine means that you “trust them a great deal.” (Top 4 Box, Trust) Informed Public and GeneralPopulation, U.S. The Trust Index is an average of a market's trust in the institutions of government, business, media and NGOs. Informed Public and General Population,U.S.11
U.S. Trust in Media Diverges Along Voting LinesPercent trust in each institution, Trump vs. Clinton voters574735TrumpVoters544722-pointdecline sincethe election2734pt61difference intrust in the rce: 2018 Edelman Trust Barometer. TRU INS. Below is a list of institutions. For each one, please indicate how much you trust that institution to dowhat is right using a nine-point scale, where one means that you “do not trust them at all” and nine means that you “trust them a great deal.” (Top 4 Box,Trust) S11. For whom did you vote for in the last Presidential election? General population, U.S., among Trump (n 373) and Clinton (n 502) voters.12
2017 China Rising2018 0Y-to-Y ChangePercent trust in each institution, and change from 2017 to 2018767383TRUSTINDEX858186898077Informed Public4-point increaseRose from 2nd to 1st place 3 4 3 3846174TRUSTINDEX666774766571General Population7-point increaseRose from 3rd place to 1st place 5 7 8 6NGOsBusinessGovernmentMediaSource: 2018 Edelman Trust Barometer. TRU INS. Below is a list of institutions. For each one, please indicate how much you trust that institution to do what is right usinga nine-point scale, where one means that you “do not trust them at all” and nine means that you “trust them a great deal.” (Top 4 Box, Trust) Informed Public and GeneralPopulation, China. The Trust Index is an average of a market's trust in the institutions of government, business, media and NGOs. Informed Public and General Population,China.13
Government Most Brokenin the U.S.Government Pathto Better Future in ChinaWhich institution is themost broken?Which institution is most likelyto lead to a better future? Government 68%%% NGOs 29%%%38%59%BusinessGovernment%%Source: 2018 Edelman Trust Barometer. ATT STE. Please indicate which institution – Government, Media, Business or NGO’s – is best described by each of thefollowing statements? General population, U.S. and China.14
In Searchof Truth
World Worried AboutFake News as a WeaponPercent who worry about falseinformation or fake newsbeing used as a andsCanadaIrelandJapanGermanyItalySingaporeS. AfricaUAEU.K.AustraliaHong KongPolandTurkeyBrazilIndiaColombiaMalaysiaS. ermany passes a lawthat fines social mediacompanies for failing todelete fake newsCanadian Conservativeleader’s campaignmanager roots outenemies using fake newsPope criticizesspread of fake newsNearly7 in 10worry about falseinformation or fake newsbeing used as a weaponSingapore announcesplans to introducelaws designed tofight fake newsFake news disruptselections in South AfricaSource: 2018 Edelman Trust Barometer. ATT MED AGR. Below is a list of statements. For each one, please rate how much you agree or disagree with that statementusing a nine-point scale where one means “strongly disagree” and nine means “strongly agree”. (Top 4 Box, Agree), question asked of half of the sample. Generalpopulation, 28-market global total.16
DistrustMedia Now Least Trusted Institution Neutral 0TrustY-to-Y ChangePercent trust in media, and change from 2017 to 2018Distrusted in 22 of 28 of 7484952555671610 5-10-100 4 3 4-4-100-5-5-2 10-3 5 1 4-2 1 12-5 1 6Global dRussiaS. AfricaArgentinaS. KoreaGermanyU.S.BrazilColombiaHong KongSpainItalyMalaysiaMexicoCanadaSingaporeThe NetherlandsUAEIndiaIndonesiaChinal llllllllllllllllllllllllllllSource: 2018 Edelman Trust Barometer. TRU INS. [MEDIA IN GENERAL] Below is a list of institutions. For each one, please indicate how much you trustthat institution to do what is right using a nine-point scale where one means that you “do not trust them at all” and nine means that you “trust them a greatdeal.“ (Top 4 Box, Trust) General population, 28-market global total.17
PLATFORMSPeople Define“Media” AsBoth Contentand Platforms48%PUBLISHERS25%SocialWhat did you assume was meant bythe phrase “media in andsSource: 2018 Edelman Trust Barometer. TRU MED. In the abovequestion, what did you assume was meant by the phrase “mediain general”? General population, 28-market global total. Social is anet of TRU MEDr3 and r12, Influencers is r5, Search is r7, Brandsis a net of r10 and r11, Journalists is a net of r1 and r6, NewsApps is r8.41%NewsApps18
MEDIA JOURNALISM PLATFORMSAverage trust in traditionaland online-only mediaWhile Trust in Platforms Declines,Trust in Journalism ReboundsAverage trust in search enginesand social media platformsPercent trust in each source for general newsand information, 2012 to 20185956545453Journalism54545452535351515020122013 5-2Platforms20142015201620172018Source: 2018 Edelman Trust Barometer. COM MCL. When looking for general news and information, how much would you trust each type of source forgeneral news and information? Please use a nine-point scale where one means that you “do not trust it at all” and nine means that you “trust it a great deal.”(Top 4 Box, Trust), question asked of half of the sample. General population, 25-market global total.Journalism is an average of traditional media and online-only media. Platforms is an average of search engines and social media.19
MEDIA JOURNALISM PLATFORMSAverage trust in traditionaland online-only mediaJournalism More Trusted ThanPlatforms in 21 CountriesAverage trust in search enginesand social media platformsGap in trust in journalism vs. platforms% Trust inJournalism59c61 c53 c52 c66 c61 c52 c57 c53 c67 c66 c53 c77 c62 c54 c61 c55 c41 c51 c52 c54 c74 c62 c71 c62 c63 c57 c65 c42c21GapPlatformsMore TrustedJournalism More 64586855GermanyIrelandSwedenThe U.S.ChinaArgentinaS. AfricaSpainHong KongJapanRussiaS. MexicoTurkey* ****************************Global 28% Trust inPlatformsSource: 2018 Edelman Trust Barometer. COM MCL. When looking for general news and information, how much would you trust each type of source for general news andinformation? Please use a nine-point scale where one means that you “do not trust it at all” and nine means that you “trust it a great deal.” (Top 4 Box, Trust), questionasked of half of the sample. General population, 28-market global total.Journalism is an average of traditional media and online-only media. Platforms is an average of search engines and social media.20
MEDIA JOURNALISM PLATFORMS Trust in Platforms Decreased in 21 of 28 Countries 0Y-to-Y ChangeAverage trust in search engines and social media platforms, and change from 2017 to 201865% receive newsthrough platformssuch as social mediafeeds, search or newsapplications3333353637Steepestdecline in -8-4-8-4 1-3-4-11-1-8-1-30-1-1-5-6-6 2 4 2-5 6-5 yU.S.CanadaS. AfricaRussiaThe NetherlandsS. KoreaHong llllllllllllllllllllllSource: 2018 Edelman Trust Barometer. COM MCL. When looking for general news and information, how much would you trust each type of source forgeneral news and information? Please use a nine-point scale where one means that you “do not trust it at all” and nine means that you “trust it a great deal.”(Top 4 Box, Trust), question asked of half of the sample. MED NEW CSP. How do you normally get your news? (callout is net of codes 2, 5 and 7),question asked of half of the sample. General population, 28-market global total.Platforms is an average of search engines and social media.21
MEDIA JOURNALISM PLATFORMSHalf DisengagedWith the News502525The DisengagedConsumersAmplifiersConsume newsless than weeklyConsume newsabout weeklyor moreConsume news aboutweekly or more ANDshare or post contentseveral times a monthor more%ConsumptionHow frequently do you consume newsproduced by major news organizations,either at the original source, shared byothers or pushed to you in a feed?%%AmplificationHow often do you share or forward newsitems, or post opinions or other content?Source: 2018 Edelman Trust Barometer. News EngagementScale, built from MED SEG OFT. How often do you engage inthe following activities related to news and information? Indicateyour answer using the 7-point scale below. General population,28-market global total. For details on how the News EngagementScale was built, please refer to the Technical Appendix.22
MEDIA JOURNALISM PLATFORMSSkeptical AboutNews OrganizationsAttractingLarge AudiencesBreaking NewsPolitics66%65%59%are more concernedwith attracting a bigaudience than reportingsacrifice accuracy to bethe first to break a storysupport an ideology vs.informing the publicPercent who agree that newsorganizations are overly focused on Source: 2018 Edelman Trust Barometer. ATT MED AGR. Below is a list of statements. For each one, please rate how much you agree or disagree withthat statement using a nine-point scale where one means “strongly disagree” and nine means “strongly agree”. (Top 4 Box, Agree), question asked of halfof the sample. General population, 28-market global total.23
MEDIA JOURNALISM PLATFORMSUncertainty OverReal vs. Fake NewsPercent who agree that 63%59%The average person does notknow how to tell good journalismfrom rumor or falsehoodsIt is becoming harder to tell if apiece of news was produced by arespected media organizationSource: 2018 Edelman Trust Barometer. ATT MED AGR. Below is a list of statements. For each one, please rate how much you agree or disagree withthat statement using a nine-point scale where one means “strongly disagree” and nine means “strongly agree”. (Top 4 Box, Agree), question asked of halfof the sample. General population, 28-market global total.24
MEDIA JOURNALISM PLATFORMSMedia Failingto Meet ExpectationsTop three trust-building mandates formedia, and percent who say the media isperforming well or very well against themTrust-Building MandatePerformance ScoreGuard information quality36 %Educate people on important issues50 %Inform good life decisions45 %Source: 2018 Edelman Trust Barometer. Trust-building mandates Analysis. The most effective trust building mandates for each institution. INS EXP MED. Below isa list of potential expectations or responsibilities that a social institution might have. Thinking about the media in general, how would you characterize each using thefollowing three-point scale. INS PER MED. How well do you feel the media is currently meeting this obligation to society? Please indicate your answer using the 5point scale below. (Top 2 Box, Performing well), question only asked of those codes 2 or 3 at the expectation question with data displayed only among code 3.General population, 28-market global total. For more details on the Trust-building mandates Analysis, please refer to the Technical Appendix.25
MEDIA JOURNALISM PLATFORMSLack of Confidence in Media Undermining Trust and TruthPercent of respondents who feel they are experiencing theseconsequences as a result of media not fulfilling its responsibilitiesLoss of Trustin Government LeadersLoss of Trustin BusinessI am not sure what is trueand what is notI do not know which politicians to trustI don't know which companiesor brands to trust59%56%42%Loss of TruthSource: 2018 Edelman Trust Barometer. MED CON. What consequences are you experiencing as a direct result of the media not doing a good job fulfillingits responsibilities? Question asked of those 64% who answered codes 1-3 at MED RSP. General population, 28-market global total.26
Navigating aPolarized World
Voices of Authority Regain Credibility0 Y-to-Y ChangePercent who rate each spokesperson as very/extremely credible,and change from 2017 to 2018Person like yourselfat all-time low6361 1-6 4 1-1 3 7 6 12 6JournalistGovernmentofficial/regulator35Board cessfulentrepreneur47Financialindustry analyst50A person likeyourselfTechnical expert 350Academic expert54Source: 2018 Edelman Trust Barometer. CRE PPL. Below is a list of people. In general, when forming an opinion of a company, if you heard informationabout a company from each person, how credible would the information be—extremely credible, very credible, somewhat credible, or not credible at all?(Top 2 Box, Very/Extremely Credible), question asked of half of the sample. General population, 28-market global total.28
Business Is Expected to LeadPercent who agree and percent who say each is one of the mostimportant expectations they have for a CEOPercent who say that CEOsshould take the lead on changerather than waiting forgovernment to impose it64%For CEOs, building trust is job oneTheir company is trusted69Their products and servicesare high quality68Business decisionsreflect company valuesProfits and stock price increaseSource: 2018 Edelman Trust Barometer. CEO AGR. Thinking about CEOs, how strongly do you agree or disagree with the following statements? (Top 4Box, Agree), question asked of half of the sample. CEO EXP. Below is a list of potential expectations that you might have for a company CEO. Thinkingabout CEOs in general, whether they are global CEOs or a CEO who oversees a particular country, how would you characterize each using the followingthree-point scale? (Most important responsibility, code 3), question asked of half of the sample. General population, 28-market global total.646029
DistrustEmployers Trusted Around the World Neutral 0TrustChange, 2016 to 2018Percent trust in employer, and change from 2016 to 808182838690 2-18 12-2 16 2 6 9 12 9-1 21 14-5 14-40 20 110 15-9 19 3-2 3 13ArgentinaFranceTurkeyRussiaSpainIrelandHong KongPolandGermanyS. liaCanadaUAEU.S.MexicoThe NetherlandsChinaColombiaIndiaIndonesia 17JapanGlobal 28 7S. Koreal llllllllllllllllllllllllllllSource: 2018 Edelman Trust Barometer. TRU INS. [YOUR EMPLOYER] Below is a list of institutions. For each one, please indicate how much you trust that institution to do what is right using anine-point scale where one means that you “do not trust them at all” and nine means that you “trust them a great deal.“ (Top 4 Box, Trust) General population, 28-market global total.Note: 2016 data was taken from Q525-526. Thinking about your own company and other companies in your industry, please indicate how much you trust each to do what is right using a 9-pointscale where one means that you “do not trust them at all” and nine means that you “trust them a great deal”. (Top 4 Box, Trust), question asked of half of the sample. General population, 28-marketglobal total.30
Business Must ShowCommitment to Long-TermPercent who agree that 56%60%Companies that onlythink about themselvesand their profits arebound to failCEOs are driven moreby greed than a desireto make a positivedifference in the worldSource: 2018 Edelman Trust Barometer. TMA SIE SHV. Please indicate how much you agree or disagree with the following statements. (Top 4 Box,Agree), question asked of half of the sample. CEO AGR. Thinking about CEOs, how strongly do you agree or disagree with the following statements?(Top4 Box, Agree), question asked of half of the sample. General population, 28-market global total.31
Sector and Home CountryProvide Context for Business Leadership 0 Y-to-Y ChangePercent trust in companies by industry sector and by their country of origin,and change from 2017 to 2018SectorsBiggest Y-to-Y ChangesLeast TrustedMost TrustedTechnology75%Financial Services54%Food and al Services68%Automotive62%CPG-3Countries of OriginBiggest Y-to-Y ChangesLeast TrustedMost 32%U.K.-4Sweden65%Brazil34%Sweden-3Source: 2018 Edelman Trust Barometer. TRU IND. Please indicate how much you trust businesses in each of the following industries to do what is right. Again, please usethe same 9-point scale where one means that you “do not trust them at all” and nine means that you “trust them a great deal”. (Top 4 Box, Trust), industries asked of half ofthe sample. TRU NAT. Now we would like to focus on global companies headquartered in specific countries. Please indicate how much you trust global companiesheadquartered in the following countries to do what is right. Use the same nine-point scale, where one means that you “do not trust them at all” and nine means that you “trustthem a great deal.” (Top 4 Box, Trust), countries asked of half of the sample. General Population, 28-market global total.32
Business Must Address Market DynamicsTrust-building mandates for business in markets with extreme or typical trust changesMarkets with extremeTrust GainsMarkets withTypical Changes in TrustMarkets with extremeTrust LossesMarkets include China, UAE, South KoreaMarkets include Russia, Mexico, U.K., JapanMarkets include U.S., India, Colombia, BrazilInvest in JobsInvest in JobsGuard Information QualityConsumer SafetyEnsure Equal OpportunityConsumer SafetyImprove Quality of LifeSafeguard PrivacySafeguard PrivacyEnsure Competitive WorkforceDrive Economic ProsperityDrive Economic ProsperityInnovateProvide for Future GenerationsInnovateSource: 2018 Edelman Trust Barometer. Trust Volatility Measure. The net year-over-year (2017-2018) percentage point change across the four institutions(TRU INS). General population, 28-market global total. Trust-building mandates Analysis. The most effective trust building mandates for each institution.Mandates not shown in rank order. INS EXP BUS. Below is a list of potential expectations or responsibilities that a social institution might have. Thinkingabout business in general, how would you characterize each using the following three-point scale. General population, 28-market global total. For moredetails on the Trust Volatility Measure and Trust Mandates Analysis, please refer to the Technical Appendix.33
Each InstitutionMust Play its RoleBusinessSafeguard privacyDrive economic prosperityTop trust-building mandates foreach institutionProvide jobs and trainingNGOsMediaSupport the poorGuard information qualityCall out abuses of powerEducate, inform and entertainCreate a sense of communitySafeguard privacyGovernmentDrive economic prosperityInvestigate corruptionSupport the poorSource: 2018 Edelman Trust Barometer. Trust-Building Mandates Analysis. The most effective trust building mandates for each institution. INS EXP GOV;INS EXP MED; INS EXP BUS; and INS EXP NGO. Below is a list of potential expectations or responsibilities that a social institution might have. Thinkingabout [insert institution] in general, how would you characterize each using the following three-point scale. General population, 28-market global total. For moredetails on the Trust Mandates Analysis, please refer to the Technical Appendix.34
2018Edelman Trust BarometerSupplementary Data
Table of Contents1. Trust in institutions, 2018 and change from 20172. Trust in institutions, 2012 to 2018Supplementary Data3. Trust in industry sectors, 2018 and trends from 2012 to 20184. Trust in countries of origin, 2018 and change from 20174
DistrustTrust in NGOsDeclines in 14 of 28 Markets 0Neutral TrustY-to-Y ChangePercent trust in NGOs, and change from 2017 to 2018Distrusted in 10 1616466676871250 4-2 6 19-1 3-130-4-9-9-8-2 6-4-1-3-2 5 1-2 1 60 5 3-30Global lyU.K.AustraliaU.S.CanadaS. AfricaFrancePolandHong KongS. ArgentinaChinaIndonesiaIndiaMexicol llllllllllllllllllllllllllllSource: 2018 Edelman Trust Barometer. TRU INS. [NGOs IN GENERAL] Below is a list of institutions. For each one, please indicate how much you trust that institution todo what is right using a nine-point scale where one means that you “do not trust them at all” and nine means that you “trust them a great deal.“ (Top 4 Box, Trust) GeneralPopulation, 28-market global total.37
DistrustTrust in BusinessIncreases in 14 of 28 Markets 0Neutral TrustY-to-Y ChangePercent trust in business, and change from 2017 to 2018Distrusted in 16 0606468707474780 2 7-1 2 1-7 3-2-1 1-3 3 1-10-1 3-3-1-2-4 400 4 3 70 2Global 28Hong KongS. rmanyAustraliaTurkeySwedenU.S.CanadaSpainS. lombiaUAEMexicoChinaIndiaIndonesial llllllllllllllllllllllllllllSource: 2018 Edelman Trust Barometer. TRU INS. [BUSINESS IN GENERAL] Below is a list of institutions. For each one, please indicate how much you trust thatinstitution to do what is right using a nine-point scale where one means that you “do not trust them at all” and nine means that you “trust them a great deal.“ (Top 4 Box,Trust) General Population, 28-market global total.38
DistrustTrust in GovernmentIncreases in 16 of 28 Markets 0Neutral TrustY-to-Y ChangePercent trust in government, and change from 2017 to 201884Distrusted in 21 6465170737754 2-1-6-8 5-4 4 8-14 9-2 300 8 50 17 3 6 9 10 3-4-5 2 2 8Global 28S. . KoreaCanadaHong iaIndonesiaUAEChinal llllllllllllllllllllllllllllSource: 2018 Edelman Trust Barometer. TRU INS. [GOVERNMENT IN GENERAL] Below is a list of institutions. For each one, please indicate how much you trust that institutionto do what is right using a nine-point scale where one means that you “do not trust them at all” and nine means that you “trust them a great deal.“ (Top 4 Box, Trust) GeneralPopulation, 28-market global total.39
DistrustMedia Now Least Trusted Institution 0Neutral TrustY-to-Y ChangePercent trust in media, and change from 2017 to 2018Distrusted in 22 of 28 of 7484952555671610 5-10-100 4 3 4-4-100-5-5-2 10-3 5 1 4-2 1 12-5 1 6Global dRussiaS. AfricaArgentinaS. KoreaGermanyU.S.BrazilColombiaHong erlandsUAEIndiaIndonesiaChinal llllllllllllllllllllllllllllSource: 2018 Edelman Trust Barometer. TRU INS. [MEDIA IN GENERAL] Below is a list of institutions. For each one, please indicate how much you trustthat institution to do what is right using a nine-point scale where one means that you “do not trust them at all” and nine means that you “trust them a greatdeal.“ (Top 4 Box, Trust) General Population, 28-market global total.40
Trust in 3201220182
for Truth 2018. A Polarization of Trust. Source: 2018 Edelman Trust Barometer. TRU_INS. . Trust) Informed Public and General Population, 28-market global total. 5 Percent trust in each institution, and change from 2017 to 2018 No Recovery in Trust 53 52 41 43 53 52 43 43 67 65 53 53 64 64 5