Transcription
2019AnnualReport
Table of ContentsLetter to Shareowners iMeasures Not Defined byU.S. GAAP 74P&G’s 10-Category Portfolio iiCompany Leadership 76Noticeable Superiority viBoard of Directors 77Constructive Disruption xRecognition and Commitments 78Form 10-K xvCitizenship at P&G Inside Back CoverCompany andShareholder Information 73FINANCIAL HIGHLIGHTS (UNAUDITED)Amounts in billions, except per share amounts20192018201720162015 67.7 66.8 65.1 65.3 70.7Operating Income 5.5 13.4 13.8 13.3 11.1Net Earnings Attributable to P&G 3.9 9.8 15.3 10.5 7.05.9%14.8%15.7%15.4%11.7% 1.43 3.67 3.69 3.49 2.84Diluted Net Earnings per Common Share 1 1.43 3.67 5.59 3.69 2.44Core Earnings per Share 2 4.52 4.22 3.92 3.67 3.76 15.2 14.9 12.8 15.4 14.6 2.90 2.79 2.70 2.66 2.59Net SalesNet Earnings Margin from Continuing OperationsDiluted Net Earnings per Common Share from Continuing OperationsOperating Cash FlowDividends per Common Share12019 NET SALES BYBUSINESS SEGMENT 32019 NET SALES BYGEOGR APHIC REGIONFabric & Home Care33%North America 445%Baby, Feminine & Family Care27%Europe23%19%Asia Pacific10%12%Greater China BeautyHealth CareGrooming9%9%India, Middle East& Africa (IMEA)7%Latin America6%(1) Diluted net earnings per common share are calculated based on net earnings attributable to Procter & Gamble.(2) Core EPS is a measure of the Company’s diluted net earnings per common share from continuing operations adjusted for certain items not viewed as partof our sustainable results. Please see page 74 of the Annual Report for detail on the reconciling items.(3) These results exclude net sales in Corporate.(4) North America includes the United States, Canada, and Puerto Rico.VARIOUS STATEMENTS IN THIS ANNUAL REPORT, including estimates, projections, objectives and expected results, are “forward-looking statements” withinthe meaning of the Private Securities Litigation Reform Act of 1995, Section 27A of the Securities Act of 1933 and Section 21E of the Securities Exchange Act of1934 and are generally identified by the words “believe,” “expect,” “anticipate,” “intend,” “opportunity,” “plan,” “project,” “will,” “should,” “could,” “would,” “likely”and similar expressions. Forward-looking statements are based on current assumptions that are subject to risks and uncertainties that may cause actual resultsto differ materially from the forward-looking statements, including the risks and uncertainties discussed in Item 1A – Risk Factors of the Form 10-K included inthis Annual Report. We undertake no obligation to update or revise publicly any forward-looking statements.
Dear Shareowners,In fiscal year 2019, P&G metor exceeded each of our corefinancial goals — organic salesgrowth, core earnings per sharegrowth and adjusted free cashflow productivity — all whileimproving market share andgenerating leadership levels ofshareholder value creation.Organic sales grew 5%. This was above our going-inestimate and represents significant improvement,with sales by quarter improving sequentially from4% to 4% to 5% to 7%.Core earnings per share were 4.52, up 7% versuslast year and toward the high end of our target range.Foreign exchange was an 8% after-tax earningsheadwind. On a constant currency basis, core earningsper share were up 15%. All-in GAAP earnings per sharewere down versus year ago, reflecting a one-time,non-cash accounting charge to reduce the carryingvalue of the Gillette Shave Care business.Our free cash flow results were very strong. Adjustedfree cash flow was 12.1 billion, with adjusted freecash flow productivity of 105% — well above ourgoing-in target.FISCAL YEAR 20195%Organic Sales7%Core EPS105%Adjusted FreeCash FlowProductivityFISCAL YEAR 2019 ORGANIC SALESGrowing in:9/10All 6Global CategoriesGeographic RegionsGrowth was broad-based in fiscal year 2019 acrossproduct categories, geographies and the keycomponents of top-line growth — volume, priceand mix.Nine of our 10 global categories grew organic saleswith Skin & Personal Care up mid-teens; Fabric Care,Home Care, Feminine Care and Personal Health Careall up high single digits; and Oral Care and Family Careup mid-single digits.All six of our regions grew organic sales with all 15 of ourtop markets growing or holding sales. We continue tomake progress in our largest markets. In the U.S., salesgrew 4%, including 7% in the last quarter. This is afteraveraging about 1% over the past three fiscal years. InGreater China, we grew 10% with double-digit growthacross our Fabric Care, Feminine Care, and Skin &Personal Care categories.In addition, P&G’s global e-commerce organic salesgrew 25% for the year, accounting for about 8% ofour total sales.This breadth of top-line growth across categories,countries and components provides confidence inour ability to grow at or above market growth ratesgoing forward.
ii The Procter & Gamble CompanyOur strong market share trends support this. Eight of 10global categories held or grew value share and 33 of ourtop 50 country/category combinations held or grewshare, up from 26 last fiscal year, 23 in fiscal 2017 andjust 17 in fiscal 2016.TOP 50 COUNTRY/CATEGORY COMBINATIONSGROWING OR HOLDING MARKET ioWe’ve focused and strengthenedP&G's portfolio in daily-use categorieswhere product performance drivesbrand choice, and in categorieswhere we have a number one or twoshare position — categories that havehistorically grown faster than thebalance of the Company and havedone so more profitably.FY19We returned 12.5 billion of cash to shareownersthrough a combination of share repurchases anddividends. We announced a 4% increase in thedividend — the 63rd consecutive annual increase andthe 129th consecutive year in which P&G has paid adividend. P&G is one of only 10 U.S. companies to paya dividend for more than 120 consecutive years, andonly three U.S. companies have increased dividendsmore consecutive years than P&G.HEALTH CARERETURNING VALUE TO SHAREHOLDERS129yearsOf dividendpayments63yearsOf dividendincreases 135 billionPersonal Health CareValue returned toshareholders(past decade)** T hrough dividend payments and share repurchases/exchanges combinedOral Care
The Procter & Gamble Company iiiFABRIC AND HOME CAREBABY AND FEMININE CAREFabric CareBaby CareHome CareFeminine CareBEAUTYFAMILY CARE AND P&G VENTURESHair CareFamily CareGROOMINGSkin & Personal CareGrooming
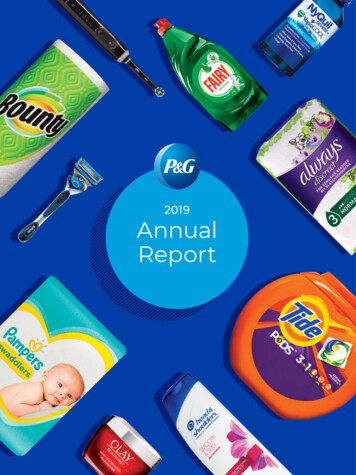
iv The Procter & Gamble CompanyThe benefits of the portfolio choices we made afew years ago are clearly paying out — focusing andstrengthening our portfolio in daily-use categorieswhere performance drives brand choice — in categorieswhere we occupy a number one or two share position,which have historically grown faster than the balanceof the Company and done so more profitably. Daily-usecategories are important to our retail partners as theydrive shopping trips and consumer loyalty is oftenhigher. We’re selectively strengthening our portfoliowith acquisitions designed to augment our currentofferings. For example, we completed the acquisitionof the Merck KGaA Consumer Health business, whichsignificantly enhances our international presence inpersonal health care.Altogether, it was a good year with much-improvedorganic sales and share growth, strong constantcurrency core earnings per share growth, and acontinued, best-in-class track record of cash returnto shareowners. All of this was delivered while workingto address several category-specific challenges and ina difficult external environment, characterized byvolatile and challenging government policies, retailtransformation, rising input and transportation costs,and highly capable competition.While we’re making good progress, we still have workto do to deliver sustained, strong results — balancedtop- and bottom-line growth and value creation. Weknow we need to continue to raise the bar to keep ourmomentum going.We are focused on winning with consumers. That’s job#1 — winning with consumers and shoppers throughsuperiority, fueled by productivity, and delivered by anempowered, agile and accountable organization that isdriving constructive disruption across the entire valuechain in our industry.Superiority to Winwith ConsumersOur strategy starts with noticeable superiority acrossall elements of our consumer proposition — products,packaging, brand communication, retail execution(in-store and online), and consumer and customer value.This strategic choice is holistic. It recognizes thatconsumers don’t focus on one element of a brandonly. Consumers interact with the whole brand — theproduct, package, what we say and how they feel aboutthe brand, how they experience it in the store or online,and whether it truly creates value versus the alternativeshe or she has. When these elements are taken together,they drive category growth, prevent commoditization,and provide the basis to build sustainable competitiveadvantage. Notably, when we deliver superiority on fouror more of the five vectors, we drive all business successmetrics: sales, profit, value share, household penetrationand category growth.Category growth is an important point of emphasis.Category growth leads to sales growth that is typicallymore sustainable than simply taking business from acompetitor, and it creates a winning proposition forour retail partners. Importantly, where we grow ourcategories we disproportionately and sustainablybuild share.We completed the acquisition of the Merck KGaA ConsumerHealth business, which significantly enhances our internationalpresence in personal health care.Take P&G U.S. Fabric Care: over the last 40 years, we’vegrown sales by five times. That’s 500% in a market thathas grown 400%. Category growth has been the maindriver of P&G’s growth, which we’ve achieved throughindustry-leading superiority. As a result, our share of theU.S. laundry category has grown five points.
The Procter & Gamble Company vFIVE ELEMENTS OF SUPERIORITYSUPERIOR PRODUCTSProducts so good, consumersrecognize the difference.SUPERIOR PACKAGINGPackaging that attractsconsumers, conveys brandequity, helps consumersselect the best product fortheir needs, and delightsconsumers during use.There are many examples of P&G brands drivingcategory growth in key markets, including Tide/ArielPODS, Gain Flings, Downy/Lenor Scent Beads, Cascade/Fairy Platinum ActionPacs, Bounty paper towels, SK-IIskin care, Always Radiant, Always Discreet, PampersPure Protection, Oral-B GENIUS, Gillette SkinGuardand Vicks VapoCOOL, among others. The point is,superiority works, and it drives category growth.One element of superiority we’ve put a lot of workagainst is retail execution, and it’s paying off. P&G isranked #1 globally in the 2018 Advantage Report, anindependent retailer assessment of manufacturers.While we appreciate this recognition, what reallymatters is retailers’ improved view of P&G as a partnerin joint value creation, which leads to strongerdistribution, share of shelf, display and feature.We will continue to increase the quality of ourexecution and to extend our margin of advantageacross all elements of superiority, which requiresongoing investment.SUPERIOR BRANDCOMMUNICATIONProduct and packaging benefitscommunicated with exceptionaladvertising that makes youthink, talk, laugh, cry, smile,act and buy — and that drivescategory and brand growth.SUPERIOR RETAILEXECUTIONIn-store: with the right storecoverage, product forms, sizes,price points, shelving andmerchandising. Online: withthe right content, assortment,ratings, reviews, search andsubscription offerings.SUPERIOR CONSUMER& CUSTOMER VALUEFor consumers: all theseelements presented in aclear and shoppable way ata compelling price. Forcustomers: margin, pennyprofit, trip generation, basketsize, and category growth.
vi The Procter & Gamble CompanySUPERIORPACKAGINGNoticeableSuperiority to Winwith ConsumersTogether, these five elements drivecategory growth, prevent commoditizationand provide the basis to build sustainablecompetitive advantage.Olay CELLSCIENCEOlay CELLSCIENCE’s super-peptideformula and prestige-inspiredpackaging was specifically designed forChina’s discerning beauty consumers,who shop in one of the world’s mostcontested, premium skin care markets.This consumer-led innovation helpedOlay deliver two consecutive years ofstrong double-digit organic salesgrowth in China.See more examples atwww.pg.com/annualreport2019SUPERIOR BRANDCOMMUNICATIONSUPERIORPRODUCTSAriel and Tide PODSSK-IIOur latest upgrade to Ariel andTide PODS delivers excellent resultsin a quick and cold wash — both aperformance and a sustainabilitybenefit. Globally, we’re growingorganic sales of liquid laundrypackets double digits, leadinggrowth of the overall laundrydetergent category.SK-II has grown organic sales doubledigits for four consecutive years by forginghuman connections with consumersthrough disruptive brand building andbold storytelling like the #BareSkinProject.It celebrates the beauty of bare skin —powered by SK-II and PITERA — to combatthe belief of nearly half of womenwho say they must wear makeup tofeel confident.BountyBounty — the “Quicker Picker Upper” —has consistently increased its margin ofsuperiority, with proprietary technologythat delivers strength and is 2x moreabsorbent vs. the leading ordinarybrand. The category grew mid-singledigits in fiscal 2019 with Bounty’s NorthAmerica organic sales growing midsingle digits and share growing overhalf a point.
The Procter & Gamble Company viiSUPERIOR RETAILEXECUTIONAdvantage ReportCustomers recognize our efforts inretail execution. For the fourth yearin a row, P&G has been ranked the #1manufacturer globally. We’ve reached#1 in each key performance area inthis independent retailer assessment:strategic alignment, people, categorydevelopment, consumer marketing,trade & shopper marketing, supplychain and customer service.ManufacturerGloballyScent BeadsOur scent beads packaging showsthe product and communicates thescent benefit with a distinctive
Our strategy starts with noticeable superiority across all elements of our consumer proposition — products, packaging, brand communication, retail execution (in-store and online), and consumer and customer value. This strategic choice is holistic. It recognizes that consumers don’t focus on one element of a brand only. Consumers interact with the whole brand — the