Transcription
Six Sigma Basics
Learning ObjectivesAt the end of this module, you will be able to: Recognize that Six Sigma is a valuableapproach for improving process quality Interpret a basic Statistical Process Controlchart Distinguish between process and specifiedcontrol limits Describe a capable processSix Sigma Basics V7.6 - Slide 2 2012 Massachusetts Institute of Technology
What is Six Sigma? A Strategy to improve process quality byidentifying and eliminating defects andminimizing variation in process outputs A data driven approach based on Measurementof the process variation using StatisticalProcess Control A structured Implementation approach basedon a DMAIC cycle and certified expertsThe goal of Six Sigma is to reduce process variationSix Sigma Basics V7.6 - Slide 3 2012 Massachusetts Institute of Technology
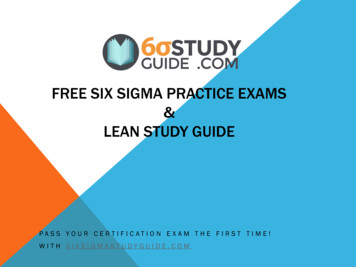
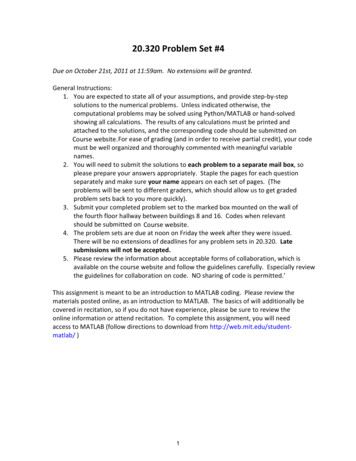
Standard Normal DistributionCurveSome notable qualities of thenormal distribution:Sigma (σ) one standarddeviation The mean is also its mode andmedian. 68.27% of the area (green) iswithin one standard deviation ofthe mean.1 34.1% 95.45% of the area (green &yellow) is within two standarddeviations.2 13.6%0.1%2.1%3 99.73% of the area (green &yellow & red) is within threestandard deviationsSix Sigma Basics V7.6 - Slide 4 2012 Massachusetts Institute of Technology
Defects “Defect” is defined as any process output that does not meet the customer‟s specifications.Improving quality means reducing the defectsper million opportunities (DPMO). There aretwo attributes to this metric that can becontrolled: Opportunities – reducing the number of steps, handoffs and other “opportunities” will helpimprove qualityDefects – reducing the number of defects foreach process step through continuous processimprovement will help improve qualitySix Sigma Basics V7.6 - Slide 5 2012 Massachusetts Institute of Technology
Six Sigma – Practical Meaning99.99966% GOOD (6 Sigma)99% GOOD (3.8 Sigma) 20,000 lost articles of mail Seven articles of mail lost per hourUnsafe drinking water foralmost 15 minutes per day5,000 incorrect surgicaloperations per weekTwo short or long landingsat most major airportseach day200,000 wrong drugprescriptions each yearNo electricity for almostseven hours each month per hourOne unsafe minute everyseven months1.7 incorrect operationsper weekOne short or long landingevery five years 68 wrong prescriptions each yearOne hour withoutelectricity every 34 yearsSix Sigma Basics V7.6 - Slide 6 2012 Massachusetts Institute of Technology
Statistical ProcessControl Control charting is the primary tool of SPC Control charts provide information about thestability/predictability of the process,specifically with regard to its: Central tendency (to target value)Variation SPC charts are time-sequence charts ofimportant process or product characteristicsSix Sigma Basics V7.6 - Slide 7 2012 Massachusetts Institute of Technology
ClassExercise Pharmacy wants to monitor the dispensing of doses ofWhite Bean MedicineA 3 cup sample will be taken each day and weighed andrecorded on a check sheetData will be entered into two control charts (one for meansor averages and one for range)Data for the first twenty days will establish the currentprocess capabilityFrom then on, the pharmacy will monitor the dosages byentering daily samples into the control chartProcess improvements will be made as needed, basedupon data collected.Six Sigma Basics V7.6 - Slide 8 2012 Massachusetts Institute of Technology
What To DoPhase IProcessCapability Select three cups with the samesample number (day) Weigh each on the digital scaleRecord the data on the checksheet form and calculate the mean(average) and report the results tothe instructor Also report the lowest and highestweights for each day. Calculaterange highest - lowestSix Sigma Basics V7.6 - Slide 9 2012 Massachusetts Institute of Technology
Six Sigma Process - DMAICDefine Who are the customers and what are their requirements Identify key characteristics important to the customerMeasure Categorize key input and output characteristics, verifymeasurement systemsCollect data and establish the baseline performance Analyze Convert raw data into information to provide insightsinto the processImprove Develop solutions to improve process capability andcompare the results to the baseline performanceControl Monitor the process to assure no unexpected changesoccurSix Sigma Basics V7.6 - Slide 10 2012 Massachusetts Institute of Technology
Simple DMAIC essMeasurement SystemImproveMeasureAnalyze DMAIC is easy to see in process control applications The same steps can be used to analyze more complexsystems, often in tandem with lean toolsSix Sigma Basics V7.6 - Slide 11 2012 Massachusetts Institute of Technology
Types of Process Variation Common Cause Variation is the sum of many„chances causes,‟ none traceable to a singlemajor cause. Common cause variation isessentially the noise in the system. When aprocess is operating subject to common causevariation it is in a state of statistical control. Special Cause Variation is due to differencesbetween people, machines, materials, methods,etc. The occurrence of a special (or assignable)cause results in an out of control condition.Control charts provide a means for distinguishing betweencommon cause variability and special cause variabilitySix Sigma Basics V7.6 - Slide 12 2012 Massachusetts Institute of Technology
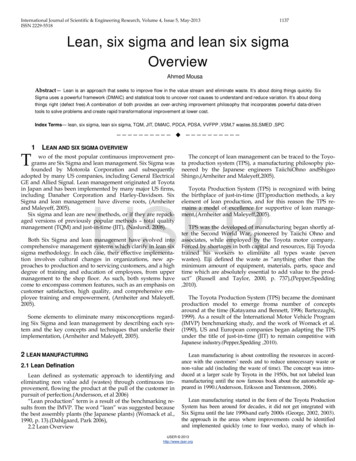
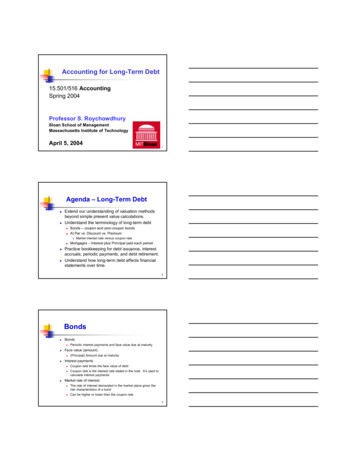
Control Chart Example Patient FallsUCLLCLPhase I – EstablishProcess CapabilityReference: National Quality Measures Clearing iew.aspx?id 16454Phase II – Monitorthe ProcessSix Sigma Basics V7.6 - Slide 13 2012 Massachusetts Institute of Technology
What To DoPhase II Process Monitoring Draw control limits on your chartbased on the first 20 samples.UCL Weigh a new sample (3 cups),record the data on the 2nd checksheet and calculate the averageand range. Plot the average and range onthe charts, and decide if theprocess is in control. If the process goes out ofcontrol, stop and investigate thecause using a fishbone diagram.LCLSix Sigma Basics V7.6 - Slide 14 2012 Massachusetts Institute of Technology
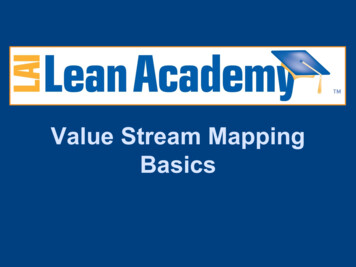
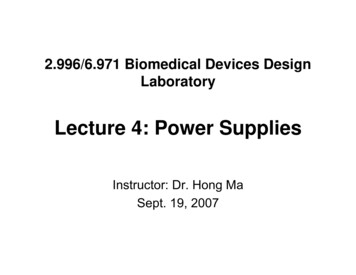
Control Chart Example c Chart for Resident FallsCourtesy of Faten Mitchell, Quality Improvement Advisor, Health Quality Ontario. Used with permission.Source: Faten Mitchell, Quality Improvement Advisor, Health Quality OntarioSix Sigma Basics V7.6 - Slide 15 2012 Massachusetts Institute of Technology
Process Improvement andControl Charts - StartingInputProcessOutputMeasurement System In early stages, control charts (usually on output variables)are used to understand the behavior of the processAfter corrective actions, place charts on critical inputvariablesSix Sigma Basics V7.6 - Slide 16 2012 Massachusetts Institute of Technology
Process Improvement andControl Charts - SustainingInputProcessOutputMeasurement System The goal: Monitor and control inputs and, over time,eliminate the need for SPC charts by havingpreventative measures in placeIf a chart has been implemented, remove it if it is notproviding valuable and actionable informationSix Sigma Basics V7.6 - Slide 17 2012 Massachusetts Institute of Technology
Process Capability “Process Capability is broadly defined as theability of a process to meet customerexpectations” (Bothe, 1997) Once we have a process in control then we cananswer the question of whether the process iscapable of meeting the customer‟sspecifications.Six Sigma Basics V7.6 - Slide 18 2012 Massachusetts Institute of Technology
Customer and ProcessQuality Defined Process Quality is a measure of the capability ofa process to produce to its expected capability The upper and lower values between which theprocess must be controlled are known asupper and lower control limits (UCL and LCL)Customer Quality is the conformance tocustomer specifications within a tolerance band The upper and lower values that the customeris willing to accept are known as upper andlower specification limits (USL and LSL)How can we assure Process Capability?Six Sigma Basics V7.6 - Slide 19 2012 Massachusetts Institute of Technology
Assessing Process CapabilityCp, a term used to defineprocess capability, ismathematically expressedby:BadBadThe figure shows centereddistributions with variousCp levels. Note Cps lessthan two have visible tailsoutside the acceptable limits.Six Sigma Basics V7.6 - Slide 20 2012 Massachusetts Institute of Technology
Non-Centered DistributionsIf the distribution is off center,the probability of a bad resultdrastically increases. In thiscase Cpk is used. It is thesmaller ofCenterorVeryBadThis figure shows the samedistributions off-center by1.5 . The Cpks are smallerthan the corresponding Cps.This illustrates the need toboth control variation andaccurately hit the desiredmean.Six Sigma Basics V7.6 - Slide 21 2012 Massachusetts Institute of Technology
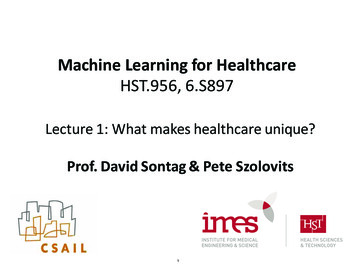
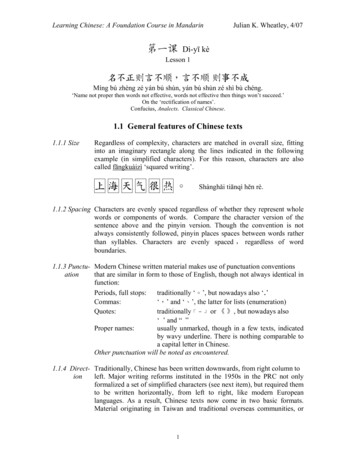
In this case, the shooter(archer) has a bad eye –the shots are widelydispersed and slightly offcenterCp versus CpkCp is highCpk is highCp is lowCpk is lowIn this case, the shooter(archer) has a good eye,but all the shots are offcenterIn this case, the shooter(archer) has a good eye,and has now adjusted thegun (bow) sight to bring theshots on targetCp is highCpk is lowSix Sigma Basics V7.6 - Slide 22 2012 Massachusetts Institute of Technology
Implications of a Six SigmaProcessSix Sigma is defined as 3.4 defects per millionopportunities, or a first pass yield of 7,311Process MeanShifted 1.5 70-0.17697,672With a Six Sigma process even a significant shiftin the process mean results in very few defectsSix Sigma Basics V7.6 - Slide 23 2012 Massachusetts Institute of Technology
Wrap Up Six Sigma is an effective quality system Widely deployed in manufacturing Actively being pursued in healthcare Control charts are an effective visual aid inmonitoring process capability Other SPC analysis tools are available If “customer” specifications for process quality(USL, LSL) can be established, Six Sigmamethods can help achieve desired outcomes.Six Sigma Basics V7.6 - Slide 24 2012 Massachusetts Institute of Technology
Reading ListBertels, T. Ed, Rath & Strong’s Six Sigma Leadership Handbook,John Wiley & Sons, 2003.Bothe, D.R., Measuring Process Capability, 1997Gitlow, H.S. and Levine, D.M., Six Sigma for Green Belts andChampions, Foundations, DMAIC, Tools, Cases, andCertification, Prentice Hall (Pearson Education, Inc.) 2005Harry, M. and Schroeder, R., Six Sigma, Currency Doubleday,New York, 2000Henderson, G.R., Six Sigma Quality Improvement with Minitab,John Wiley & Sons, 2006.Ledolter, J. and Burrill, C.W., Statistical Quality Control,Strategies and Tools for Continual Improvement, John Wiley &Sons, Inc., 1999Six Sigma Basics V7.6 - Slide 25 2012 Massachusetts Institute of Technology
AcknowledgementsContributors Dick Lewis – Rolls-Royce (ret.) Jose Macedo – Cal Poly, San Luis Obispo Hugh McManus – Metis Design Earll Murman – MIT Steve Shade – Purdue UniversityCollaborators Faten Mitchell – Health Quality Ontario Jack Reismiller – Rolls-Royce Six SigmaMaster Black Belt Julie Vannerson – Indiana UniversitySchool of MedicineSix Sigma Basics V7.6 - Slide 26 2012 Massachusetts Institute of Technology
MIT OpenCourseWarehttp://ocw.mit.edu16.660J / ESD.62J / 16.853 Introduction to Lean Six Sigma MethodsIAP 2012For information about citing these materials or our Terms of Use, visit: http://ocw.mit.edu/terms.
The mean is also its mode and median. 68.27% of the area (green) is within one standard deviation of the mean. 95.45% of the area (green &