Transcription
Your Food Choices andCarbon FootprintRobert A. Kluson, Ph.D.Ag/Natural Resources Extension Agent IIUF/IFAS - Sarasota County Extension
Outline What food choices are we talking about? Concepts of carbon footprint and food systems Carbon emissions information aboutfood choices Food choice-based solutions
What Foods Are We Talking About? “WhatThe World 07,1626519,00.html– A photograph essay of diets from around the world– Shows quantity consumed in 1 week by an averagefamily– Shows differences in food variety Food groups Food systems - e.g., extent of food processing,packaging, etc
What The World 1626519,00.htmlItaly
What The World 1626519,00.htmlJapan
What The World 1626519,00.htmlChad
What The World 1626519,00.htmlKuwait
What The World 1626519,00.htmlUSA
What’s the Beef? Whatis the problemwith your food choices?
Food Has A Carbon Footprint What’sa CarbonFootprint ?– the amount of carbondioxide - a potentgreenhouse gas — that isgiven off from burningfossil fuels for lifestyleactivities– becomes larger withincreasing carbonemissions
Making Visible A Carbon FootprintThe carbon footprint for one personin the US is 22 tons of CO2 per year.
Food Carbon Footprint Foodsystems produce carbon emissionsdue to use of fossil fuels Food Carbon Footprint is part of thetotal carbon footprint of an individual,organization, and/or country Food choices are changing globally andimpacting total carbon footprints
What’s The Story w/ Carbon Emissions? Carbon emissions are greatly increasingdue to man-made causes and activities Increased carbon emissions have increasedthe atmospheric CO2 concentration
Carbon Cycle is Global
So what?
How Much Global WarmingDo You Mean?We are hereTemperaturesare projectedto rise anadditional2 – 5 C in the21st Century
Global Warming vs. Climate Change Global Warming- an increase in average global temperature as influencedby increased greenhouse gas concentrations withoutregard to other factors that may cause climate change Climate Change- changes in the atmosphere over time scales rangingfrom weeks to decades to millions of years.- vary by natural processes internal to the Earth (e.g.,continental drift), external forces (e.g., solar energy),and human activities which affect global wind patterns,rainfall, and temperatures.
Who Says So ? TheNational Academies of Science of theInternational Community, including USA Intergovernmental Panel on ClimateChange - IPCC
What does this Change inClimate mean?“Many of the world's climate zones may disappearby 2100, leaving new ones in their place unlike anythat exist today”“.we are going to be seeing climates that certainlyare completely outside the range of modernhuman experience."Source 2007 Articles: 26 March Scientific American; 27 March Guardian; 27 March IOL Reuters
So What? Climate change can affect world markets– Crop yields, prices, energy demandPotential for greater weather extremes– Drought, hurricanes, blizzards, floodsBiodiversity– Changes in the range of plants and animals(can they move fast enough?)Sea level rise (lots of the world’s population livesat low elevation)Health impacts (e.g., infectious diseases, heatrelated illnesses, and accidents/injuries)
Projected Impacts on FloridaAgriculture- Growing seasons changes due to reversal ofsummer-wet, winter-dry weather patterns- New animal and plant disease vectors- Increased “risk” of production- Changes in food crops and production areas
What Will Present Florida AgricultureLook Like With Climate Change?
Sea Level Rises Impacts onPresent Agricultural AreasExpected sea level increase 21st Century: 1.2 meterDark Blue Florida 5 meter, unavoidable without action. Light Blue,Florida 10 meter, avoidable with action
Total C Footprint by Country(2002) TheUSA carbon footprint is the highest in the worldWorld Resources Institute (WRI).http://www.wri.org/
Map of Total C EmissionsInventories In the ew-co2-maps-offer-unprecedented-detail/
Florida’s Relative Total C Footprint
Sarasota County Food SystemCarbon Footprint Factors Numberof miles your food travels fromfarm to plate Otherfactors:– how is your food produced?– what are your food category choices?
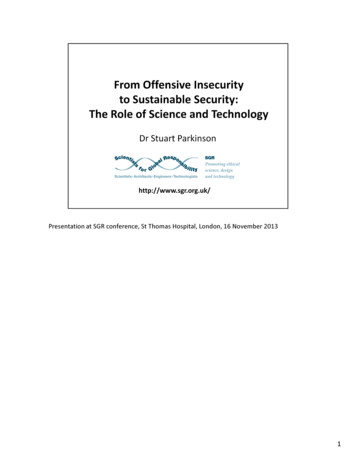
Statistics of Average U.S. FoodCarbon Footprint Per Household Amount– 8.1 metric tons of greenhouse gasesannually from food consumption choices Sources– Food industry transportation - 11% conventional production& harvesting - 83% final delivery from producerto retail – 4%– Food types are different – see chartWeber, C. and H. Matthews. 2008. Food-Miles and the RelativeClimate Impacts of Food Choices in the United States Environ.Sci. Technol., 42 (10): i/esthag/2008/42/i10/abs/es702969f.html
Food Carbon Footprint Analysis*Different Greenhouse Gases fromDifferent Food Groups*Weber, C. and H. Matthews. 2008. Food-Miles and the Relative Climate Impacts of FoodChoices in the United States Environ. Sci. Technol., 42 (10): i/esthag/2008/42/i10/abs/es702969f.html
Statistics of Average U.S. FoodCarbon Footprint Per Household What are the conclusions of the food carbonfootprint facts from this report?– Are food miles the greatest factor? No!Purchasing local foods is only a partial solution.– What is the greatest factor? How the food is produced! Purchasing foods that are produced using sustainableand organic agriculture practices is a better solution. What’s the best solution?– Purchase local, organic foods!– Choose food categories with reduced total footprints.
Food Carbon Footprint AnalysisHow Is It Done? Calculated at the Food System Level In other words, the Analysis of the Who, What,Where, When, Why and How of Our Food Gets Fromthe Farm to Our PlateEarthFriends. 1995. The Whole Story of Food
Food Carbon Footprint AnalysisCheese ExampleCalculate the carbon & equivalent gas emissions at each stage:1.2.3.4.5.6.7.8.9.Factories manufacturing fertilizer use a fuel-intensive process that emits CO2Excess fertilizer applied to fields produces nitrous oxide, which has 296 timesthe warming potential as CO2Corn, used for feeding cows, is harvested, processed, trucked and stored, all ofwhich use CO2-emitting equipmentA cow belches annually 145 pounds of methane, which has 23 times thewarming potential of CO2Refrigeration, production and packaging of cheese use CO2-emitting equipmentTransporting the cheese requires refrigeration equipment as well as vehicles thatemit CO2At the supermarket, the cheese is displayed in CO2-emitting containersConsumers travel to food stores and then go home and store the cheese in arefrigerator, and both activities emit CO2Cheese that is thrown out gets to a landfill which generates methane and CO2K. Weiss. April 22, 2008. Treading Lighter With Low Carbon Diets. Los Angeles /me-lowcarbon22
Food Carbon Footprint AnalysisCheeseburger Example View the Video Go to the eburger footprint the vid.html Estimates for the average American diet range fromone to three per week, or about 50 to 150 per year. Annual greenhouse gas emissions from the production and consumptionof cheeseburgers is estimated as the amount emitted by 6.5 million to19.6 million SUVs. Today 16 million SUVs are on US roads.http://www.openthefuture.com/cheeseburger CF.html
Conventional Animal AgribusinessFood Carbon Footprint Factors Animal agriculture sector accounts forapproximately 9% of total CO2 emissions, whichare primarily the result of fertilizer production forfeed crops, on-farm energy expenditures, feedtransport, animal product processing and transport,and land use changesEscalating farm animal populations—in large,confined operations, in particular—havesignificantly increased methane emissions fromboth animals and their manureKoneswaran & Nierenberg, 2008, Global Farm Animal Production & Global Warming,Env. Health Perspectives May .fcgi?artid 2367646
Conventional Animal AgribusinessFood Carbon Footprint Factors Cattle confined in feedlots or in intensive confinementdairy operations are fed an unnatural diet of concentratedhigh-protein feed consisting of corn and soybeans. Thisdiet may also lead to increased methane emissionsFarm animal manure is the source of methane emissions &increases are attributed to trend toward housing dairy cowsand pigs in larger facilities that typically use liquid manuremanagement systemsKoneswaran & Nierenberg, 2008, Global Farm Animal Production & Global Warming,Env. Health Perspectives May .fcgi?artid 2367646
Supportive Analysis:Sarasota Ecological Footprint (2004)DEMAND – Footprint percapita in Sarasota CountyGlobal acres/capitaSUPPLY – Biocapacity perSarasotanGlobal acres/capitaAbsorbing CO² from fuel use13.2Land reserved for CO²0.2Growing Crops3.8 *Cropland0.1 *Grazing Animals0.5 *Grazing Land0.2 *Harvesting Timber3.0 *Forest Area0.5 *Accommodating Roads,Houses & Infrastructure1.1Built-up Area1.1Fisheries0.6 *Fishing Area0.1 *TOTAL – biocapacity used(not including space forbiodiversity)22.2(7.9 *)* food systemTOTAL – existing biocapacity2.1(0.9 *)* food system
Sarasota Ecological Footprint:Food System Results & Recommendations 36%of required biocapacity is for ouragriculture-based needs To provide for our county’s food needs,each household would need to manage an11 and 1/2 acre farm. Solutions:– Buy locally grown food– Eat more vegetables and grains and less meat– Buy sustainable agriculture produced food
Food Choice-Based Solutions LocalFood System Development Sustainable LocalAgricultureAg Policies for Reduced FoodBased Carbon Emissions
Current Food System Today in current foodsystems an average fooditem in the U.S. travels1,500 miles * – up to 25%farther than in 1980 Local food systemdevelopment reducesthe distance toapproximately 56 milesR.Pirog. 2003. Checking the Food Odometer. 2003. Leopold Center, ISU.www.leopold.iastate.edu/pubs/staff/files/food travel072103.pdf
Shorter Food Mileage MeansLess Fossil Fuel UsageGasoline is 85.5% carbon1 gallon of conventional gasoline becomes172 cubic feet / 4.87 cubic meters of CO2
Current Food System and Energy1 Can of Corn Example process, package &Energy required to produce,distribute is 6Xs the food energy contained in that cornPackaging alone uses more than 2Xs the energy ofproductionDriving the corn home from the store and preparing italso uses more energy than production
Sustainable Local Food SystemHealthy Food ProductionThe Goal:Integrated into Community Restore Stepsfor Entire FoodSystemCompostand otherproductsFood Preparation andConsumption(Nutritious and Healthy)Local FoodDistribution Channels
How Do You Define Sustainable? Recognitionof the whole systems natureof food, feed, & fiber production Equitably balancing concerns of– environmental soundness– social equity– economic viability Functional interactions betweenagroecological & social/economic systemsS.Gliessman, 1998, Agroecology: Ecological Processes in Sustainable Agriculture
“How Do You Define Local?” Foods from a determined radius from your home(commonly either 100 or 250 miles) or100 Mile Diet, http://100milediet.org/;Food Routes, http://www.foodroutes.org/ Within a day's leisurely drive of our homes orJoan Dye Gussow. 2006. This Organic Life. Determined by the consumer with informationabout geographic origin of food.Florida Association of Community Farmers’ Markets (FACFM)
Solution Example:Local Sarasota Food MarketsJessica’s Organic FarmFarmers Markets:Downtown SarasotaLakewood RanchVeniceEnglewoodSiesta KeySarasota FarmsOn-Farm Sales& Community Supported Farms
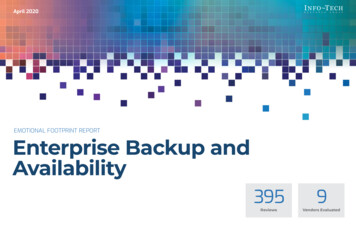
Solution Example:Consumer EcoLabels ofFood Carbon FootprintsRenewable Energy UseLabel by Frito-Lay forSunChips Snacks- Global Business Insights. Future of Ethical Foods & Drinks. g0167m.pd.- J. Faludi. Toward An EcoLabel, Package Design Magazine /eco label.shtmlPrototype EcoLabelfor ComprehensiveCertification, IncludingCarbon Footprint
Solution Example:Consumer EcoLabels ofFood Carbon FootprintsThe final carbon footprintcalculation is 75g for abag of their chips. The flow-chart on this page shows exactlywhat percentage of our carbon footprint iscalculated at each stage:1: Our raw materials: Potatoes, sunflowersand seasoning2: Manufacture: Producing crisps frompotatoes3: Packaging our crisps4: Distribution: Bringing our crisps to you5: Disposal of the empty rs carbon footprint.html
Solution Example: InstitutionalLocal Food Purchase Policy Bon Appetit food service company policy– buy more food produced within 150 miles of whereit's served– serve food that is seasonally available, e.g., tomatoslices on burgers– substitute potato salad made with locally grown,organic potato and olive oil for cooked frozen frenchfries– buy meat or poultry, bottled water, vegetables & fruitonly from North America, except tropical itemsNess, C. One Buger-Hold the Carbon, San Francisco Chronicle, April 18, 2007http://www.sfgate.com/cgi-bin/article.cgi?f /c/a/2007/04/18/FDG0SP96IM1.DTL
Food Choice-Based Solutions*Sustainable Agriculture* Satisfy human food and fiber needsEnhance environmental quality and the naturalresource baseEfficient use of nonrenewable resources andon-farm resources and integrate, whereappropriate, natural biological cycles andcontrolsSustain the economic viability of farmoperationsEnhance the quality of life for farmers andsociety as a whole."Source: 1990 Farm Bill Definition
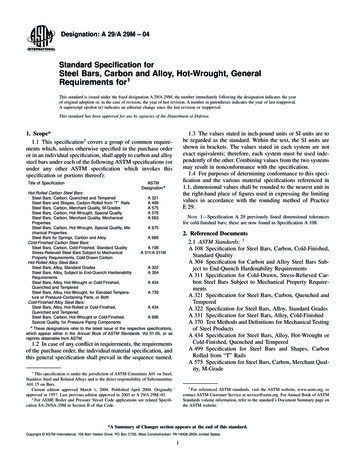
Sustainable Agriculture Example:Organic Farming & Foods
Organic AgricultureFood Carbon Footprint Factors Organicallymanaged soils can store(sequester) more than 1,000 pounds ofcarbon per acre, while non-organic systemscan cause carbon loss * Organic farms have low outside inputs forfuel and soil amendments which reducetheir carbon footprint* Rodale Institute, 2008http://www.rodaleinstitute.org/global warming
Food Choice-Based SolutionsLocal Policy Initiatives 2006New Agriculture Policies in SarasotaCounty Comprehensive Plan– Sarasota Agriculture Policy Council (SAPC) Provides broad community food system representation Originator of recommendations that were adopted as2006 Ag Policies– Based on promoting sustainable agriculture local food system development farmland protection
Sarasota Ag Policy Opportunities SarasotaCounty Comprehensive PlanAgriculture Policies– Implementation is required Join and participate in SAPC Incentives need to be identified, such as marketdriven, profitable approaches Promote“Community Food SystemAssessment” for Expanded CarbonEmissions Inventory of Sarasota County
Sarasota Ag Policy Opportunities Woodbury County, Iowa, Model– County policy incentives to promote certified organic farming: property tax rebates (5 years)local foods purchasing policy– View the videoGo to webpage:http://web.mac.com/marqusee/Woodbury Organics/Main.html Implement similar incentives for locally grown, organicfoods in Sarasota County?
Food For Thought “Eatingis an agricultural act . . .”- Wendell Berry “Eatingis a political act . . .”– Alice Waters Calculateyou food carbonfootprint on the websitehttp://www.foodcarbon.co.uk/index.html
Estimates for the average American diet range from one to three per week, or about 50 to 150 per year. Annual greenhouse gas emissions from the production and consumption of cheeseburgers is estimated as the amount emitted by 6.5 million to 19.6 million SUVs. Today 16 million SU