Transcription
REVIEW OF SCIENTIFIC INSTRUMENTS 79, 013708 共2008兲A novel high-throughput scanning microscope for label-free detectionof protein and small-molecule chemical microarraysY. Y. Fei, J. P. Landry, Y. S. Sun, and X. D. Zhua兲Department of Physics, University of California at Davis, Davis, California 95616, USAJ. T. Luo, X. B. Wang, and K. S LamDivision of Hematology and Oncology, Department of Internal Medicine, UC Davis Cancer Center,University of California at Davis, Sacramento, California 95817, USA共Received 31 August 2007; accepted 10 December 2007; published online 17 January 2008兲We describe a novel scanning optical microscope based on a polarization-modulated nullingellipsometry. The new microscope employs a combination of scanning mirror and sample translationand thus enables high-throughput label-free detection of biomolecular microarrays with more than10 000 protein or small-molecule targets. For illustration, we show the image of a 2760-spot proteinmicroarray on a functionalized glass slide obtained with such a microscope. The new scanningmicroscope is also capable of determining, in parallel, the real-time binding kinetics of multiplemolecular species under aqueous conditions. 2008 American Institute of Physics.关DOI: 10.1063/1.2830286兴I. INTRODUCTIONMicroarrays of surface-immobilized macromoleculesor chemical ligands are powerful tools for in vitro analysisof multiple biochemical binding events in a singleexperiment.1,2 They are particularly useful for proteomicsand glycomics research as the number and variety of structures and functions of proteins, glycans, and their ligands arelarge. The cooperative effect in a probe-target binding reaction due to the presence of other molecules further increasesthe complexity of proteomic and glycomic studies. Microarray technology in various forms enables parallel detection ofhundreds or thousands of biochemical binding processes,thus promises to shorten the discovery and analysis time. Inmost cases the microarray technology is associated withsome form of fluorescence detection such that molecularprobes are labeled with fluorescent tags either extrinsically共e.g., with Alexa 480兲 or “intrinsically” through genetic engineering 共e.g., incorporation of green fluorescent protein orphytochrome proteins兲.3–5 The fluorescence detection iswidely used for its superior sensitivity and low background.The choices of fluorescent tags are many, some being nearlyfree of photobleaching.However, fluorescent labeling has its shortcomings. Highcost and variation in labeling efficiency are well known. Forproteomics and glycomics studies, tagging molecules of interest with fluorescent agents inevitably changes the properties of host molecules. For example, the rate of incorporatingdeoxyribonucleotide triphosphates 共dNTP such as deoxycytidine triphosphate or dCTP, deoxy-adenosine triphosphateor dATP, etc.兲 by high-fidelity polymerases is reduced bymore than an order of magnitude when dNTP’s are fluorescently labeled with Cy3 or Cy5 molecules. The binding affinity of a protein to a small molecule or peptide ligand maya兲Electronic mail: /013708/7/ 23.00also be significantly reduced when the protein is labeled by afluorescent molecule such as Cy3. Often such an effect offluorescent labeling is not known or characterized a prioridue to lack of comparative label-free studies.6,7 It is thusimportant and necessary to develop label-free optical methods for high-throughput detection of microarrays.II. NOVEL SCANNING OPTICAL MICROSCOPE BASEDON DETECTION OF OBLIQUE-INCIDENCEREFELCTIVITY DIFFERENCEAt oblique incidence a surface-bound change such asbinding of molecules in liquid phase to surface-immobilizedmolecular targets alters the ratio of reflection coefficients,r p / rs tan exp共i 兲, for p-polarized 共transverse magneticmode兲 and s-polarized 共transverse electric mode兲 components of a monochromatic light beam. Optical ellipsometryin one form or another measures and , and thus can beused to study the surface-bound process. Based on thedetection of oblique-incidence optical reflectivity difference共OI-RD兲, a special form of polarization-modulated nullingellipsometry, we have developed an optical scanning microscope for label-free, high-throughput detection of microarrays over large areas 共equivalent of the field of view兲. In thisreport, we describe the optical arrangement and performanceof a scanning OI-RD microscope capable of in situ detectingprotein, peptide, and small-molecule microarrays with thousands of target spots immobilized on conventional microscope glass slides. The microscope readily scans over 10 000distinct molecular target spots and is capable of real-timekinetic as well as endpoint measurements of thousands ofbinding reactions.Compared to imaging surface plasmon resonance 共SPR兲scanners,8–11 an OI-RD microscope does not depend on goldcoated substrates for detection and can have a “field of view”as large as 2 5 cm2. We should note that microarrays with79, 013708-1 2008 American Institute of PhysicsDownloaded 28 Jan 2008 to 169.237.42.217. Redistribution subject to AIP license or copyright; see http://rsi.aip.org/rsi/copyright.jsp
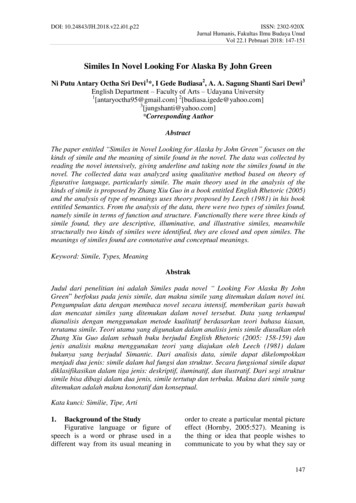
013708-2Fei et al.up to 10 000–15 000 spots on a single solid support 共e.g., a1 3 in.2 glass slide兲 are suitable high-throughput platformsfor proteomic and glycomic studies or for drug lead optimization. This is because varieties of proteins and glycans andsmall-molecule ligand candidates are in thousands.Compared to imaging ellipsometers based on the schemepolarizer-compensator-sample-analyzer 共PCSA兲12–14 theOI-RD microscope is inherently more sensitive to surfacebound changes 共e.g., thickness, density, etc.兲 by at least oneorder of magnitude. In a typical PCSA imaging ellipsometer,the phase compensator 共C兲 is fixed while the polarizer 共P兲and the analyzer 共A兲 are adjusted. The reflected light beamfrom an illuminated area on the sample surface 共S兲 passesthrough the analyzer 共A兲 and forms an image on a chargecoupled device 共CCD兲 camera. To yield 0 and 0 maps ofthe illuminated region before, for example, a molecular binding reaction takes place on the sample surface, P and A areadjusted until the photocurrents are minimized over the image region on the CCD. During the subsequent binding reaction, the thickness of a surface-bound layer changes by d.This causes and to deviate from 0 and 0 by d / and d / . However, the corresponding changein photocurrent under this off-null condition is proportionalto 共 兲2 and/or 共 兲2. The quadratic dependence of the offnull photocurrent on already small quantities and setsthe detection limit of this type of imaging ellipsometers toroughly 0.01 and 0.01 共i.e., 0.0002 rad兲.The OI-RD technique is a more sensitive form ofellipsometry.15–17 It is a polarization-modulated nulling ellipsometry in which the measurable harmonics of modulatedphotocurrents are directly proportional and . Thismakes an imaging ellipsometer based on OI-RD signals atleast an order of magnitude more sensitive than a typicalPCSA imaging ellipsometer, namely, with the detection limitto 0.001 and 0.001 . Such sensitivity is neededfor high-throughput affinity detection of low molecularweight analytes. The detection limit of 0.001 corresponds to 0.01 nm in detected protein thickness, similar tothat of an imaging SPR microscope.8–11The optical arrangement of our new scanning OI-RDmicroscope is sketched in Fig. 1. It is a dual-axis mechanicalscanning microscope. The key difference between this scanning microscope and our previous OI-RD microscopes is thatthe sample-holding stage in the present microscope onlymoves in one direction for x-scan and the y-scan is accomplished with a combination of a scan mirror and an f-thetalens. Rotating a low-mass scan mirror to achieve a y-scan of20 mm on the focal plane of the f-theta lens takes much lesstime than moving the sample-holding stage. To illustrate theconcept of such a hybrid scanning microscope and the performance in terms of field of view and image quality ofprotein microarrays, we mount a metal-coated mirror on abacklash-free rotation stage 共from Physik Instruments, Germany兲 driven by a custom stepping motor.Changes in surface mass density and/or thickness of athin nonabsorbing layer of molecules on a transparent substrate only alter significantly. Our OI-RD microscope measures the change in as follows. For illumination, we use a30 mW, linearly polarized, continuous-wave neodymiumRev. Sci. Instrum. 79, 013708 共2008兲FIG. 1. 共a兲 Top view of a hybrid scanning OI-RD microscope with a combination of y-scan by a combination of a RM and a FTL and x-scan bytranslation of the sample-holding stage. The sample is a biomolecular microarray printed on a glass slide. The microarray-bearing surface is in contact with an aqueous solution as a part of a fluidic handling system. 共b兲 Sideview of the microscope that illustrates the y-scan. PEM: photoelastic modulator. PS: phase shifter. FM: fixed mirror. OBJ: objective lens. A: analyzer.PD: photodiode detector.doped yttrium aluminum garnet laser operated at 532 nm. The beam intensity Iinc is stable within 0.4%over at least 2 h. The beam is initially s-polarized. As shownin Fig. 1共a兲 it passes through a photoelastic modulator 共PEM兲共Hinds Instruments, OR兲 so that the beam emerging after themodulator changes from being s-polarized to p-polarized at afrequency . The PEM is made of a fused quartz slab drivenby a transducer at 50 kHz 共a mechanical frequency of theslab兲. The resultant beam then passes through a phase shifter共PS兲 that alters the relative phase between the s- andp-polarized components by a variable amount PS for nulling ellipsometry. The phase shifter here is a rotatable multiorder crystalline quartz half-wave plate for 532 nm. It ismounted on a precision rotation stage with the rotation axiscoinciding with the fast axis of the wave plate. We align thefast axis of the wave plate parallel to the s-polarized component of the laser beam and the slow axis parallel to thep-polarized component of the beam. By rotating the waveplate about the fast axis, we variably change the path lengthof the laser beam and in turn the phase between the twopolarization components. We then use an assembly of a rotating mirror 共RM兲 and a f-theta lens 共FTL兲 to focus thebeam into a spot 共 10 m in diameter兲 on the microarraybearing surface of a glass slide 共with optical dielectric constant 0兲 at incident angle inc 34.7 . The microarraybearing surface is in contact with an aqueous solution共characterized by optical dielectric constant s兲. The reflectedbeam from the illuminated spot passes through an analyzer共A兲 with its transmission axis set at A 共45 in the presentstudy兲 from p-polarization. The beam is then imaged with anobjective lens onto a single-element Si p-i-n photodiode operated in photoconductive mode. The photodiode convertsDownloaded 28 Jan 2008 to 169.237.42.217. Redistribution subject to AIP license or copyright; see http://rsi.aip.org/rsi/copyright.jsp
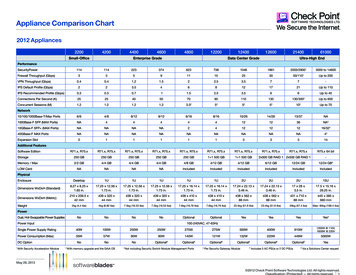
013708-3Rev. Sci. Instrum. 79, 013708 共2008兲Novel scanning optical microscopethickness d and optical dielectric constant d兲 is added to thebare surface or when the region of the surface coveredwith microarray features 共again characterized by a thicknessd and an optical dielectric constant d兲 is moved underthe illumination optics, the first harmonic becomes finite,namely, I共 兲 Iinc兩r prs兩sin 2 A sin共 0兲. We determineIinc兩r prs兩sin 2 A Imax共 兲 separately by adjusting PS untilI共 兲 Iinc兩r prs兩sin 2 A sin共 sys PS兲 reaches its maximum. The ratio of Iinc兩r prs兩sin 2 A sin共 0兲 to Imax共 兲yields sin共 0兲 0 .When the thickness d of the interrogated microarray feature or the added molecular layer is much less than the wavelength , is related to the properties of the surface-boundlayer by15–17 冉冊4 冑 s 0共 d 0兲共 d s兲 d .共 s 0兲共 s/ 0 cot2 inc兲 d 共1兲FIG. 2. Image of a 2760-spot BSA microarray acquired with the hybridscanning OI-RD microscope as illustrated in Fig. 1. The image area is18.3 6.4 mm2 and the pixel dimension is 17.8 18.7 m2. The image contrast has been converted from the optical signal to the surface mass densityof surface-bound BSA molecules.the light intensity incident onto its surface, I共t兲, into a photoelectric current. Through a current-to-voltage converterwith a gain resistor R 5 104 , the photocurrent is detected by an SR830 Digital lock-in amplifier 共Stanford Research Systems, CA兲. The light intensity I共t兲 consists of harmonics of polarization-modulation frequency . In a typicalOI-RD experiment, we measure the first and second harmonics. The amplitude of the first harmonic is given by I共 兲 Iinc兩r prs兩sin 2 A sin共 sys PS兲.16 The second harmonicis given by I共2 兲 Iinc共兩r p兩2cos2 A 兩rs兩2sin2 A兲.16 sys is thephase difference between the p-polarized and s-polarizedcomponents of the light beam contributed by optical components in the beam path other than the sample surface. is thephase difference due to the reflection from the microarraybearing glass surface alone.Let 0 be the value for the bare glass slide surface. Weadjust PS until sys 0 PS 0 on the bare surface so thatI共 兲 0. When a thin layer of molecules 共characterized byHere is the fractional surface coverage of the molecules,defined as the area covered by the molecules divided by thetotal area available. can be determined experimentally byexposing the microarray-covered glass surface to a solutionof bovine serum albumin 共BSA兲. The additional change in from the originally -covered region is proportional to1 while the signal from the originally uncovered regionis proportional to 1. From the two values of , one extracts . With our current scan microscope, we can detect a submonolayer of protein molecules such as bovine serum albumin at a level as small as 0.005 or 1 / 200 of a monolayer.From Eq. 共1兲 it is clear that the first-harmonic I共 兲, afterthe initial nulling step, increases linearly with d / . In contrast, when the ambient, the substrate, and the molecularlayer are all transparent to the laser beam 共as in our presentstudy兲, I共2 兲 changes quadratically with d / and is thusnegligible.17An image in of a biomolecular microarray on a glassslide is obtained by scanning the illumination beam iny-direction with the rotating mirror as shown in Fig. 1共b兲 andmoving the sample stage in x-direction. The incrementalangle for the rotating mirror driven by a stepping motor is assmall as 42.5 rad in our present microscope. Together withthe f-theta lens, this gives a rise to a linear step of 4.68 min y-direction on the sample surface 共on the focal plane ofthe f-theta lens兲. In actual scan, we use a step size of18.7 m in order to reduce the scan time and to match thebeam diameter on the sample surface 共 10 m兲.III. EXPERIMENTAL RESULTSFor target microarrays, we use rabbit immunoglobulin-G共IgG兲, human IgG, mouse IgG, BSA 共all purchased fromJackson Immuno Research Laboratories兲, and biotin-BSAconjugates that we have synthesized in house.18 The choiceof biotin-BSA conjugates as a target is motivated by ourintent to apply the OI-RD microscope to high-throughputscreening small-molecule libraries for protein ligands. Ourstrategy is to conjugate small molecules to carrier proteinssuch as BSA through a flexible linker and then print smallmolecule-BSA conjugate microarrays on an epoxy-Downloaded 28 Jan 2008 to 169.237.42.217. Redistribution subject to AIP license or copyright; see http://rsi.aip.org/rsi/copyright.jsp
013708-4Rev. Sci. Instrum. 79, 013708 共2008兲Fei et al.functionalized glass surface. The conjugate binds to the epoxy groups on the glass surface through amine residues onthe surface of BSA, leaving the small-molecule target accessible to protein probes in subsequent analysis. In our casemore than one biotin molecule is attached to one BSA molecule. All the target molecules, in 1 PBS 共phosphate buffered saline兲 at same concentration of 7.6 M, are printed onan epoxy-functionalized glass slide 共CEL Associates, TX兲with a contact-printing robot 共OmniGrid 100, Genomic Solutions, MI兲. The center-to-center separation between neighboring spots is 200 m. The spots are more or less circularwith an average diameter of 100 m. After printing, themicroarray-bearing slide is washed with 1 PBS 共pH 7.4兲to remove unbound protein targets. The slide is then assembled into a fluid-handling system filled with 1 PBS sothat the microarray is examined in situ in either the buffersolution or a probe solution during subsequent reactions withthe scanning OI-RD microscope. After the excess printed target materials are washed away, the microarray spots areoptically flat on the glass substrate. There are no observableedge effects when these spots are imaged with our scanningmicroscope.We first demonstrate that the new scanning microscopeis capable of imaging large microarrays under aqueous conditions. Figure 2 shows the image of a 2760-spot BSAmicroarray immersed in a 1 PBS buffer solution afterthe washing step. The microarray covers an area of 1.83 0.64 cm2, total of 1 cm2. The scan steps are 17.8 m inx-direction and 18.7 m in y-direction, the dimension of oneimage pixel is 17.8 18.7 m2. If we reduce the step size bya factor of 2, this OI-RD microscope can scan a proteinmicroarray four times as dense over the same area, with over11 000 spots. In Fig. 2 we have converted the optical signal to the surface mass density using the following procedure. Using the fact that BSA / BSA BSAdBSA, we rewriteEq. 共1兲 into冉冊冉 冊共 BSA s兲共 BSA 0兲 dBSA BSA4 冑 s 0共 s 0兲共 s/ 0 cot2 inc兲 BSA 共 BSA s兲共 BSA 0兲 BSA4 冑 s 0.2共 s 0兲共 s/ 0 cot inc兲 BSA BSA By rearranging Eq. 共2兲 and putting in the values of 0 2.307 for the glass slide, s 1.788 for the aqueous buffersolution, d BSA 2.031 for BSA in solution, and BSA 1.35 gm/ cm3, we arrive at BSA 共4.98 10 5 g/cm2兲兩 兩.共3兲From Eq. 共3兲 we covert the experimental to the surfacemass density of the BSA layer. If we model a bovine serumalbumin molecule as an ellipsoid with major axes being4 4 14 nm3,19 a fully packed monolayer of BSA molecules with their long axes parallel to the surface 共side-ongeometry兲 will have a surface mass density of 1.9 10 7 g / cm2. A full monolayer of BSA molecules with thelong axes perpendicular to the surface 共end-on geometry兲will have a surface mass density of 6.8 10 7 g / cm2. Figure2 shows that after the excess protein targets are washed off,nearly all printed spots consist of a full monolayer of BSA inend-on geometry.The image of a nearly 3000-spot BSA microarray takes69 min to acquire. Out of the total image acquisition time,only 10 min are used for signal averaging at 2 ms per“pixel,” while the remaining 59 min are spent to rotate thescan mirror that currently is driven by a stepping motor. Byusing a galvanometer-based scan mirror, the time needed torotate the mirror in order to acquire the same image can bereduced to less than 3 min. This means that the scan time foran image as shown in Fig. 2 can be acquired in less than15 min.共2兲We subsequently use the new hybrid scanning OI-RDmicroscope to detect two known protein-protein and protein–small-molecule binding reactions on a separately preparedmicroarray. The microarray consists of rabbit IgG 共RB兲, human IgG 共HM兲, and mouse IgG 共MS兲 as antigen targets;biotin-BSA conjugate as a small-molecule target, and unmodified BSA as a control target. The microarray is printedwith each target in 1 PBS solution at a concentration of7.6 M. Before the optical scan, the printed microarray iswashed to remove the excess targets. In Fig. 3共a兲 we showthe image of the target microarray obtained with the microarray immersed in 1 PBS. Each column consists of one targetand has 90 spots 共only 15 spots are shown兲. The sections inthe middle and on the right are duplicates. The spot size andthe surface mass density are uniform for each target; they dovary for different targets presumably due to the detailedmakeup of surface residues of the printed proteins. The average surface mass density of the immobilized BSA andbiotin-BSA targets is BSA 5.8 10 7 g / cm2 关calculated using Eq. 共3兲 from the optical signals 兴. The surface massdensities of the immobilized IgG targets 关as shown in Fig.3共a兲兴 are also converted from the respective optical signalsusing Eq. 共3兲 since the optical dielectric constant and volumemass density for IgG are roughly the same as BSA.20 Theaverage surface mass density of the IgG targets is IgG 11.5 10 7 g / cm2. Again if we model an IgG molecule asan ellipsoid with three major axes measuring 4.4 4.4 23.5 nm3, a full monolayer of IgG molecules with theirlong axes perpendicular to the surface will a surface massDownloaded 28 Jan 2008 to 169.237.42.217. Redistribution subject to AIP license or copyright; see http://rsi.aip.org/rsi/copyright.jsp
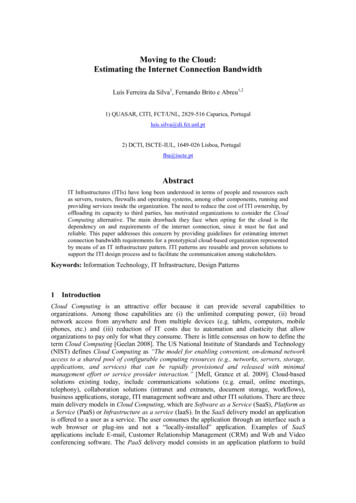
013708-5Novel scanning optical microscopeRev. Sci. Instrum. 79, 013708 共2008兲FIG. 3. Images of a protein microarray after a sequence of postprinting treatment. The microarray consists of mouse IgG 共MS兲, human IgG 共HM兲, rabbit IgG共RB兲, biotin-BSA 共BBSA兲, and BSA as targets printed in columns. Dashed lines separate three microarray replicates. 共a兲 Image in surface mass density afterwashing; 共b兲 mass density change due to BSA-blocking treatment; 共c兲 mass density after reaction with goat polyclonal antibody against the Fc domain ofmouse IgG;. 共d兲 mass density change after reaction with streptavidin.density of 13 10 7 g / cm2. This suggests that both IgG andBSA targets bind to epoxy-functionalized surface in end-ongeometry. It is reasonable to expect that half of the immobilized IgG targets have the Fc fragments pointing away fromthe surface and thus accessible to antibodies against thesefragments.Before reactions, we flow 0.5 mg/ ml BSA 共i.e., 7.6 M兲in 1 PBS into the flow cell so that free epoxy groups on themicroarray-bearing surface are reacted with the BSA molecules. This “blocking” step prevents nonspecific bindingduring subsequent reactions. We take an image after theblocking step 共not shown here兲. The differential image 关asshown in Fig. 3共b兲兴 taken by subtracting the image afterblocking from the image shown in Fig. 3共a兲 reveals that thecoverage of the printed targets is uniform and full. Itmeans that the variation in or in surface mass densityfrom target to target in Fig. 3共a兲 results from the variation inmean thickness of the targets. The mean thickness dependson the orientation of the targets.We expose the microarray first with unlabeled goat antibody against the Fc fragments of the mouse IgG at a probeconcentration of 0.01 mg/ ml 共i.e., 0.067 M.兲 In Fig. 3共c兲Downloaded 28 Jan 2008 to 169.237.42.217. Redistribution subject to AIP license or copyright; see http://rsi.aip.org/rsi/copyright.jsp
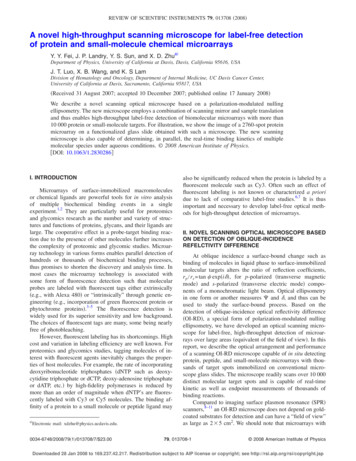
013708-6Rev. Sci. Instrum. 79, 013708 共2008兲Fei et al.we show the difference between the image taken after thereaction and the image taken after the BSA blocking step.Only the mouse IgG targets show the strong evidence ofbinding with the goat antimouse IgG probe. The averagechange in surface mass density on the mouse IgG targets is IgG 5.3 10 7 g / cm2. This is one-half of a full monolayer of goat IgG probe in end-on geometry. Since roughlyone-half of the mouse IgG targets in end-on geometry has theFc fragments accessible to the probe, this means that all accessible mouse IgG targets have reacted with the probe. Figure 3共c兲 also reveals noticeable cross reactivity of goat antimouse IgG with surface-immobilized rabbit IgG and humanIgG targets. The net change in surface mass density due tothe cross-reacted goat IgG is five times smaller than on themouse IgG targets. There is no evidence of binding for goatantimouse IgG probe on either biotin-BSA conjugate or BSAcontrol targets.We next subject the microarray to reaction with streptavidin at a probe concentration of 0.17 M. Figure 3共d兲shows the differential image by subtracting the image takenbefore the reaction from the image after the reaction. Onlyon biotin-BSA conjugates we observe uniform changes in or in surface mass density, while no changes at all on othertargets. This indicates, not surprisingly, that the streptavidinmolecules bind specifically to biotin targets that are conjugated to BSA through linker molecules. The surface massdensity of captured streptavidin molecules by biotin-BSAconjugates is 6.9 10 7 g / cm2. It is more than the surface mass density expected of a fully packed monolayer ofstreptavidin, which is streptavidin 4 10 7 g / cm2. This canbe understood as follows: the area number density of biotinmolecules is higher than that of a full monolayer of streptavidin; the linker molecules make the “excess” biotin targetsaccessible to streptavidin molecules beyond one fully packedmonolayer.In addition to endpoint measurements, the present highthroughput OI-RD microscope is capable of monitoring reaction kinetics at multiple targets. In this mode of operation,we choose one pixel from each of the five targets and onepixel from the unprinted region as the reference “channel”and only measure from these pixels in sequence. By repeating the measurement sequence, we obtain the surfacemass density change in real time on the selected targets. Weminimize the effect of any drift in sys in the microscope bysubtracting of the reference channel from of the targets. Figure 4 shows the surface mass density change versustime on five targets measured at 1 / 3 Hz 共one time point every 3 seconds兲. The solution of goat antimouse IgG at a concentration of 0.067 M is quickly introduced into the samplefluidic system at t 0. The signal on the mouse IgG targetincreases until it reaches the equilibrium value 5.3 10 7 g / cm2 as also displayed in Fig. 3共c兲. The signal onbiotin-BSA conjugate and BSA control targets remain unchanged. On HM and RB target the signals change noticeably but by a significantly smaller amount, 1.5 10 7 g / cm2, as also shown in Fig. 3共c兲. Other than confirming the endpoint measurement shown in Fig. 3共c兲, thereal-time data reveal the kinetics of the observed bindingreactions.FIG. 4. Simultaneous measurement of the binding reaction in real time ofgoat polyclonal antibody against mouse IgG 共the Fc domain兲 with a proteinmicroarray consisting of mouse IgG, human IgG, rabbit IgG, biotin-BSAconjugate, and BSA as surface-immobilized target using the hybrid OI-RDmicroscope as illustrated in Fig. 1.IV. CONCLUSIONIn summary, we have developed a new high-speedoblique-incidence reflectivity difference 共OI-RD兲 microscopethat can detect biomolecular microarrays with 2760 featuresin 1 cm2 area. This scanning microscope uses a combinationof a rotating scan mirror for y-scan and a single-axis translation for x-scan. By increasing the scan field of view or thedensity of microarray spots by a factor of 4, this microscopeshould be able to detect biomolecular microarrays with over10 000 features. For microarray spots with 100 m diameters, this new microscope can acquire an endpoint image ofa 2760-spot microarray in less than 15 min with a pixel dimension of 20 20 m2. The new scanning OI-RD microscope is also capable of following the kinetics of molecularinteractions on biomolecular microarrays in a highthroughput fashion.ACKNOWLEDGMENTSThis work was supported by NIH under NIH-R01HG003827-02.T. Kodadek, Chem. Biol. 8, 105 共2001兲.G. MacBeath, Nat. Genet. 32, 526 共2002兲.3M. Schena, Microarray Analysis 共Wiley, Hoboken, 2003兲.4H. Zhu, M. Bilgin, R. Bangham, D. Hall, A. Casamayor, P. Bertone, N.Lan, R. Jansen, S. Bidingmaier, T. Houfek, T. Mitchell, P. Miller, R. A.Dean, M. Gerstein, and M. Synder, Science 293, 2101 共2001兲.5P. Mitchell, Nat. Biotechnol. 20, 225 共2002兲.6O. Shliom, M. Huang, B. Sachais, A. Kuo, J. W. Weisel, C. Nagaswami, T.Nassar, K. Bdeir, E. Hiss, S. Gawlak, S. Harris, A. Mazar, and A. A.12Downloaded 28 Jan 2008 to 169.237.42.217. Redistribution subject to AIP license or copyright; see http://rsi.aip.org/rsi/copyright.jsp
013708-7Higazi, J. Biol. Chem. 275, 24304 共2000兲.R. Karlsson, J. Mol. Recognit. 17, 151 共2004兲.8B. K. Singh and A. C. Hillier, Anal. Chem. 78, 2009 共2006兲.9C. Boozer, G. Kim, S. Cong, H. Guan, and T. Londergan, Curr. Opin.Biotechnol. 17, 400 共2006兲.10J. S. Shumaker-Parry and C. T. Campbell, Anal. Chem. 76, 907 共2004兲.11K. Usui-Aoki, K. Shimada, M. Nagano, M. Kawai, and H. Koga,Proteomics 5, 2396 共2005兲.12R. M. A. Azzam and N. M. Bashara, Ellipsometry and Polarized Light共Elsevier Science, Science, 1987兲.13G. Jin, R. Jansson, and H. Arwin, Rev. Sci. Instrum. 67, 2930 共1996兲.7Rev. Sci. Instrum. 79, 013708 共2008兲Novel scanning optical microscopeZ. H. Wang and G. Jin, Anal. Chem. 75, 6119 共2003兲.J. P. Landry, X. D. Zhu, and J. P. Gregg, Opt. Lett. 29, 581 共2004兲.16P. Thomas, E. Nabighian, M. C. Bartelt, C. Y. Fong, and X. D. Zhu, Appl.Phys. A: Mater. Sci. Process. 79, 131 共2004兲.17X. D. Zhu, J. P. Landry, Y. S. Shun, J. P. Gregg, K. S. Lam, and X. W.Guo, Appl. Opt. 46, 1890 共2007兲.18Q. Xu, S. Miyamoto, and K. S. Lam, Mol. Divers. 8, 301 共2004兲.19A. K. Wright and M. R. Thompson, Biophys. J. 15, 137 共1975兲.20J. L. Oncley, G. Scatchard, and A. Brown, J. Phys. Colloid Chem. 51, 184共1947兲.1415Downloaded 28 Jan 2008 to 169.237.42.217. Redistribution subject to AIP license or copyright; see http://rsi.aip.org/rsi/copyright.jsp
s tan exp i, for p-polarized transverse magnetic mode and s-polarized transverse electric mode compo-nents of a monochromatic light beam. Optical ellipsometry in one form or another measures and , and thus can be used to study the surface-bound process. Based on the dete