Transcription
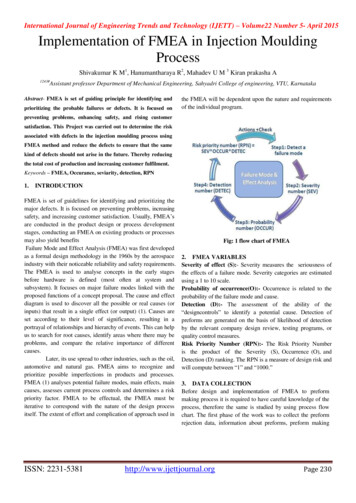
International Journal of Engineering Trends and Technology (IJETT) – Volume22 Number 5- April 2015Implementation of FMEA in Injection MouldingProcessShivakumar K M1, Hanumantharaya R2, Mahadev U M 3 Kiran prakasha A1243#Assistant professor Department of Mechanical Engineering, Sahyadri College of engineering, VTU, KarnatakaAbstract- FMEA is set of guiding principle for identifying andprioritizing the probable failures or defects. It is focused onthe FMEA will be dependent upon the nature and requirementsof the individual program.preventing problems, enhancing safety, and rising customersatisfaction. This Project was carried out to determine the riskassociated with defects in the injection moulding process usingFMEA method and reduce the defects to ensure that the samekind of defects should not arise in the future. Thereby reducingthe total cost of production and increasing customer fulfilment.Keywords – FMEA, Occurance, seviarity, detection, RPN1.INTRODUCTIONFMEA is set of guidelines for identifying and prioritizing themajor defects. It is focused on preventing problems, increasingsafety, and increasing customer satisfaction. Usually, FMEA’sare conducted in the product design or process developmentstages, conducting an FMEA on existing products or processesmay also yield benefitsFailure Mode and Effect Analysis (FMEA) was first developedas a formal design methodology in the 1960s by the aerospaceindustry with their noticeable reliability and safety requirements.The FMEA is used to analyse concepts in the early stagesbefore hardware is defined (most often at system andsubsystem). It focuses on major failure modes linked with theproposed functions of a concept proposal. The cause and effectdiagram is used to discover all the possible or real causes (orinputs) that result in a single effect (or output) (1). Causes areset according to their level of significance, resulting in aportrayal of relationships and hierarchy of events. This can helpus to search for root causes, identify areas where there may beproblems, and compare the relative importance of differentcauses.Later, its use spread to other industries, such as the oil,automotive and natural gas. FMEA aims to recognize andprioritize possible imperfections in products and processes.FMEA (1) analyses potential failure modes, main effects, maincauses, assesses current process controls and determines a riskpriority factor. FMEA to be effectual, the FMEA must beiterative to correspond with the nature of the design processitself. The extent of effort and complication of approach used inISSN: 2231-5381Fig: 1 flow chart of FMEA2. FMEA VARIABLESSeverity of effect (S):- Severity measures the seriousness ofthe effects of a failure mode. Severity categories are estimatedusing a 1 to 10 scale.Probability of occurrence(O):- Occurrence is related to theprobability of the failure mode and cause.Detection (D):- The assessment of the ability of the“designcontrols” to identify a potential cause. Detection ofpreforms are generated on the basis of likelihood of detectionby the relevant company design review, testing programs, orquality control measures.Risk Priority Number (RPN):- The Risk Priority Numberis the product of the Severity (S), Occurrence (O), andDetection (D) ranking. The RPN is a measure of design risk andwill compute between “1” and “1000.”3. DATA COLLECTIONBefore design and implementation of FMEA to preformmaking process it is required to have careful knowledge of theprocess, therefore the same is studied by using process flowchart. The first phase of the work was to collect the preformrejection data, information about preforms, preform makinghttp://www.ijettjournal.orgPage 230
International Journal of Engineering Trends and Technology (IJETT) – Volume22 Number 5- April 2015machines through visits to the production plant.Percentaverage preform rejection of one month is gathered from QCreports and the most common problems due to which preformsare rejected are noted before the start of the study.1201008380A. Rejection Data: Rejection of water bottle preforms hasbeen collected from the Transparent Polymers Ltd. Hubli.Loss39,6002Bubble12,96032,4003Short neck6,24015,6004Black ,20097100736040Sr. No Problem Description QuantityRejectedPermonth1Material Degradation 15,84091603320% RejectionCumulative %0The above graph shows the percentage rejection of defects andalso cumulative percentage of defects. According to FMEA weare going to concentrate 80% of defects first. By above graph7Silver stake1,4403,600Total 1,20,000 Rswe can easily analyze how much defects come under 80 percent.So let us going to find solutions for defects MaterialTable:1 Rejection data of defect preforms beforeDegradation, Bubble, Short neck, Black spot & white perform.implementing FMEAAfter finding solution for these defects we can go for terialDegradation33332Bubble27603Short neck13734Black Spot10835White Preform8916Flask6977Silver stake3100defects Flask & Silver stake.4.ANALYSIS OF DATAOnce the preform rejection data is gathered the areas whereconcentration is required are finalized so that the rejection ofpreforms will come down. Accordingly efforts have been put toreduce the rejection. I started analysis of the data to identifycauses of occurrence of each problem and effects of theseproblems on quality characteristics of the preforms.Once I obtained all the information available about theTable:2 Cumulative percentage of Rejection of Defectsproblems of preform rejection or potential failures of thepreform making process, it moved the operative phase of riskevaluation through definition of the FMEA form. The formused in this work is based on the reference manual. The formreported the detected rejection typologies and some additionalB. Pareto Diagram:information associated with them: potential causes, failureeffects that detect the failures, evaluation of three riskparameters and calculation of RPN of each cause of theISSN: 2231-5381http://www.ijettjournal.orgPage 231
International Journal of Engineering Trends and Technology (IJETT) – Volume22 Number 5- April 2015problem. The evaluation of the three risk parameters is done onbe other factors to consider (contributors to the overallthe numerical scale defined by the FMEA team created on theseverity of the event being analyzed).basis of reference manual. The numerical scales are shown inthe table. They are based on the needs of the high pressuremolding line of the company or final product. The cause havinghigher RPN is given priority.Finding of RPN involves 3 steps.EffectRankNone1Very Slight2CriteriaNo effectOccurrence Evaluation CriteriaSeverity Evaluation CriteriaDetection Evaluation CriteriaSome Users Notice.RPN (Occurrence Evaluation Criteria)*(Seviority EvaluationCriteria)*(Detection) Evaluation Criteria)Occurrence Evaluation CriteriaMinor effect on performanceMinor3User is slightly dissatisfied.Moderate4Reduced performance withgradual performancedegradationSevere5Degraded performance, butSafe usable.High Severe6Very poor performance. VeryDissatisfied user.Very HighSevere7ExtremeSevere8Probable failure with hazardouseffectMaximumSevere9Unpredictable with hazardouseffectThe probability that a failure will occur during the expected lifeof the system can be described in potential occurrences per unittime. Individual failure mode probabilities are grouped intoUser dissatisfied.distinct, logically defined levels.Probability of failureLikely failureratesNegligible effect onperformance.OccurrenceInoperable but safeVery 2/1000051/10004Detection Evaluation Criteria0.5/10003This section provides a ranking based on an assessment of the0.1/10002ModerateLowTable :4 Severity Ranking Criteriaprobability that the failure mode will be detected given thecontrols that are in place. The probability of detection isRemote0.01/10001Table:3 FMEA Occurrence Evaluation Criteriaranked in reverse order. For example, a "1" indicates a veryhigh probability that a failure would be detected beforereaching the customer; a "10" indicates a low – zeroSeverity Ranking Criteria Calculating the severity levelsprovides for a classification ranking that encompassesprobability that the failure willbe detectedsafety, production continuity, scrap loss, etc. There couldISSN: 2231-5381http://www.ijettjournal.orgPage 232
International Journal of Engineering Trends and Technology (IJETT) – Volume22 Number 5- April 2015multiplication of rankings of Severity, Occurrence andDetection as shown below [6]. Now we can find causesDetectionRankCriteriaExtremely Likely1Can be corrected prior toprototype. Controls will almostcertainly detectVery HighLikelihood2Can be corrected prior to designrelease/Very High probability ofdetection3Likely to be corrected/Highprobability of detection.Moderately Likely4Operation controls aremoderately effective.MediumLikelihood5Operation controls have an evenchance of working.6Operation controls may miss theproblem7Operation controls are likely tomiss the problem8Operation controls have a poorchance of detection9Unproven, unreliable chance fordetectionHigh LikelihoodModerately LowLikelihoodLow LikelihoodVery LowLikelihoodExtremely UnlikelyTable :5 Detection Evaluation riation inDrier Temp7931892ShortNeckVariation n inbarrel Temp8853204WhiteperformVariation inScrew speed26BlackspotVariation inMoldTemperature ControlTemp352424for defects first whose RPN value is more i.e materialdegradation and follow in descending manner5.DATA INTERPRETATION & SOLUTIONDOE is used to find the significant factors for potentialfailures. After discussion with employee by brainstorming it was concluded that the following 3 factorswere responsible,1. Men2. Material 3. Temperature/ Injection Speed /Screw ignificantSignificantBarrelTemperatureMen1.25Non SignificantMaterial0.14Non SignificantCombined0.01Non eMen1.91Non SignificantMaterial0Non SignificantCombined0.05Non SignificantInjection220.81SignificantShort NeckSpeedMen0.07Non SignificantMaterial0.61Non SignificantCombined0.07Non SignificantScrew Speed 86.12SignificantBlack SpotMen0.16Non SignificantMaterial0.16Non SignificantCombined0.18Non formMenNon Significant0.25MaterialNon Significant0.16CombinedNon Significant0.18Table: 7 data interpretation & solutionMaterialDegradationBy applying DOE, the results shown in Table7 are obtainedin which the Fisher values are high for the factors Barrel60Temperature, Drier Temperature, Injection Speed and Screw5Speed. So these factors are Significant concerns with defectsMaterial degradation, Bubbles, Short Neck and Black spotTable : 6 Calculation of Existing RPNrespectively respectively.Calculation of Existing RPN: RPN is calculated byISSN: 2231-5381http://www.ijettjournal.orgPage 233
International Journal of Engineering Trends and Technology (IJETT) – Volume22 Number 5- April 20156.Solution7.CALCULATION OF NEW RPNBy operating the Injection Molding Machine for differentoperating variable we found the number of defects as shownin Table No 8. For the factors Temperature, Injection speedand Screw speed there are Two levels out of which we tookAfter finding solution for causes let us head towardscalculating the new RPN after taking actions andpercentage decrease in RPN value. Calculations areshown belowreadings for number of defects.In obtained defects which level has minimum defects thatlevel have been selected and freezed the respected variable.TemperatDefectsure/InjectNumbioner ofSpeed/ScrDefectew Speeds/hrMaterial17032Degradatdegree Cion180(Barreldegree C24Solution14028(Drierdegree CTempera160ture)degree CShort65Neckmm/sec(Injectio75n N%Decreasein 8940.743Short Neck8629616842.854Whiteperform351152445.55Black spot252206012CauseVariatiStandardon inTemp freezeBarrelto180 degreeTempCTemp)BubbleSlNoVariatiStandardon inTemp freezeDrierto160 degreeTempCVariatiFreezeon inInjectionInjectispeed to 65onmm/secTable 9: New RPN tableAfter taking actions there is change in RPN Value that isreduced by almost 50 percent. Now we are going to collectdata after implementing as shown in below table 3VariatiFreeze MTC3Short neck4,26010,650on inTemp to 2804Black Spot3,5008,750MTCdegree C5WhitePreform2.5406,3506Flask2,1205,3007Silver stake9402,350Total77,900Black260Spotdegree C(MTC280Temp)degree CWhite60 rpm12VariatiFreeze ScrewPreform80 rpm5on inspeed to 80(ScrewScrewrpmSpeed)Speed7TempTable: 8 Solution tableISSN: 2231-5381Table: 10 Data Collection after Implementinghttp://www.ijettjournal.orgPage 234
International Journal of Engineering Trends and Technology (IJETT) – Volume22 Number 5- April 20158.CONCLUSIONThe FMEA methodology is allowed to study andanalyze every single step of preform making processand to achieve the improvement in product andprocess quality. The improvements obtained by theimplementation of the recommended actions thusreduce the individual RPN and the risk levelassociated with each defect is reduced.After implementation of FMEA the RPN value hasbeen reduced for each of the defect as mentioned inthe table no.9 And the defects are reduced from48,540 to 31,160 per month and total cost associatedwith the defects is reduced from 1,20,000 Rs to77,900 Rs as shown in table no 10By this way the number of defects, development timeand cost has been reduced and also there is lesschance of occurring same kind of failure in future.9.Journal of Failure Analysis and Prevention,Volume5, Issue 2, pp. 5-10.7. Arvanitoyannis, I. S
Implementation of FMEA in Injection Moulding Process Shivakumar K M1, Hanumantharaya R2, Mahadev U M 3 Kiran prakasha A . ranked in reverse order. For example, a "1" indicates a very high probability that a failure would be detected before reaching the customer; a "10" indicates a low – zero probability that the failure will be detected Effect Rank Criteria None 1 No effect 2 Negligible .


