Transcription
2021 Market OutlookThe World WillLook RadicallyDifferent in 20212020 was a dramatic year by manymeasures. The global economy saw theworst annual GDP contraction (-4%) in 75years, and a global pandemic took over1.5 million lives. We expect an equallydramatic 2021, with immunity to COVID-19reached in 2Q in the U.S. The combinationof reopening, monetary and fiscal stimulus,and pent-up demand will superchargegrowth in 2021. But stocks may only makemodest returns, tempered by multiplecompression, and overall equity returnswill hide performance differentials at theregion, sector, and style level, similar to2020. As the world goes back to normal,the premium for highly valued stocksshould also return to normal. It is moreimportant to position for this rotation instyle performance than to be overweightstocks in our view.CYRIL MOULLE-BERTEAUXPortfolio ManagerHead of Global Multi-Asset TeamManaging DirectorSERGEI PARMENOVPortfolio ManagerGlobal Multi-Asset TeamManaging DirectorSOLUTIONS & MULTI-ASSET GLOBAL MULTI-ASSET TEAM
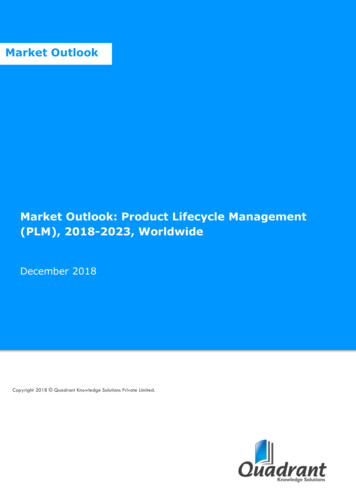
2021 MARKET OUTLOOKThe cover of Time magazine recentlyproclaimed 2020 “the worst year ever.”1While historians might argue that, in thepast hundred years, the Great Depression,Stalin’s famines and purges in the 1930sand 1940s, World War II, Mao’s GreatLeap Forward, or the Vietnam Warincluded worse years for humanity, 68million people—and counting—havebeen infected by COVID-19 in 2020 anda staggering one and a half million havedied as a result of the virus. The globaleconomy collapsed in the first half ofthe year and will shrink by nearly 4% in2020, the worst annual contraction innearly 75 years.Millions lost their jobs, including morethan 20 million in the U.S. and fivemillion in the Eurozone. Corporateprofits also collapsed by -17% for theyear (and by -30% during the secondand third quarters), with defaults ofhighly-indebted U.S. companies hittingnearly 9% despite significant monetaryand fiscal support programs. Thoughthe virus continues to rip through theglobal population, most of the economicdamage occurred in the first half ofthe year, with the second half seeingthe beginning of a recovery aided byunprecedented fiscal and monetarypolicy stimulus and the partial reopeningof economies.From an investment perspective the mostextraordinary aspect of 2020 was that,despite the damage to people’s lives andlivelihoods, global stocks rose 10% withChina up 25%, the U.S. up 16%, andwith Japan and EM ex-China up moremodestly at 6% and 2% (the Eurozonewas the only major region with slightlynegative returns at -3%) year-to-date asof November 30.2 Most bond indicesalso rose strongly, led by U.S. Treasuries( 8%), TIPS ( 10%) and high gradecorporates ( 9%), with only emergingmarket local currency bonds lagging,DISPLAY 1U.S. Should Reach Herd Immunity by Summer 2021Population Immune (From Vaccination Immunity From Prior Infection), %Herd Immunity Threshold70%60%50%% Population Immune from Prior Infection40%30%% Population t-21Dec-21Source: MSIM Global Multi-Asset Team Analysis and Estimates, Youyang Gu. Data as of December 2020.Assuming 0-10% population with prior COVID-19 infection has immunity and does not get vaccinated.Forecasts/estimates are based on current conditions, subject to change, and may not necessarilycome to pass.at -4%.3 Commodities had highlybifurcated performance, with gold andindustrial metals rising 17% and 15%,respectively but oil dropping -29%.4As eventful as 2020 has been forindividuals and for economies, we expectan equally dramatic 2021. With twoextremely efficacious vaccines soon to bewidely available, we expect that broadherd immunity will be reached in thesecond quarter in the U.S., with thevirus likely fully conquered by the thirdquarter (see Display 1). The Eurozone andother developed countries are likely tobe less than a couple of months behindthe U.S., while emerging markets maytake six to 12 months longer to achievetotal immunity. Clearly, the second (andpotential third) waves are disruptingeconomic activity and could continue todo so for another few months. However,one thing is clear: if 2020 was the year ofliving with the virus, 2021 will be aboutthe return to normalcy. Thanksgivingand the holidays in 2021 will be radicallydifferent than they were in 2020, in manyways the exact opposite, with peopleeager to return to normal, to gather ingroups with family and friends indoors,in homes, bars, restaurants, sportingvenues, and theaters, without fear; toreturn to shopping in person, traveling tosee much-missed family or for vacation,adventure, and relaxation. Of course,some things will have changed, but mostthings—much more than expected—willgo back to normal. We use China as atemplate for how the population mightbehave post-COVID-19, since Chinasucceeded in controlling the spread of thevirus earlier and better than most othercountries. In China, hotel occupancyis back to 100% of pre-COVID-19levels, domestic air travel is also backto 100%, as are restaurant sales. Onthe other hand, international travel isstill down by 95% because COVID-19is out of control outside of China and,maybe as an indication of a permanentshift in consumer preferences, movieZacharek, Stephanie. “2020 The Worst Year Ever” Time. December 14, 2020.Bloomberg; all returns MSCI net total return indices in local currency terms.3Bloomberg Barclays US Treasury Index; Bloomberg Barclays US TIPS Index; Bloomberg Barclays US Corporate Bond Index; JP Morgan GBI EM Index(USD unhedged).4Spot prices for gold and Brent crude oil; S&P GSCI Industrial Metals Index.122MORGAN STANLEY INVESTMENT MANAGEMENT SOLUTIONS & MULTI-ASSET
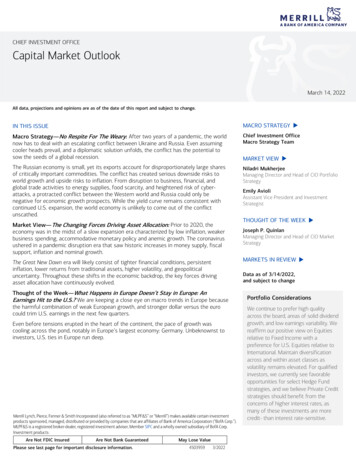
THE WORLD WILL LOOK RADICALLY DIFFERENT IN 2021theater attendance is still at only 80%of pre-COVID-19 levels. Interestingly,while virtual video calls in China are stillhigher than they were before COVID-19,they have already collapsed -60% fromthis year’s peak levels (after havingquintupled from pre-COVID-19 levels).With normalcy returning—as thevaccines bring new infections down tozero—we expect the global economyto rebound as strongly as it was hit in2020. In addition to the reopening ofthe economy driving a surge in activity,most countries, apart from China, haveboth their monetary and fiscal policysettings at maximum ease. We expect alldeveloped countries to continue with zeroor negative interest rates for years to comeuntil inflation has fully returned to, orexceeded, target levels, supplemented byquantitative easing for at least the nextyear or two. Fiscal stimuli are continuallybeing added to and increased, with theU.S., Eurozone, Japan and the U.K. allplanning additions. Though clearly, themagnitude will be smaller in 2021 thanin 2020 once lockdowns and restrictionsare lifted. In 2021, we expect a fiscaldeficit of 11% in the U.S. (down from15% in 2020), with a 6% deficit in theEurozone (down from nearly 10% in2020). In addition, significant pent-updemand is likely to be released in 2021,as the economy reopens, especially incertain services which saw demandcollapse during COVID-19, such astravel, hospitality, leisure and liveentertainment, but also in depressedgoods segments of the economy such asapparel and footwear.This combination of reopening, monetaryand fiscal stimulus, and pent-updemand will supercharge growth nextyear and allow many countries to closetheir output gaps in 2021 and 2022.We expect the U.S. economy to growby 6-8% next year, nearly double theconsensus’ expectation, and as a result,the U.S. output gap to close by summer2021 (see Display 2) and Europe’sto close two quarters later. This is acrucial difference from the post-GlobalFinancial Crisis (GFC) period: todayDISPLAY 2U.S. Output Gap Could Close by Summer and Exceed 3% by End-2021U.S. GDP Forecasts, Billions of Chained 2012 US 21,00020,500 1.0%-1.3% 00017,50017,00016,50020192020Trend GDP2021Consensus GDP Forecasts2022GMA GDP Base CaseSource: GMA forecasts assume a 900bn COVID-19 relief package in Jan-2021 and no additionalfiscal measures in 2022. Source: MSIM Global Multi-Asset Team Analysis and Estimates, BernsteinResearch. Data as of December 14, 2020.Forecasts/estimates are based on current market conditions, subject to change, and may not necessarilycome to pass.there is no crippled banking system to fixand revive, no housing bubble bust, nohousehold deleveraging to work through,no peripheral crisis in Europe—inshort, the world is not facing the longhangover of a balance sheet recessionthat it was 11 years ago. Therefore, ratherthan taking nearly a decade to returnto full employment, two or three yearsmay suffice.If the output gap closes in 2021 with thesupport of monetary and fiscal policy,inflation is unlikely to stay depressedfor as long as it did during the 2010s.Though core CPI inflation did average1.85% during the 2010s (and the corePCE deflator favored by the Fed, 1.6%),economists and markets puzzled over theapparent failure of inflation to sustainablyrise above 2.0%. Much of these inflationmisses can be attributed to the hangoverfrom the GFC and the years it tookfor the labor market to get back to fullemployment. Other idiosyncratic factorssuch as weak healthcare inflation, orcyclical ones such as a strong dollar andcollapsing energy and commodity pricesare already in the process of reversing. Asa result, we expect inflation to continueSOLUTIONS & MULTI-ASSET to grind higher from 1.4% today toend 2021 at 1.75%, still below targetbut clearly nowhere near deflation andheading in the right direction. Giventhe Federal Reserve’s new FlexibleAverage Inflation Targeting framework,we expect that policy makers will notthink about raising interest rates untilinflation is above 2% and the economyis back at maximum employment, whichmay not occur until 2022 or 2023, butclearly deflation fears still present in theminds of many investors are no longerwarranted. If correct, this means thatlong-term government bond yields whichalmost everyone expects to rise verymodestly next year could surprise on theupside, despite the Fed anchoring theshort end.With the global economy growing 7%in 2021, we expect corporate profits torebound spectacularly in 2021. Aftershrinking -17% in 2020, we expectglobal profits to rise as much as 35%in 2021, with bigger rebounds in theworst-hit regions in 2020. For example,in the Eurozone, where corporate profitsshrank -35% in 2020, we expect themto rise 63% in 2021. In principle, bigMORGAN STANLEY INVESTMENT MANAGEMENT3
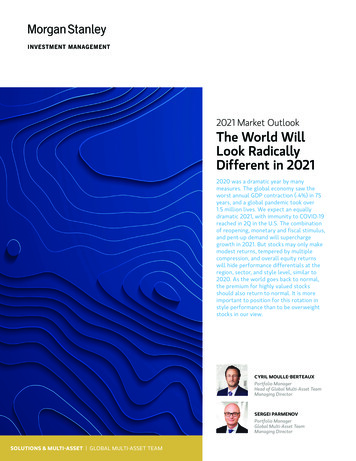
2021 MARKET OUTLOOKrebounds in profits should be positive forstock markets. However, while profitsfell in 2020, stocks actually rose 10%.5Obviously, that was driven by a massivere-rating of stocks, which went fromtrading at 19x trailing earnings-pershare (EPS) to 26x today (or 16.5x to20x in forward price to earnings terms).Unlike 2020, stocks may only makemodest returns in 2021, possibly as lowas 5-6%, driven by a big profit reboundbut tempered by multiple compressionto more reasonable levels around 17-18xforward EPS—a typical pattern in thesecond year of a recovery.Modest returns for broad equity indicesin 2021 will likely hide substantialperformance differentials “under thehood” (e.g. at the region, sector, and stylelevel), similar to 2020. This is what we arefocused on and what we think investorsshould be focused on. Global equityindices generally did well in 2020, butexpensively-valued stocks of fast-growingcompanies had spectacular returns. Usingthe Russell 1000 indices, Growth stocksreturned 31% while Value stocks fellby -1% year-to-date as of November 30.On top of the prior nine years of strongperformance, Growth’s return for thedecade is now 364% (versus 130% forValue).6 We saw a similar bifurcationin the performance of countries andregions, with the U.S. and Chinamassively outperforming Japan and theEurozone, both last year and over thepast decade. The majority of this regionalperformance differential can be explainedby sector composition: technology andinternet stocks make up 40-50% of theoutperforming U.S. and Chinese indices;by contrast they make up less than onequarter of Japanese indices and less than10% of Eurozone indices.This bifurcated performance betweenAnti-Value (high multiple stocks) andValue (low multiple stocks) has resultedDISPLAY 3Record Gap: Value Trades at 11x While Anti-Value Trades at 43xS&P 500 Anti-Value vs. Value: Absolute and Relative 12-month Fwd 201420172021Anti-Value Stocks 12-Month Fwd P/E (LHS)Value Stocks 12-Month Fwd P/E (LHS)Relative 12-month Fwd P/E: Anti-Value vs. Value Stocks (RHS)Source: MSIM Global Multi-Asset Team Analysis, Haver Analytics. Data as of December 22, 2020.The index performance is provided for illustrative purposes only and is not meant to depict theperformance of a specific investment. Past performance is no guarantee of future results.See Disclosure section for index definitions.in one of the widest valuation gapsbetween the two that we have ever seen.In the past 30 years, using the GlobalMulti-Asset (GMA) team’s definitions ofthe Value and Anti-Value styles,7 AntiValue stocks have, on average, traded at25x forward earnings, compared with11x for Value, a 138% premium. AntiValue stocks now trade at 43x forwardearnings, a 272% premium to Valuestocks’ 11.6x (see Display 3). Note that inFebruary 2000, Anti-Value stocks tradedat 30x compared with Value at 7.9x, a384% premium—incidentally the samepremium as in March 2020, when Valuewas at 7.0x and Anti-Value at 27x.8This kind of valuation premium forhighly valued stocks—which do havelower debt, higher margins and higherreturns on capital—might have beenjustified when the global economy wascollapsing as panic over COVID-19forced most of the world into lockdowns,and fears of deflation were pervasive.However, that was 2020. As mentioned,2021 will look radically different with avaccine and “pedal to the metal” policy.As the world goes back to normal, thepremium for highly valued stocks shouldalso return to normal. Prior cyclicalrebounds in Value have seen rallies of 20% to 30% relative to Anti-Value,as in 2012-13 and 2016-17. But Valuerecoveries after recessions have seenoutperformance of 80% to 140%, asin 2000-03 and 2008-2010. Given thedegree of undervaluation of low multiplestocks today (relative to high multiplestocks), we are inclined to believe thelatter is more likely than the former.Given that we expect global equitiesto rally only modestly and governmentbonds to modestly sell off (to 1.25-1.50%on the U.S. 10-year Treasury), it is, inour opinion, much more importantto position for this rotation in styleMSIM Global Multi-Asset Team Analysis; Bloomberg; Factset; MSCI ACWI Net Total Return Index in local currency as of November 30, 2020.Russell 1000 Value and Growth Price Return Indices, as of November 30, 2020.7The MSIM Global Multi-Asset team defines Anti-Value and Value as the 20% of stocks with the highest multiples, and the 20% with the lowest,respectively, on a sector-neutral, equal-weighted basis.8MSIM Global Multi-Asset Team analysis; Factset, Datastream, as of December 15, 2020.564MORGAN STANLEY INVESTMENT MANAGEMENT SOLUTIONS & MULTI-ASSET
THE WORLD WILL LOOK RADICALLY DIFFERENT IN 2021performance, than to be overweightstocks overall in order to “play” the returnto normalcy. Consequently, the majorityof the risk in our portfolios is allocatedto Value-related positions around theworld. Our regional allocations arebroadly a reflection of this view, withunderweights in U.S. and China equities,and overweights in Eurozone, Japaneseand EM ex-China equities. In addition,we expect the U.S. dollar to continue toweaken as the U.S. borrows from the restof the world at real interest rates whichwill continue to fall as inflation rises. Wealso expect commodities and commoditystocks to outperform and have positionedaccordingly. Given the negative carry onunderweight positions in U.S. Treasuries,we are positioned with long-endsteepeners and overweight positions ininflation breakevens.The risks to these views are manifold, butwe highlight three near-term ones:First, the consensus appears to haveradically shifted since Pfizer’s vaccineannouncement in early November andalmost all sell-side 2021 outlooks nowexpect an economic recovery and riskyassets to perform well. Such uniformconsensus, mostly in synch with ourviews, makes us uncomfortable. Wedo draw comfort from the fact thatour portfolios have little active riskin expensive and frothy equities. Ourportfolios are instead focused onpositioning for a rotation “under thehood,” or below the asset class level, forexample in Value stocks which are stillnot popular with investors (given theirdire underperformance for many years).In addition, we expect much strongergrowth than the consensus and thuspotentially higher inflation and higheryields than most, which would favor thisrotation. But we are concerned aboutthe increasing frothiness in overall stockDISPLAY 4Key Investment and Economic Trends We Expect in the Year Ahead2020 – OUT2021 – INVirusVaccineRecessionExpansionWall StreetMain StreetWorking from homeBack in the officeVirtualRealDeflationInflationNegative Oil pricesOil bull marketQuality / Safety / GrowthJunk / Risk / ValueTech, InternetCommodities, BanksMegacapsSmall CapsUS & ChinaEAFE and EM ex-ChinaPolarizationModerationSource: MSIM Global Multi-Asset Team Analysis. Views as of December 22, 2020.Forecasts/estimates are based on current market conditions, subject to change, and may not necessarilycome to pass.market indices as exemplified by recordinflows into equity mutual funds in thepast six weeks, as this could cause someindigestion in the near term.Second, COVID-19 new cases continue togrow around the world and it increasinglylooks like nothing short of full lockdownsor a vaccine can prevent the spread of thevirus. At the same time, governments’ andpopulations’ appetite for such restrictionshas dramatically waned. This could leadto eventually more severe medical systemcrises and eventually more draconianmeasures with their attendant impact oneconomies and markets.Finally, even though a vaccine is a gamechanger, reopenings are still a few monthsaway. This makes fiscal relief essentialas a bridge or offset for job losses andbusiness failures that will occur in theinterim. Months of difficult negotiationsin the U.S. and the latest holdup of theEuropean recovery fund by two countriesshow that fiscal stimulus may not be aseasy to implement when the economyand markets are not in full crisis mode.Further delays in stimulus would increasethe chances of a double-dip recession inthe economy, which could cause a miniversion of March 2020.In summary, we believe that the worldwill look radically different in 2021,and the following table (see Display 4)provides a summary of some of the keyinvestment and economic trends weexpect in the year ahead.Risk ConsiderationsThere is no assurance that a portfolio will achieve its investment objective. Portfolios are subject to market risk, which is thepossibility that the market values of securities owned by the portfolio will decline and that the value of portfolio shares maytherefore be less than what you paid for them. Market values can change daily due to economic and other events (e.g. naturaldisasters, health crises, terrorism, conflicts and social unrest) that affect markets, countries, companies or governments. It is difficultSOLUTIONS & MULTI-ASSET MORGAN STANLEY INVESTMENT MANAGEMENT5
2021 MARKET OUTLOOKto predict the timing, duration, and potential adverse effects (e.g. portfolio liquidity) of events. Accordingly, you can lose moneyinvesting in this portfolio. Please be aware that this portfolio may be subject to certain additional risks. In general, equity securities’values fluctuate in response to activities specific to a company. Investments in foreign markets entail special risks such as currency,political, economic, and market risks. The risks of investing in emerging market countries are greater than risks associated withinvestments in foreign developed countries. Fixed-income securities are subject to the ability of an issuer to make timely principaland interest payments (credit risk), changes in interest rates (interest-rate risk), the creditworthiness of the issuer and general marketliquidity (market risk). In a rising interest-rate environment, bond prices may fall and may result in periods of volatility and increasedportfolio redemptions. In a declining interest-rate environment, the portfolio may generate less income.Longer-term securities may be more sensitive to interest rate changes. Mortgage- and asset-backed securities (MBS and ABS) aresensitive to early prepayment risk and a higher risk of default and may be hard to value and difficult to sell (liquidity risk). They arealso subject to credit, market and interest rate risks. Certain U.S. government securities purchased by the Portfolio, such as thoseissued by Fannie Mae and Freddie Mac, are not backed by the full faith and credit of the United States. It is possible that these issuerswill not have the funds to meet their payment obligations in the future. The issuer or governmental authority that controls therepayment of sovereign debt may not be willing or able to repay the principal and/or pay interest when due in accordance with theterms of such obligations. Investments in foreign markets entail special risks such as currency, political, economic, and market risks.The risks of investing in emerging market countries are greater than risks associated with investments in foreign developed countries.Real estate investment trusts are subject to risks similar to those associated with the direct ownership of real estate and they aresensitive to such factors as management skills and changes in tax laws. Restricted and illiquid securities may be more difficult tosell and value than publicly traded securities (liquidity risk). Derivative instruments can be illiquid, may disproportionately increaselosses and may have a potentially large negative impact on the Portfolio’s performance. Trading in, and investment exposure to, thecommodities markets may involve substantial risks and subject the Portfolio to greater volatility.Nondiversified portfolios often invest in a more limited number of issuers As such, changes in the financial condition or marketvalue of a single issuer may cause greater volatility. By investing in investment company securities, the portfolio is subject to theunderlying risks of that investment company’s portfolio securities. In addition to the Portfolio’s fees and expenses, the Portfoliogenerally would bear its share of the investment company’s fees and expenses.Subsidiary and Tax Risk. The Portfolio may seek to gain exposure to the commodity markets through investments in the Subsidiaryor commodity index-linked structured notes. The Subsidiary is not registered under the 1940 Act and is not subject to all the investorprotections of the 1940 Act. Historically, the Internal Revenue Service (“IRS”) has issued private letter rulings in which the IRS specificallyconcluded that income and gains from investments in commodity index-linked structured notes or a wholly-owned foreign subsidiarythat invests in commodity-linked instruments are “qualifying income” for purposes of compliance with Subchapter M of the InternalRevenue Code of 1986, as amended (the “Code”). The Portfolio has not received such a private letter ruling, and is not able to rely onprivate letter rulings issued to other taxpayers. If the Portfolio failed to qualify as a regulated investment company, it would be subjectto federal and state income tax on all of its taxable income at regular corporate tax rates with no deduction for any distributions paid toshareholders, which would significantly adversely affect the returns to, and could cause substantial losses for, Portfolio shareholders.DEFINITIONSThe Russell 1000 Growth Index measures the performance of the large-capgrowth segment of the U.S. equity universe. It includes those Russell 1000 Index companies with higher price-to-book ratios and higher forecastedgrowth values. The Russell 1000 Index is an index of approximately 1,000of the largest U.S. companies based on a combination of market capitalizationand current index membership.The Russell 1000 Value Index is an index that measures the performanceof those Russell 1000 companies with lower price-to-book ratios and lowerforecasted growth values.The S&P 500 Total Return Index is an index that consists of 500 stockschosen for market size, liquidity and industry group representation. The S&PIndex is a market value weighted index with each stock’s weight proportionateto its market value. The S&P Index is one of the most widely used benchmarksof U.S. equity performance. The performance of the S&P Index does notaccount for any management fees, incentive compensation, commissions orother expenses that would be incurred pursuing such strategy. Total returnprovides investors with a price-plus-gross cash dividend return. Gross cashdividends are applied on the ex-date of the dividend.The S&P GSCI is a composite index of commodity sector returns representingan unleveraged, long-only investment in commodity futures that is broadly6MORGAN STANLEY INVESTMENT MANAGEMENT diversified across the spectrum of commodities. The returns are calculatedon a fully collateralized basis with full reinvestment. The combination ofthese attributes provides investors with a representative and realistic pictureof realizable returns attainable in the commodities markets. Individualcomponents qualify for inclusion in the S&P GSCI on the basis of liquidityand are weighted by their respective world production quantities.The Sharpe ratio was developed by Nobel laureate William F. Sharpe andis used to help investors understand the return of an investment comparedto its risk. The ratio is the average return earned in excess of the risk-freerate per unit of volatility or total risk. Volatility is a measure of the pricefluctuations of an asset or portfolio.The S&P U.S. Treasury Bond Current 10-Year Index is a one-security indexcomprising the most recently issued 10-year U.S. Treasury note or bond.The MSCI USA Energy Index is designed to capture the large and mid capsegments of the US equity universe. All securities in the index are classified inthe Energy sector as per the Global Industry Classification Standard (GICS ).The MSCI USA Materials Index is designed to capture the large and midcap segments of the US equity universe. All securities in the index areclassified in the Materials sector as per the Global Industry ClassificationStandard (GICS ). The S&P GSCI Gold Index, a sub-index of the S&P GSCI,SOLUTIONS & MULTI-ASSET
THE WORLD WILL LOOK RADICALLY DIFFERENT IN 2021provides investors with a reliable and publicly available benchmark trackingthe COMEX gold future.Treasury Inflation-Protected Securities, or TIPS, provide protection againstinflation. The principal of a TIPS increases with inflation and decreases withdeflation, as measured by the Consumer Price IndexIMPORTANT DISCLOSURESThe views and opinions are those of the author as of the date of publicationand are subject to change at any time due to market or economic conditionsand may not necessarily come to pass. Furthermore, the views will not beupdated or otherwise revised to reflect information that subsequentlybecomes available or circumstances existing, or changes occurring, afterthe date of publication. The views expressed do not reflect the opinions ofall portfolio managers at Morgan Stanley Investment Management (MSIM)or the views of the firm as a whole, and may not be reflected in all thestrategies and products that the Firm offers.Forecasts and/or estimates provided herein are subject to change and maynot actually come to pass. Information regarding expected market returnsand market outlooks is based on the research, analysis and opinions of theauthors. These conclusions are speculative in nature, may not come to passand are not intended to predict the future performance of any specificMorgan Stanley Investment Management product.Certain information herein is based on data obtained from third party sourcesbelieved to be reliable. However, we have not verified this information, andwe make no representations whatsoever as to its accuracy or completeness.This material is a general communication, which is not impartial and allinformation provided has been prepared solely for information purposesand does not constitute an offer or a recommendation to buy or sellany particular security or to adopt any specific investment strategy. Theinformation herein has not been based on a consideration of any individualinvestor circumstances and is not investment advice, nor should it beconstrued in any way as tax, accounting, legal or regulatory advice. To thatend, investors should seek independent legal and financial advice, includingadvice as to tax consequences, before making any investment decision.Charts and graphs provided herein are for illustrative purposes only.Past performance is no guarantee of future results.This communication is not a product of Morgan Stanley’s ResearchDepartment and should not be regarded as a research recommendation.The information contained herein has not been prepared in accordance withlegal requirements designed to promote the independence of investmentresearch and is not subject to any prohibition on dealing ahead of thedissemination of investment research.The indexes are unmanaged and do not include any expenses, fees or salescharges. It is not possible to invest directly in an index. Any index referred toherein is the intellectual property (including registered trademarks) of theapplicable licensor. Any product based on an index is in no way sponsored,endorsed, sold or promoted by the applicable licensor and it sh
fell in 2020, stocks actually rose 10%.5 Obviously, that was driven by a massive re-rating of stocks, which went from trading at 19x trailing earnings-per-share (EPS) to 26x today (or 16.5x to 20x in forward price to earnings terms). Unlike 2020, stocks may only make modest returns in 2021,