Transcription
Agilent CrossLab combines the innovative laboratory services,software, and consumables competencies of Agilent Technologiesand provides a direct connection to a global team of scientific andtechnical experts who deliver vital, actionable insights at everylevel of the lab environment. Our insights maximize performance, reduce complexity, and driveimproved economic, operational, and scientific outcomes.Only Agilent CrossLab offers the unique combination of innovative products and comprehensivesolutions to generate immediate results and lasting impact. We partner with our customers tocreate new opportunities across the lab, around the world, and every step of the way.More information at www.agilent.de/crosslabBuy onlinewww.agilent.com/chem/storeFind an Agilent customer center or authorized distributorwww.agilent.com/chem/contactusU.S. and Canada1-800-227-9770agilent inquiries@agilent.comEuropeinfo agilent@agilent.comAsia Pacificinquiry lsca@agilent.comIndiaindia-lsca marketing@agilent.comInformation, descriptions and specifications in this publication are subject to change without notice. Agilent Technologies shall notbe liable for errors contained herein or for incidental or consequential damages in connection with the furnishing,performance or use of this material. Agilent Technologies, Inc. 2016Published in USA, February 1, 2016Publication Number 5990-7595ENThe LC Handbook – Guide to LC Columns and Method DevelopmentLearn morewww.agilent.com/chem/lccolumnsThe LCHandbookGuide to LC Columns andMethod Development
The LCHandbookGuide to LC Columns andMethod Development
ContentsIntroduction 4Essential chromatographyconcepts 5Efficiency (N) Retention Factor (k) Selectivity or separation factor (α) Resolution (Rs) Pressure van Deemter Curves The gradient equation 677891010LC Instrumentation Fundamentals 12The pump – the heart of an LC system 13 Pressure range 13 Power ranges of Agilent 1200 InfinitySeries pumps 14 Solvent mixing 15 Delay volume 17 Extra column volume 17The autosampler – the brain behindworkflow automation logistics 18 Fixed-loop and flow-through autosamplers 18 Injection precision and accuracy 20 Flexibility and sample capacity 20 Injection cycle time 20 Carryover 21 Novel sampling approaches andautomation 22The column thermostat – the muscles togenerate heat 22Detector - the organ of perception 23Detector sensitivity 25 Linear range 25 Data rate 262Selecting your HPLC column 27HPLC mode Column selection basics: conventional columns High Performance LiquidChromatography (HPLC) columns UHPLC columns Superficially porous particle columns Columns for LC/MS Columns for Gel PermeationChromatography (GPC), Size ExclusionChromatography (SEC), and GelFiltration Chromatography (GFC) Columns for biocharacterization Column characteristics Silica Bonded phases Polymers Pore size Particle size Column dimensions Cartridge column systems 282933333434343435353637Keys to performance: columnconfigurations and settings 40The importance of reducing extra-columnvolume Preparing the perfect fitting connection Fitting connection requirements Nonadjustable metallic fittings Adjustable finger-tight fittings Agilent A-Line fittings Robustness over 200 reconnections Compatibility with different column brands Sample injections Setting the data collection rate 4142424244444646464730313132
Troubleshooting example: drifting baseline 75 Troubleshooting example: broadeningor splitting caused by high pH 77 Troubleshooting example: mobilephase modifiers and selectivity 77Optimizing your chromatographic conditionsfor reversed-phase chromatography 79 Isocratic optimization 80 Gradient optimization 83Polymeric columns for reversed-phasechromatography 85A step-by-step guide for 'hands-on' isocraticmethod development in reversed-phasechromatography 86Tips for transferring methods fromconventional columns to high efficiency columns 88Automated method development tools 90Method development for other HPLC modes 92 HILIC 92 Normal phase chromatography 94 Ion-exchange chromatography 96 Gel permeation chromatography/sizeexclusion chromatography 97Dwell volume and its impact on chromatography 48 Measuring your system’s dwell volume 50 Evaluating the impact of dwell volume 52 Dwell volume and analysis time 53Chelating compounds 53pH and mobile phase modifiers 54Working with gradients 55Optimizing column re-equilibration 56Column aging 58 Loss of bonded phase 58Cleaning a reversed-phase silica column 58Cleaning a normal phase silica column 59Cleaning a reversed-phase polymeric column 59Method development 61Method development: where to start Mode Selection Choosing the column and packingdimensions Choosing the stationary phase Method development for reversed-phasechromatography 6262Selection of stationary phase for reversedphase chromatography Selection of mobile phase solvents forreversed-phase chromatography Working with mobile phases Troubleshooting mobile phases andmobile phase modifiers Mixing mobile phases Degassing mobile phases Managing your pH with mobile phase modifiers Common buffers for UV detectors Considerations for LC/MS Troubleshooting issues with mobilephase modifiers 656666LC/MS InstrumentationFundamentals 6698What is LC/MS What information does LC/MS provide Types of LC/MS instruments Single-quadrupole instruments Triple-quadrupole instruments Time-of-flight and quadrupole timeof-flight instruments Uniform field ion mobility MS/MS – breaking down a compound forextra specificity 6969697070707273989910010010010010110175Continued on next page3
Column care and storage Maximizing column lifetime Care in storage Unblocking a column Quickly determining when a column is goingbad Ensuring method reproducibility around theworld Increasing method robustness A reminder about dwell volumeimplications Ionization of compounds 102 Electrospray ionization 102 Atmospheric pressure chemical ionization 102 Atmospheric pressure photo ionization 102Tips for developing methods with LC/MS Solvent selection for ESI-MS Solvent selection for APCI-MS andAPPI-MS Solvent selection for ion pairchromatography with MS Sample preparation Matrix components Concentration issuess Ion suppression considerations Considerations for using LC/MS with highefficiency columns Improvements in sensitivity MS scan rates System Dispersion LC/MS software Types of scans – comparing TIC, EICand SIM Personal compound databases andlibraries Protecting yourchromatographic results Scalability The importance of using high-quality-gradesolvents Special considerations for UHPLC Inline filters Low-volume inline filters Guard columns Solvent-saturation columns Column inlet frits ck troubleshooting reference 122Tips for effective troubleshooting 122Useful references 128USP designations Solvent miscibility UV cutoffs for mobile phase modifiers Solid Phase Extraction sorbents SPE sorbent conditions Other suggested reading Other Agilent resources 128134137138139140140Glossary 141Index 169Agilent Products andordering information 174
IntroductionWhere to begin? Liquid chromatography is a vast andcomplex subject, but one for which we never lose ourinterest.Chromatographers around the world are using HPLC techniques to ensure the safety of our food and water,develop life-saving pharmaceutical products, protect our environment, guard public health, and that’s justthe start of it. The more you know about chromatography, the more you can get done with this amazingtechnology.Today, you have more choices of columns and packing materials to suit an ever expanding range of uses.Agilent now offers more than 2,000 column choices covering the broadest array of applications and conditions.This increases your opportunities to select the most appropriate column for your needs.As part of our commitment to helping you get the best results from your liquid chromatography, we havecompiled this handy guide to choosing LC columns, with plenty of tips and tricks to make your job easier andmore productive. In addition, we’ve drawn on more than 40 years of experience to provide suggestions forovercoming some of the common problems that can occur with columns and fittings in everyday use. The guidecovers the main columns used in LC, with particular emphasis on reversed-phase high performance liquidchromatography.How to use this guide: Sections are color-coded for your easy reference. The glossary in the back is fairly comprehensive. It’s intended to be a good resource, although we have nottouched on every glossary term in the rest of the book, due to space considerations. This book primarily focuses on reversed-phase HPLC although we highlight other techniques elsewhere inthe book.5
Essential chromatographyconceptsWe all remember the feeling we had in school as welearned math, wondering how it would actually come intopractical use. Scientists have to learn more math thanmany professionals, and this section reminds us why.Here, we will briefly review the equations and theory behind many of the concepts that drive chromatography.Understanding these concepts will help you to get the best results, and to troubleshoot if you encounterproblems.We start with fundamentals of performance: Efficiency Retention Selectivity Resolution PressureThese are all key to understanding how to optimize results and successfully develop methods.We also explore a few more complex concepts: van Deemter curves The gradient equationThese two topics are also important for method development.6
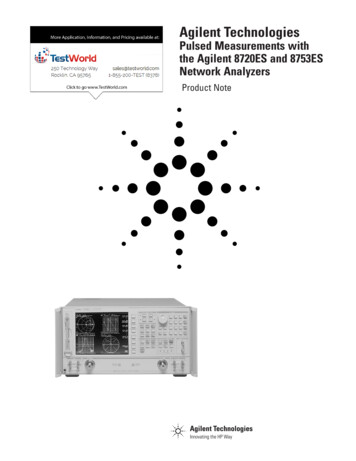
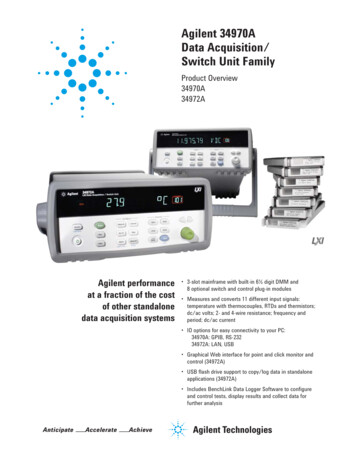
Efficiency (N)Column efficiency is used to compare the performance of different columns. It is probably the most frequentlycited parameter of column performance and is expressed as the theoretical plate number, N.Equation 1. Efficiency equationEquation 2. Alternate equation for calculating efficiencyColumns with high plate numbers are more efficient. A column with a high N will have a narrower peak at agiven retention time than a column with a lower N number.EfficiencyN 16 (t R /w t)2For Peak B, 16(4.5 min./0.9 min.)2 400platesk (t R-t 0)/t 0Retentionk A (2.5 - 1)/1 1.5k B (4.6 - 1)/1 3.6k C (6.2 - 1)/1 5.2Selectivity (C-B)α k 2 /k1α kc/k b 5.2/3.6 1.44α 1.44Selectivity (B-A)α k 2 /k1α k b/ka 3.6/1.5 2.4α 2.4Figure 1. Chromatographic illustration of efficiency, retention factor and resolution7
If we measure the distance t w here (Figure 1), by drawing tangent lines to approximate the four-sigma peakwidth, we can measure the theoretical plates for peak B, using Equation 1, N 16 (tR /t W )2. Sometimes thefour-sigma peak width is difficult to measure (e.g., with a noisy baseline), so an alternate equation (Equation 2)involves measuring the peak width at half-height (w1/2): N 5.54 (tR /w1/2)2.High column efficiency is beneficial since less selectivity is required to completely resolve narrow peaks.Column efficiency is affected by column parameters (diameter, length, particle size), the type of eluent(especially its viscosity), and flow rate or average linear velocity. Efficiency is also affected by the compoundand its retention. When comparing columns, the number of theoretical plates per meter (N/m) is often used.However, the same chromatographic temperature conditions and peak retention (k) are required for thecomparison to be valid. On stationary phases where α is small, more efficient columns are beneficial.Retention factor (k)Formerly referred to as capacity factor or k (k prime), the retention factor measures the period of time thatthe sample component resides in a stationary phase relative to the time it resides in the mobile phase. It iscalculated from the retention time divided by the time for an unretained peak (t 0).Equation 3. Retention factor equationSelectivity or separation factor (α)The separation factor is a measure of the time or distance between the maxima of two peaks. If α 1, the twopeaks have the same retention time and co-elute.Equation 4. Selectivity equation8
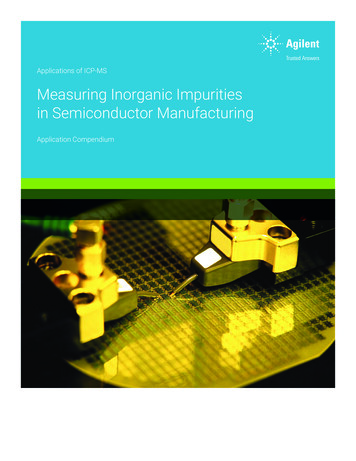
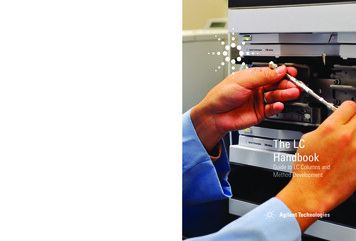
Selectivity is defined as the ratio in capacity factors. In Figure 1, you will see that there is better selectivitybetween peaks A and B than between B and C. Calculations are provided to demonstrate.Selectivity can be changed by changing the mobile phase constituents or changing the stationary phase.Temperature may also be a factor in adjusting selectivity.Resolution (Rs)Resolution describes the ability of a column to separate the peaks of interest, and so the higher the resolution,the easier it is to achieve baseline separation between two peaks. Resolution takes into considerationefficiency, selectivity and retention, as can be seen in Equation 5. One can improve resolution by improving anyone of these parameters.Equation 5. Resolution equationIn Figure 2, we see the different effects of each component on the separation process. All of these terms showa diminishing return. This means that the more you try to work on something to improve the separation, theless effective it will become.If you double the column length, you will obtain more theoretical plates, but your separation will take twice aslong; you will only get a square root of 2, or 1.4 improvement in the resolution.A value of 1 is the minimum for a measurable separation to occur and to allow adequate quantitation. A valueof 0.6 is required to discern a valley between two equal-height peaks. Values of 1.7 or greater generally aredesirable for rugged methods. A value of 1.6 is considered to be a baseline separation and ensures the mostaccurate quantitative result.9
Figure 2. Resolution as a function of selectivity, column efficiency or retentionPressureThe pressure equation (Equatio
01.02.2016 · This increases your opportunities to select the most appropriate column for your needs. As part of our commitment to helping you get the best results from your liquid chromatography, we have compiled this handy guide to choosing LC columns, with plenty of tips and tricks to make your job easier and more productive. In addition, we’ve drawn on more than 40 years of experience to provide