Transcription
Applied MathematicsforBusiness andEconomicsNorton UniversityYear 2010
Lecture NoteApplied Mathematics forBusiness and Economics
ContentsPageChapter 1Functions1 Definition of a Function (of one variable) .11.1 Definition .11.2 Domain of a Function .11.3 Composition of Functions .22 The Graph of a Function .33Linear Functions .53.1 The Slope of a Line .53.2 Horizontal and Vertical Lines .63.3 The Slope-Intercept Form .63.4 The Point-Slope Form .64Functional Models .84.1 A Profit Function .84.2 Functions Involving Multiple Formulas .84.3 Break-Even Analysis .94.4 Market Equilibrium .11Chapter Exercises.12Chapter 2Differentiation: Basic Concepts1 The DerivativeDefinition .192Techniques of Differentiation .202.1 The Power Rule.202.2 The Derivative of a constant .212.3 The Constant Multiple Rule .212.4 The Sum Rule .212.5 The Product Rule .212.6 The Derivative of a Quotient .213The Derivative as a Rate of change .223.1 Average and Instantaneous Rate of Change .223.2 Percentage Rate of Change .234 Approximation by Differentials; Marginal Analysis .234.1 Approximation of Percentage change .244.2 Marginal Analysis in Economics .254.3 Differentials .275The Chain Rule .276Higher-Order Derivatives .296.1 The Second Derivative .296.2 The nth Derivative .30
7Concavity and the Second Derivative Test .30Applications to Business and Economics .348.1 Elasticity of Demand . 348.2 Levels of Elasicity of Demand .368.3 Elasticity and the Total Revenue .36Chapter Exercises.388Chapter 3Functions of Two Variables1 Functions of Two Variables .492Partial Derivatives .502.1 Computation of Partial Derivatives .502.2 Second-Order Partial Derivatives .523The Chain Rule; Approximation by the Total Differential .533.1 Chain Rule for Partial Derivatives .533.2 The Total differential .553.3 Approximation of Percentage Change .564Relative Maxima and Minima .565Lagrange Multipliers.595.1 Contrained Optimization Problems.595.2 The Lagrange Multiplier .61Chapter Exercises.62Linear Programming (LP)Chapter 41 System of Linear Inequalities in Two Variables.721.1 Graphing a Linear Inequality in Two Variables .721.2 Solving Systems of Linear Inequalities .732Geometric Linear Programming .74Chapter Exercises. 77Bibliography . 81
This page is intentionally left blank.
Lecture NoteFunctionChapter 1Functions1Definition of a Function1.1 DefinitionLet D and R be two sets of real numbers. A function f is a rule that matches eachnumber x in D with exactly one and only one number y or f ( x ) in R . D is called thedomain of f and R is called the range of f . The letter x is sometimes referred to asindependent variable and y dependent variable.Examples 1:Let f ( x) x 3 2 x 2 3 x 100 . Find f ( 2 ) .Solution:f ( 2 ) 23 2 2 2 3 2 100 106Examples 2A real estate broker charges a commission of 6% on Sales valued up to 300,000. Forsales valued at more than 300,000, the commission is 6,000 plus 4% of the salesprice.a. Represent the commission earned as a function R.b. Find R (200,000).c. Find R (500,000).Solutionfor 0 x 300, 000 0.06 xa. R ( x ) 0.04 x 6000 for x 300, 000b. Use R ( x ) 0.06 x since 200, 000 300, 000R ( 200, 000 ) 0.06 200, 000 12, 000c. Use R ( x ) 0.04 x 6000 since 500, 000 300, 000R ( 500, 000 ) 0.04 500, 000 6000 26, 0001.2 Domain of a FunctionThe set of values of the independent variables for which a function can be evaluated iscalled the domain of the function.D { x \ / y \ , y f ( x )}Example 3Find the domain of each of the following functions:1a. f ( x ) , b. g ( x ) x 2x 3Solutiona. Since division by any real number except zero is possible, the only value of x1for which f ( x ) cannot be evaluated is x 3 , the value that makes thex 3denominator of f equal to zero, or D \ {3} .1
Lecture NoteFunctionb. Since negative numbers do not have real square roots, the only values of x forwhich g ( x ) x 2 can be evaluated are those for which x 2 is nonnegative,that is, for which x 2 0 or x 2 or D [ 2, ) .1.3 Composition of FunctionsThe composite function g h ( x ) is the function formed from the two functions g ( u )and h ( x ) by substituting h ( x ) for u in the formula for g ( u ) .Example 4Find the composite function g h ( x ) if g ( u ) u 2 3u 1 and h ( x ) x 1 .SolutionReplace u by x 1 in the formula for g to get.2g h ( x ) ( x 1) 3 ( x 1) 1 x 2 5 x 5Example 5An environmental study of a certain community suggests that the average daily levelof carbon monoxide in the air will be C ( p ) 0.5 p 1 parts per million when thepopulation is p thousand. It is estimated that t years from now the population of thecommunity will be P ( t ) 10 0.1t 2 thousand.a. Express the level of carbon monoxide in the air as a function of time.b. When will the carbon monoxide level reach 6.8 parts per million?Solutiona. Since the level of carbon monoxide is related to the variable p by the equation.C ( p ) 0.5 p 1and the variable p is related to the variable t by the equation.P ( t ) 10 0.1t 2It follows that the composite functionC P ( t ) C (10 0.1t 2 ) 0.5 (10 0.1t 2 ) 1 6 0.05t 2expresses the level of carbon monoxide in the air as a function of the variable t.b. Set C P ( t ) equal to 6.8 and solve for t to get6 0.05t 2 6.80.05t 2 0.8t 2 16t 4That is, 4 years from now the level of carbon monoxide will be 6.8 parts per million.2
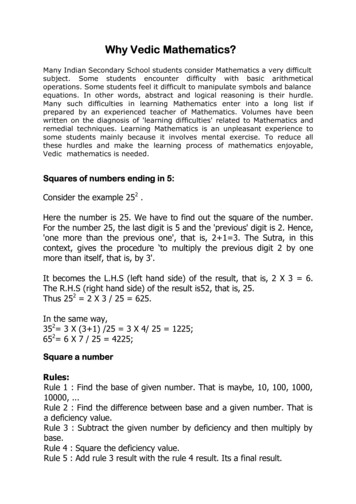
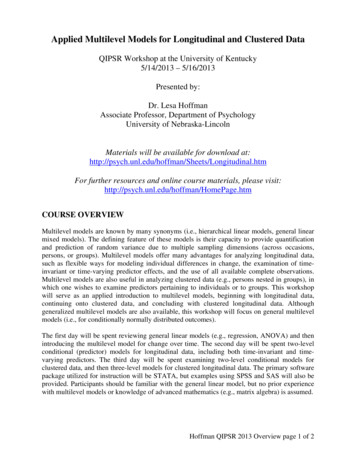
Lecture NoteFunction2 The Graph of a FunctionThe graph of a function f consists of all points ( x, y ) where x is in the domain of f andy f ( x) .How to Sketch the Graph of a Function f by Plotting Points1Choose a representative collection of numbers x from the domain of f andconstruct a table of function values y f ( x ) for those numbers.2Plot the corresponding points ( x, y )3Connect the plotted points with a smooth curve.Example 1Graph the function y x 2 . Begin by constructing the table.01x 2 12y x410124y43-2-1x12Example 2 Graph the functionif 0 x 1 2 x, 2 f ( x) , x 3,if 1 x 4if x 4SolutionWhen making a table of values for this function, remember to use the formula that isappropriate for each particular value of x. Using the formula f ( x ) 2 x when 0 x 1, the formula f ( x ) 2 x when 1 x 4 and the formula f ( x ) 3 when x 4 , you cancompile the following table:xf ( x)001/21122132/3435363Now plot the corresponding point ( x, f ( x ) ) and draw the graph as in Figure.3
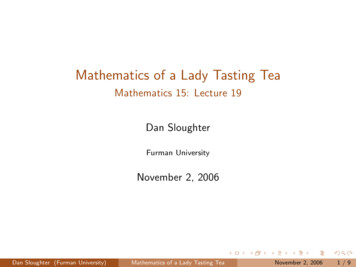
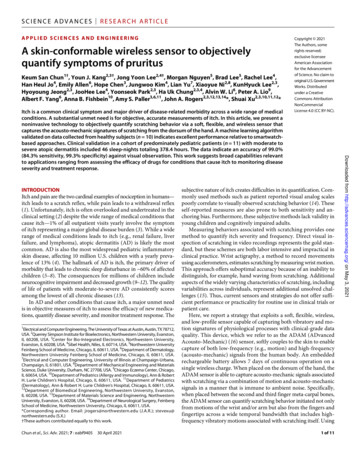
Lecture NoteFunctiony321½ 123456xCommentThe graph of y f ( x ) ax 2 bx c is a parabola as long as a 0 . Allparabolas have a U shape, and y f ( x ) ax 2 bx c opens either up(if a 0 ) or down (if a 0 ). The “Peak” or “Valley” of the parabola is calledbits vertex, and in either case, the x coordinate of the vertex is x .2aNote that to get a reasonable sketch of the parabola y ax 2 bx c , you needonly determine.1 The location of the vertex2 Whether the parabola opens up ( a 0 ) or down ( a 0 )3 Any intercepts.Example 3For the equation y x 2 6 x 4a. Find the Vertex.b. Find the minimum value for y.c. Find the x-intercepts.d. Sketch the graph.Solution 6 32 1Substituting x 3 gives y 32 6 3 4 5 . The vertex is ( 3, 5 ) .a. We have a 1, b 6, and c 4 . The vertex occurs at x b. Since a 1 0 and the parabola opens upward, y 5 is the minimumvalue for y.c. The x-intercept are found by setting x 2 6 x 4 0 and solving for x6 36 16x 3 52d. The graph opens upward because a 1 0 .The vertex is ( 3, 5 )The axis of symmetry is x 3 .The x-intercepts are x 3 5 .4
Lecture NoteFunctionY543y x2-6x 4213- 53 5X-1-2-3-4-5(3;-5)Example 4A manufacturer can produce radios at a cost of 10 apiece an estimated that if they aresold for x dollars, consumers will buy approximately 80 x radios each month.Express the manufacturer’s monthly profit as a function of the price x, graph thisfunction, and determine the price at which the manufacture’s profit will be greatest.SolutionBegin by stating the desired relationship in words:Profit (number of radios sold) (profit per radio)Now replace the words by algebraic expressions. You know that :Number of radios sold 80 – xand since the radios are produced at a cost of 10 apiece and sold for x dollarsapiece,It follows that profit per radio 80 xLet P ( x ) denotes the profit and conclude thatP ( x ) ( 80 x )( x 10 ) x 2 90 x 8003 Linear FunctionsLinear function is a function that changes at a constant rate with respect to itsindependent variable. The graph of a linear function is a straight line. The equation ofa linear function can be written in the formy mx bwhere m and b are constants.3.1 The Slope of a LineThe slope of a line is the amount by which the y coordinate of a point on the linechanges when the x coordinate is increased by 1.5
Lecture NoteFunctionThe Slope of a LineThe slope of the nonvertical line passing thruough the points( x1 , y1 ) and ( x2 , y2 ) is given by the formulaSlope Δy y2 y1 Δx x2 x1y( x2 , y2 ) ( x1 , y1 ) x2 x1 Δxy2 y1 ΔyxExample 1Find the slope of the line joining the points ( 2, 5 ) and ( 3, 1) .3.2 Horizontal and Vertical LinesThe horizontal line has the equation y b , where b is a constant. Itsslope is equal to zero. The vertical line has the equation x c , wherec is a constant. Its slope is undefined. See the figure.yy( 0,b ) x cy bxHorizontal line( c, 0 ) xVertical line3.3 The Slope-Intercept FormThe Slope-Intercept Form of the Equation of a LineThe equationy mx bis the equation of the line whose slope is m and whose y interceptis the point ( 0, b )Example 2Find the slope and y intercept of the line 3 y 2 x 6 and draw the graph.3.4 The Point-Slope FormThe Point-Slope Form of the Equaiton of a LineThe equation y y0 m ( x x0 ) is and equation of the line thatpasses through the point ( x0 , y0 ) and that slope equal to m.Example 3Find an equation of the line that passes through the point ( 5,1) andwhose slope is equal to1/2.Example 4Find an equation of the line that passes through the points ( 3, 2 ) and (1, 6 ) .6
Lecture NoteFunctionExample 5Since the beginning of the year, the price of whole-wheat bread at a local discountsupermarket has been rising at a constant rate of 2 cents per month. By November 1,the price had reached 1.06 per loaf. Express the price of the bread as a function oftime and determine the price at the beginning of the year.01210Nov. 1Jan. 1SolutionLetx: denote the number of months that have elapsed since January 1y: denote the price of a loaf of bread (in cents).Since y changes at a constant rate with respect to x, the function relating y to x mustbe linear and its graph is a straight line. Because the price y increases by 2 each time xincrease by 1, the slope of the line must be 2. Then, we have to write the equation ofthe line with slope 2 and passes throught the point (10,106 ) . By the fomular, weobtainy y0 m ( x x0 )y 106 2 ( x 10 )ory 2 x 86At the beginning of the year, we have x 0 , then y 86 . Hence, the price of tbreadat the beginning of the year was 86 cents per loaf.Example 6The average scores of incoming students at an eastern liberal arts college in the SATmathematics examination have been declining at a constant rate in recent years. In1986, the average SAT score was 575, while in 1991 it was 545.a. Express the average SAT score as a function of time.b. If the trend continues, what will the average SAT score of incoming studentsbe in 1996?c. If the trend continues, when will the average SAT score be 527?(Answer: a. y 6 x 575 , b. 515, c. 8)Example 7A manufacturer’s total cost consists of a fixed overhead of 200 plus productioncosts of 50 per unit. Express the total cost as a function of the number of unitsproduced and draw the graph.SolutionLet x denote the number of units produced and C(x) the corresponding total cost.Then, Total cost (cost per unit) (number of units) overhead.WhereCost per unit 50Number of units xOverhead 200Hence,C(x) 50x 2007
Lecture NoteFunction700600500400350C(x) 50x 200(2,300) (3,350)3002001000412345xFunctional Models4.1 A Profit FunctionIn the following example, profit is expressed as a function of the price at which aproduct is sold.Example 1A manufacturer can produce radios at a cost of 2 apiece. The radios have beenselling for 5 apiece, and at this price, consumers have been buying 4000 radios amonth. The manufacturer is planning to raise the price of the radios and estimate thatfor each 1 increase in the price, 400 fewer radios will be sold each month. Expressthe manufacturer’s monthly profit as a function of the price at which the radios aresold.SolutionBegin by stating the desired relationship in words.Profit (number of radios sold) (Profit per radio)Let x denote the price at which the radios will be sold and P ( x ) the correspondingprofit.Number of radios sold 4000 – 400 (number of 1 increases) the number of 1 increases in the price is the difference x-5 between the new and old selling prices.Hence,Number of radios sold 4000 – 400 (x - 5) 400[10 ( x 5)] 400(15 x)Profit per radio x – 2P ( x ) 400 (15 x )( x 2 )4.2 Functions Involving Multiple FormulasIn the next example, you will need three formulas to define the desiredfunction.Example 2During a drought, residents of Marin Country, California, were faced with a severewater shortage. To discourage excessive use of water, the country water districtinitiated drastic rate increases. The monthly rate for a family of four was 1.22 per100 cubic feet of water for the first 1,200 cubic feet, 10 per 100 cubic feet for the8
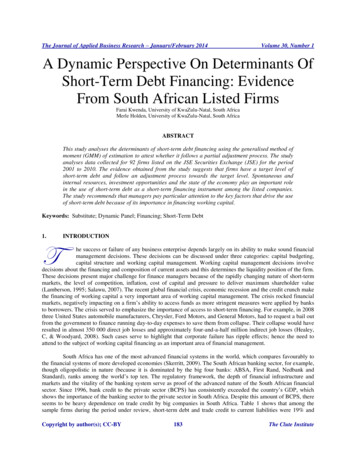
Lecture NoteFunctionnext 1200 cubic feet, and 50 per 100 cubic feet there after. Express the monthlywater bill for a family of four as a function of the amount of water used.SolutionLet x denote the number of hundred-cubic-feet units of water used by the familyduring the month and C ( x ) the corresponding cost in dollars. If 0 x 12 , the cost issimply the cost per unit times the number of units used.C ( x ) 1.22 xIf 12 x 24 each of the first 12 units cost 1.22, and so the total cost of these 12 units is1.22(12) 14.64 dollars. Each of the remaining x 12 units costs 10, and hence the totalcost of these units is 10 ( x 12 ) dollars. The cost of all x units is the sum.C ( x ) 14.64 10 ( x 12 ) 10 x 105.36If x 24 , the cost of the first 12 units is 1.22 (12) 14.64 dollars, the cost of the next 12units is 10 (12) 120, and the cost of the remaining x 24 units is so ( x 24 ) dollars. Thecost of all x units is the sum.C ( x ) 14.64 120 50 ( x 24 ) 50 x 1, 065.36Combining these three formulas, you get.if 0 x 12 1.22 x, C ( x ) 10 x 105.36 if 12 x 24 50 x 1, 065.36 if x 24 The graph of this functionx0122430C(x)014.64134.64434.64C(x)450 400 350 300 -.250 200 150 -.100 50-. . . . . .612182430X4.3 Break-Even AnalysisIntersections of graphs arise in business in the context of break-even analysis. In a typicalsituation, a manufacturer wishes to determine how many units of a certain commodity have tobe sold for total revenue to equal total cost. Suppose x denotes the number of unitsmanufactured and sold, and let C ( x ) and R ( x ) be the corresponding total cost and totalrevenue, respectively. A pair of cost and revenue curves is sketched in Figure:9
Lecture NoteFunctionyRevenue: y R ( x )Break-even pointProfitP Cost: y C ( x )Lossx0Example 3The Green-Belt Company determines that the cost of manufacturing men’s belts is 2each plus 300 per day in fixed costs. The company sells the belts for 3 each. Whatis the break-even point?SolutionThe break-even point occurs where revenue and cost are equal. By letting x thenumber of belts manufactured in a day, and then we obtain revenue funcionR ( x ) 3 x and cost function C ( x ) 2 x 300 . For C ( x ) R ( x ) , we obtain3 x 2 x 300x 300So, 300 belts must be sold each day for the company to break even. The companymust sell more than 300 belts each day to make a profit.YProfitC(x) 2x 3001000 900 -Break-even point800 700 600 -Loss500 -R(x) 3x400 300 200 100 -.0100. . . . .200300400500600XExample 4Suppose that a company has determined that the cost of producing x items is500 140x and that the price it should charge for one item is P 200 – xa. Find the cost function.b. Find the revenue function.c. Find the profit function.d. Find the break-even pointSolutiona. The cost function is given: C ( x ) 500 140 x10
Lecture NoteFunctionb. The revenue function is found by multiplying the price for one item by thenumber of items sold.R ( x ) P x ( 200 x ) x 200 x x 2c. Profit is the difference between revenue and costP ( x) R ( x) C ( x) ( 200 x x 2 ) ( 500 140 x ) x 2 60 x 500d. To find the break- event, set the revenue equal to the cost and solve for xR ( x) C ( x)200 x x 2 500 140 xx 2 60 x 500 0( x 10 )( x 50 ) 0x 10 or x 50This model shows that a profit occurs if the company produces between 10 and 50items. We will discuss calculus techniques for maximizing profit later.4.4 Market EquilibriumAn important economic application involving intersections of graphs arises inconnection with the law of supply and demand. In this context, we think of themarket price p of a commodity as determining the number of units of the commoditythat manufacturers are willing to supply as well as the number of units that consumersare willing to buy. In most cases, manufacturers’s supply S ( p ) increases andconsumers’demand D ( p ) decreases as the market price p increases. See the figure.qSupply: q S ( p )EquilibriumpointShortage SurplusDemand: q D ( p )ppEquilibriumpriceThe point of intersection of the supply and demand curves is called the point ofmarket equilibrium. The p coordinate of this point (the equilibrium price) is the11
Lecture NoteFunctionmarket price at which supply equals demand. We can say another way that the marketprice is a price at which there will be neither a surplus nor a shortage of the commodity.Example 5Find the equilibrium price and the corresponding number of units supplied anddemanded if the supply function for a certain commodity is S ( p ) p 2 3 p 70 andthe demand function is D ( p ) 410 p .SolutionSet S ( p ) equal to D ( p ) and solve for p to getp 2 3 p 70 140 pp 2 4 p 480 0( p 20 )( p 24 ) 0p 20 or p 24Hence we conclude that the equilibrium price is 20. Since the corresponding supply anddemand are equal, we use the simpler demand equation to compute this quantity to getD ( 20 ) 410 20 390Hence, 390 units are supplied and demanded when the market is in equilibrium.Exercises1 cUrKNnatémøGnuKmn eTAtamkarbBa ak;dUcxageRkam (Compute the indicated values of thegiven function)a. f ( x ) 3 x 2 5 x 2; f (1) , f ( 0 ) , f ( 2 )b. g ( x ) x 1; g ( 1) , g (1) , g ( 2 )x2c. h ( t ) t 2t 4, h ( 2 ) , h ( 0 ) , h ( 4 )d. f ( t ) ( 2t 1) 3 2 3 e. f ( t ) t 1 t; f (1) , f ( 5 ) , f (13 )if t 5if 5 t 5 ; f ( 6 ) , f ( 5 ) , f (16 )if t 52 cUrbBa ak;GMBIEdnkMNt;rbs;GnuKmn dUcxageRkam(Specify the domain of the given function)x2 1x 232d. f ( t ) ( 2t 4 )a. g ( x ) b. y 2c. g ( t ) t 9x 5(e. f ( x ) x 2 9) 1 23 ePT cMnYn q ÉktaRtUvkMNt;edayGnuKmnC ( q ) q 30q 400q 500 .k KNnaéføedImelIkarplitcMnYn 20Ékta.x KNnaéføedImelIkarplitÉktaTI20.3212
Lecture NoteFunction(Suppose the total cost of manufacturing q units of a certain commodity is given by thefunction C ( q ) q 3 30q 2 400q 500 . a. Compute the cost of manufacturing 20units. b. Compute the cost of manufacturing the 20th unit.) (Answer: a. 4,500 b. 371)4 rkGnuKmn bNþak; (Find the composite function) g h ( x ) a. g ( u ) u 2 4, h ( x ) x 1b. g ( u ) 3u 2 2u 6,h ( x) x 2c. g ( u ) ( u 1) 2u 2 , h ( x ) x 13d. g ( u ) 1,u2h ( x) x 1e. g ( u ) u 2 , h ( x ) 1x 15 rkGnuKmn bNþak;tamkarbBa ak;dUcxageRkam (find the indicated composite function)a. f ( x 1) where f ( x ) x 2 5b. f ( x 2 ) where f ( x ) 2 x 2 3 x 1c. f ( x 1) where f ( x ) ( x 1) 3 x 252 1 x x 2e. f ( x 3 x 1) where f ( x ) xd. f where f ( x ) 3x d. f ( x 1) where f ( x ) 6 rkGnuKmn h ( x ) nig g ( u ) Edl(a. f ( x ) x 5 3 x 2 12)x 1xf ( x ) g h ( x ) b. f ( x ) 3x 53c. f ( x ) ( x 1) 2 ( x 1) 32e. f ( x ) x 3 d. f ( x ) x 4 1( x 4)31( x 4)37 enAkñúgeragcRkmYy éføedImsrubelIkarplit q ÉktakñúgkMlugénsgVak;plitkmμRbcaMéf¶ KWC ( q ) q q 900 duløa. kñúgmYyéf¶ brimaNplitpl q ( t ) 25t ÉktaRtUv)anplitkñúgry³ eBl t dMbUgénExSsgVak;plitkmμ. k cUrsresr éføedImsrubelIkarplitCaGnuKmn én t .x etInwgRtUv cMNayb:unμanelIplitkmμ enAcugem:agTI3? K etIenAeBlNaEdléføedImsrubelIkarplitmandl; 11, 000 ? (At a certain factory, the total cost of manufacturing q units2during the daily production run is C ( q ) q 2 q 900 dollars. On a typicalworkday, q ( t ) 25t units are manufactured during the first t hours of aproduction run. a. Express the total manufacturing cost as a function of t. b.Howmuch will have been spent on production by the end of the 3rd hour?) c. When willthe total manufacturing cost reach 11,000?13
Lecture NoteFunction(Answer: a. C q ( t ) 625t 2 25t 900 b. 6,600 c.After 4 hours)8 enAkñúgesdæviTüa itpl ehIyesμIeTAnwgplKuNrvagéfølk; p kñúgmYyÉkta nig cMnYn x ÉktaénplitplEdl)anlk;. mann½yfaR xp . RkwtüRkmtRmUvkar Ecgfa p nig x Tak;TgKña. ebImYyekIneLIg enaHmYyeTotRtUvfycuH. ]bmafa p nig x Tak;TgKñatamry³ smIkartRmUvkar p x 20, 0 x 200 .cUrsresrkenSamR)ak;cMNUl R CaGnuKmn én x . (In economics, revenue R is defined as110the amount of money derived from the sale of a product and is equal to the unitselling price p of the product times the number x of units actually sold. That is,R xp . In economics, the Law of Demand states that p and x are related: As oneincreases, the other decrease. Suppose that p and x are related by the followingdemand equation: p 101 x 20, 0 x 200 . Express the revenue R as a functionof the number x of units sold.) (Answer: R ( x ) 110 x 2 20 x )9 éfø pnigbrimaN xénplitplmYyEdl)anlk; eKarBeTAtamsmIkartRmUvkar1p x 100, 0 x 600 .6k sresrkenSamR)ak;cMNUlCaGnuKmn eTAnwg xx ebIeKlk;plitplGs;200Ékta etIR)ak;cMNUlesIμb:unμan?K sg;RkahVrbs;GnuKmn enH.X etIxesμIb:unμanEdlnaM[R)ak;cMNUlGtibrma? etItémøGtibrmaenaHesμIb:unμan?g rktémølk;EdlRkumh‘unRtUvkMNt; edIm,I[R)ak;cMNUlGtibrma.(The price p and the quantity x sold of a certain product obey the demand equation1p x 100, 0 x 6006a. Express the revenue R as a function of x. (Remember, R xp )b. What is the revenue of the company if 200 units are sold?c. Graph the revenue function.d. What quantity x maximizes revenue? What is the maximum revenue?e. What price should the company charge to maximize revenue?)(Ans: a. R ( x ) 16 x 2 100 x , b. 13,333.33, c. 15,000 d. x 300 , 15,000 e. 50)10 éfø pnigbrimaN xénplitplmYyEdl)anlk; eKarBeTAtamsmIkartRmUvkarx 5 p 100, 0 p 20 .k sresrkenSamR)ak;cMNUlCaGnuKmn eTAnwg xx ebIeKlk;plitplGs;15Ékta etIR)ak;cMNUlesIμb:unμan?K sg;RkahVrbs;GnuKmn enH.X etIxesμIb:unμanEdlnaM[R)ak;cMNUlGtibrma? etItémøGtibrmaenaHesμIb:unμan?g rktémølk;EdlRkumh‘unRtUvkMNt; edIm,I[R)ak;cMNUlGtibrma.14
Lecture NoteFunction(The price p and the quantity x sold of a certain product obey the demandequation x 5 p 100, 0 x 20a. Express the revenue R as a function of x. (Remember, R xp )b. What is the revenue of the company if 15 units are sold?c. Graph the revenue function.d. What quantity x maximizes revenue? What is the maximum revenue?e. What price should the company charge to maximize revenue?)(Answer: a. R ( x ) 15 x 2 20 x , b. 255 c. 500 d. x 50 , 500 e. 10)11 gmYyeRKOg. ebIeKlk;m:aej:kñúgtémø x duløakñúgmYyeRKOg enaHGtifiCnnwgTij 120 x eRKOgkñúgmYyEx. cUrsresrkenSamR)ak;cMeNjRbcaMExrbs;]sSahkr CaGnuKmn nwgtémølk;. sg;RkahVrbs;GnuKmn rYctamry³enH cUr)a:n;sμanéfølk;EdlRbesIrbMput. (A manufacturer can produce cassette tape recorders at a cost of 20apiece. It is estimated that if the tape recorders are sold for x dollars a piece,consumers will buy 120 x of them a month. Express the manufacturer’smonthly profit as a function of price, graph this function, and use the graph toestimate the optimal selling price.)(Answer: P ( x ) ( x 20 )(120 x ) , Optimal price: 70 per recorder)12Write the equation for the line with the given propertiesa. Through ( 2, 0 ) with slope 1.b. Through ( 5, 2 ) with slope 12c. Through ( 2, 5 ) and parallel to the x axisd.Though (1, 0 ) and ( 0,1)e. Through ( 2, 5 ) and (1, 2 )f. Through (1, 5 ) and ( 3,5 )13 éføedImsrubrbs;]sSahkrN mñak; rYmmancMNayepSg²Edlefr KW 5000duløabUknwgéføedImplitkmμesμInwg 60 duløakñúgmYyÉkta. cUrsresrkenSaméføedImsrub CaGnuKmn éncMnYnÉktaEdl)anplitrYcsg;RkahV. (A manufacturer’s total cost consists of a fixed overhead of 5,000 plus production costs of 60 per unit. Express the total cost as a functionof the number of units produced and draw the graph.). (Ans: y 60 x 5, 000 )14 elakevC bNÐitmñak;manesovePAEpñkevC sa sþEdlmantémø1500duløa ;qñaM. mann½yfa témørbs;eso
Functions. 1 Definition of a Function . 1.1 Definition . Let . D. and . R. be two sets of real numbers. A